Review
. 2022 Apr:54:101070.
doi: 10.1016/j.dcn.2022.101070. Epub 2022 Jan 15.

Utility of linear mixed effects models for event-related potential research with infants and children

Affiliations
Review

Utility of linear mixed effects models for event-related potential research with infants and children

Megan J Heise et al. Dev Cogn Neurosci. 2022 Apr.

Abstract

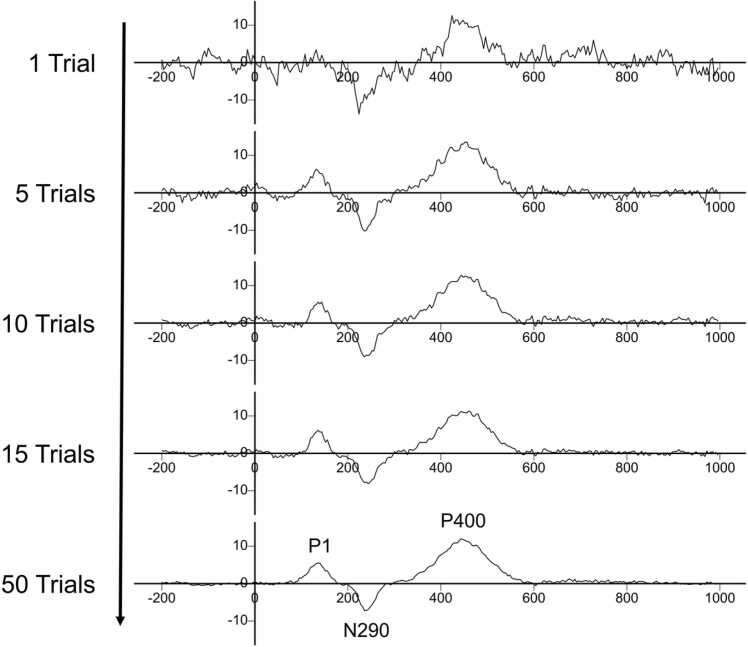
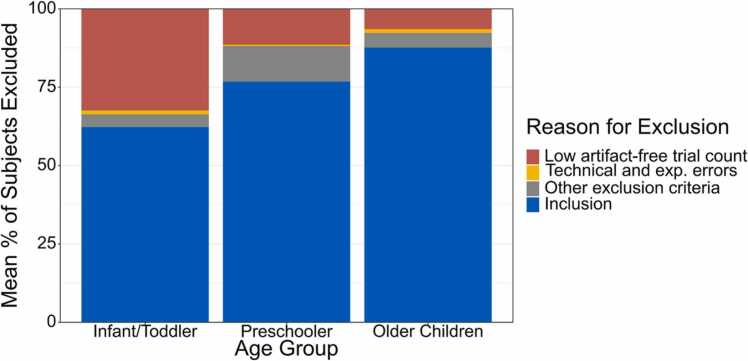
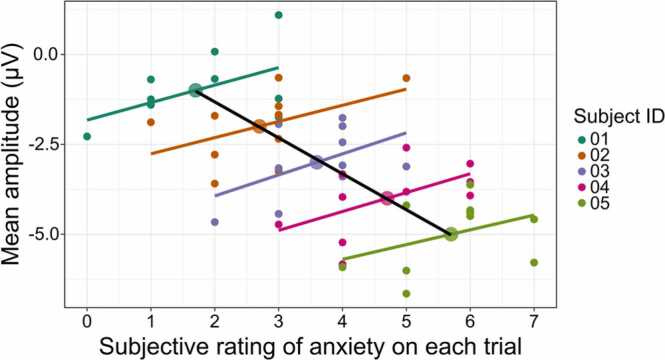
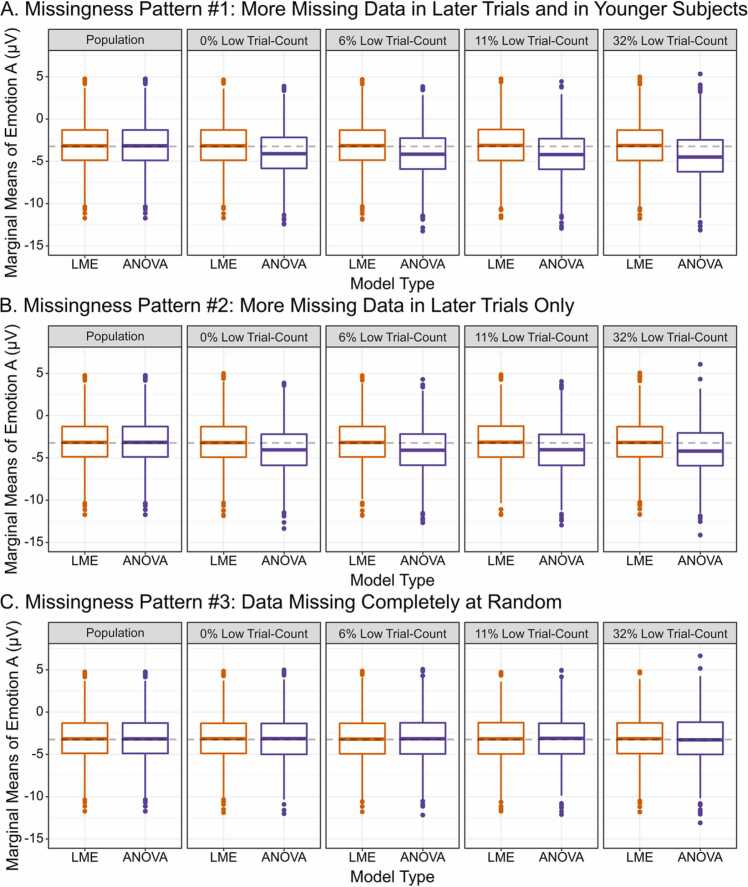
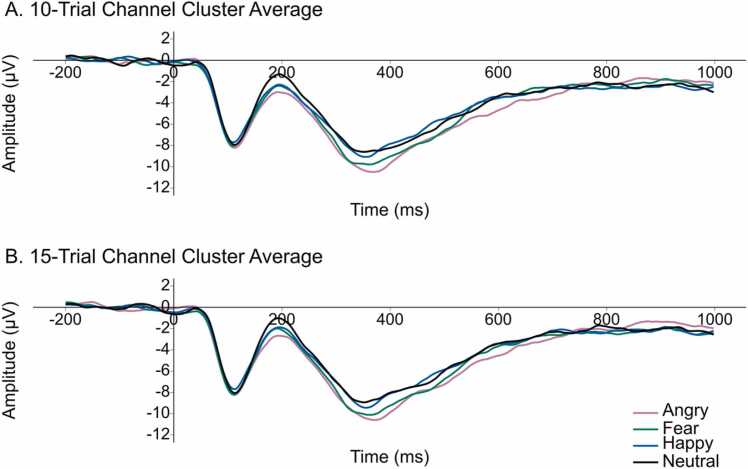
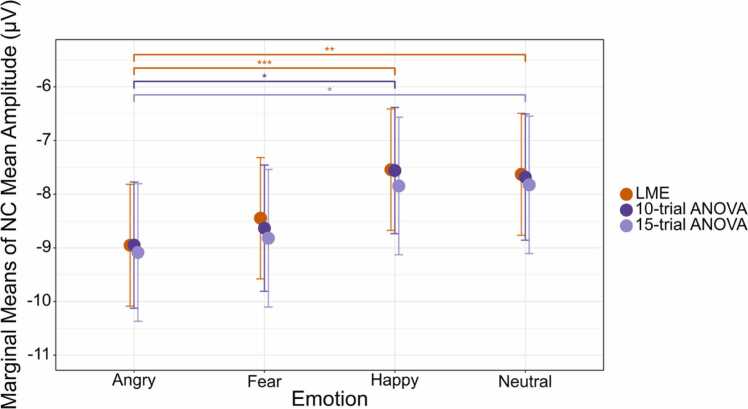
Event-related potentials (ERPs) are advantageous for investigating cognitive development. However, their application in infants/children is challenging given children's difficulty in sitting through the multiple trials required in an ERP task. Thus, a large problem in developmental ERP research is high subject exclusion due to too few analyzable trials. Common analytic approaches (that involve averaging trials within subjects and excluding subjects with too few trials, as in ANOVA and linear regression) work around this problem, but do not mitigate it. Moreover, these practices can lead to inaccuracies in measuring neural signals. The greater the subject exclusion, the more problematic inaccuracies can be. We review recent developmental ERP studies to illustrate the prevalence of these issues. Critically, we demonstrate an alternative approach to ERP analysis-linear mixed effects (LME) modeling-which offers unique utility in developmental ERP research. We demonstrate with simulated and real ERP data from preschool children that commonly employed ANOVAs yield biased results that become more biased as subject exclusion increases. In contrast, LME models yield accurate, unbiased results even when subjects have low trial-counts, and are better able to detect real condition differences. We include tutorials and example code to facilitate LME analyses in future ERP research.

Keywords: ERP; Emotion perception; Event-related potential; Linear mixed effects; Multilevel models; Negative central.


Conflict of interest statement

The authors declare that they have no known competing financial interests or personal relationships that could have appeared to influence the work reported in this paper.

Figures

Fig. 1
Fig. 1
Example of how single ERP trials are averaged within a condition to reveal a mean-averaged ERP waveform. As more trials are averaged together, noise from single trials are ‘averaged-out’ in order to measure latency-to-peak and amplitude of ERP components (e.g., P1, N290, P400).
Fig. 2
Fig. 2
Stacked bar plot of the mean percent of excluded subjects in studies requiring at least 10 trials/condition for ERP analysis (N = 53)1, representing the most common threshold used in our literature review (see Appendix A). All studies were published in the journal Developmental Cognitive Neuroscience from January 2011 to April 2021. Infant/Toddlers = 0- to 35-month-olds; Preschoolers = 3- to 5-year-olds; Older Children = 6- to 13-year-olds.
Fig. 3
Fig. 3
Illustration of Simpson’s Paradox, in which there are different within-subjects effects (shown here by colored lines indicating individual subjects’ regression lines) and between-subjects effects (shown here by the black regression line). Figure was created in the R package ‘correlation’ (Version 0.6.1; Makowski et al., 2020).
Fig. 4
Fig. 4
Marginal means of emotion A were extracted for 1000 simulated datasets. The population parameter of emotion A (averaged over age and presentation number) is indicated by the dashed line at − 3.25 μV. Means were estimated from datasets in which no trials were removed (Population), all subjects were assigned to have 10 or more trials (0% Low Trial-Count), and at varying percentages of low trial-count subjects taken from the Developmental Cognitive Neuroscience literature review. Percentages of low trial-count subjects represent the average percentage of casewise deletion in older children (6%), preschoolers (11%), and infants/toddlers (32%). Marginal means were extracted from each of the three patterns of missingness. For Missingness Pattern #3, missing trials were uniformly drawn from early and late trials and older and younger children.
Fig. 5
Fig. 5
ERP experimental design illustrating inter-trial interval, stimulus duration, and ERP extraction window. Before each trial, a fixation cross was presented for a random interval between 800 and 1400 ms. A neutral, happy, angry or fearful face was presented for 1000 ms in a random order and the same emotion was not presented for two consecutive trials. ERPs were baseline corrected using the mean amplitude from − 200–0 ms, in which 0 ms is time-locked to stimulus onset. ERPs were analyzed from 0 to 1000 ms post stimulus onset.
Fig. 6
Fig. 6
ERP experimental design shown for two example subjects (Subject 1 and 2). Data were analyzed from 3 electrode channels corresponding to the NC ERP component. In the present study’s final data set, there were 18 unique actors displaying emotions in 4 conditions. Electrode channel and emotion were fully-crossed within the study design (i.e., all subjects saw all emotions and had usable data from each electrode), and actor was partially-crossed (i.e., subjects in the same race condition saw the same set of actors, and subjects in other race conditions saw different actors).
Fig. 7
Fig. 7
The observed means of NC mean amplitude over repeated trial presentations (A, left). The marginal means of NC mean amplitude estimated by the LME model over repeated trial presentations (B, right). Error bars represent 95% confidence intervals. Trial repetitions for one actor in the African American condition presented 20 times are not plotted, but were estimated in the model.
Fig. 8
Fig. 8
Example single-trial waveforms for one subject in the dataset. For a single trial in a given condition, ERP data are noisy. However, LME is able to account for noise in single-trial data because it models the condition means and accounts for ‘nuisance’ variables that cause related trials to be more similar to each other.
Fig. 9
Fig. 9
Grand-mean average ERP waveforms for subjects with at least 10 trials/condition (N = 35, A, top) and at least 15 trials/condition (N = 28, B, bottom). Waveforms were collapsed across channels of interest (Cz, C3, and C4).
Fig. 10
Fig. 10
Marginal means compared across the three models: LME, repeated measures ANOVA at 10 trials/condition casewise deletion, and repeated measures ANOVA at 15 trials/condition casewise deletion. Error bars represent 95% confidence intervals.

References

    1. Aarts E., Verhage M., Veenvliet J.V., Dolan C.V., van der Sluis S. A solution to dependency: Using multilevel analysis to accommodate nested data. Nat. Neurosci. 2014;17(4):491–496. doi: 10.1038/nn.3648. - DOI - PubMed
    1. MATLAB . The MathWorks Inc.; Natick, Massachusetts: 2019. MATLAB (Release 2019a, Version 9.6.0.1072779)
    1. actiCAP slim [Apparatus], 2020a. Gilching, Germany: Brain Products GmbH.
    1. ActiCap Snap [Apparatus], 2020b. Gilching, Germany: Brain Products GmbH.
    1. actiCHamp (64 channels) [Apparatus], 2020c. Gilching, Germany: Brain Products GmbH.

Publication types