. 2022 Apr 8;24(1):26.
doi: 10.1186/s13058-022-01520-4.

SETDB1 interactions with PELP1 contributes to breast cancer endocrine therapy resistance

Affiliations

SETDB1 interactions with PELP1 contributes to breast cancer endocrine therapy resistance

Zexuan Liu et al. Breast Cancer Res. .

Abstract

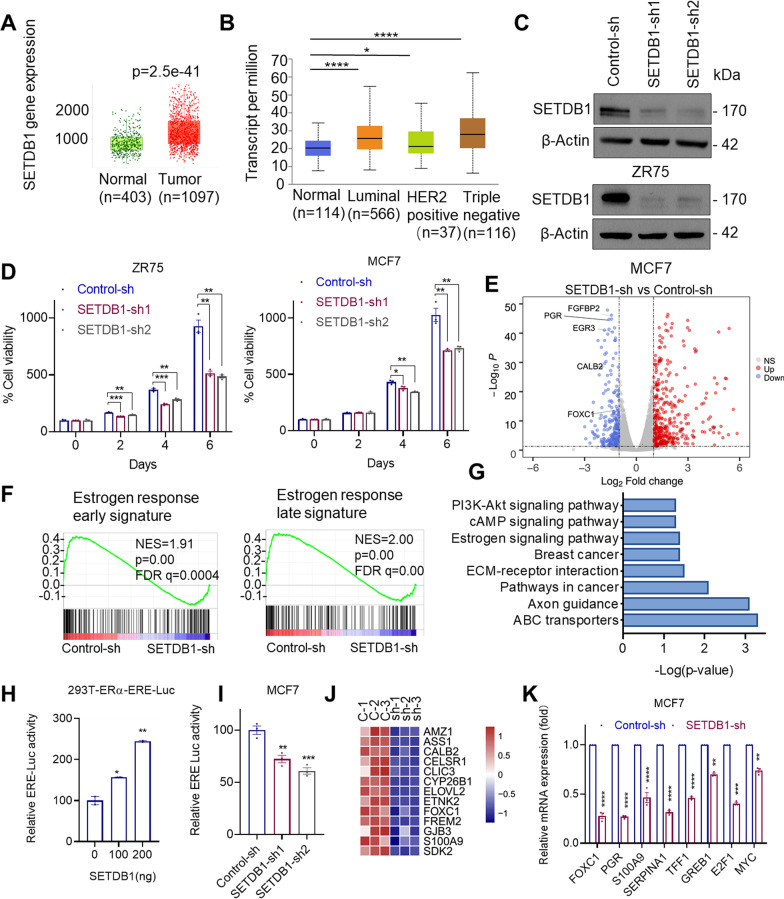
Background: Methyltransferase SETDB1 is highly expressed in breast cancer (BC), however, the mechanisms by which SETDB1 promotes BC progression to endocrine therapy resistance remains elusive. In this study, we examined the mechanisms by which SETDB1 contribute to BC endocrine therapy resistance.

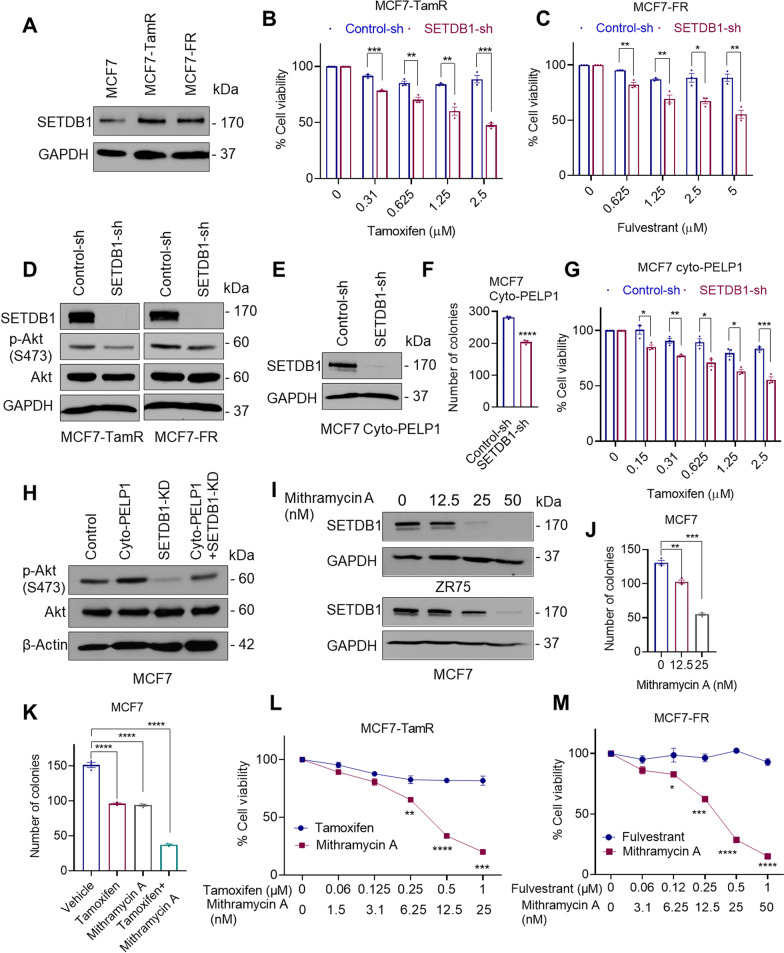
Methods: We utilized therapy sensitive (MCF7 and ZR75), therapy resistant (MCF7-TamR, MCF7-FR, MCF7-PELP1cyto, MCF7-SETDB1) estrogen receptor alpha positive (ER+)BC models and conducted in vitro cell viability, colony formation, 3-dimensional cell growth assays to investigate the role of SETDB1 in endocrine resistance. RNA-seq of parental and SETDB1 knock down ER+ BC cells was used to identify unique pathways. SETDB1 interaction with PELP1 was identified by yeast-two hybrid screen and confirmed by immunoprecipitation and GST-pull down assays. Mechanistic studies were conducted using Western blotting, reporter gene assays, RT-qPCR, and in vitro methylation assays. Xenograft assays were used to establish the role of PELP1 in SETDB1 mediated BC progression.

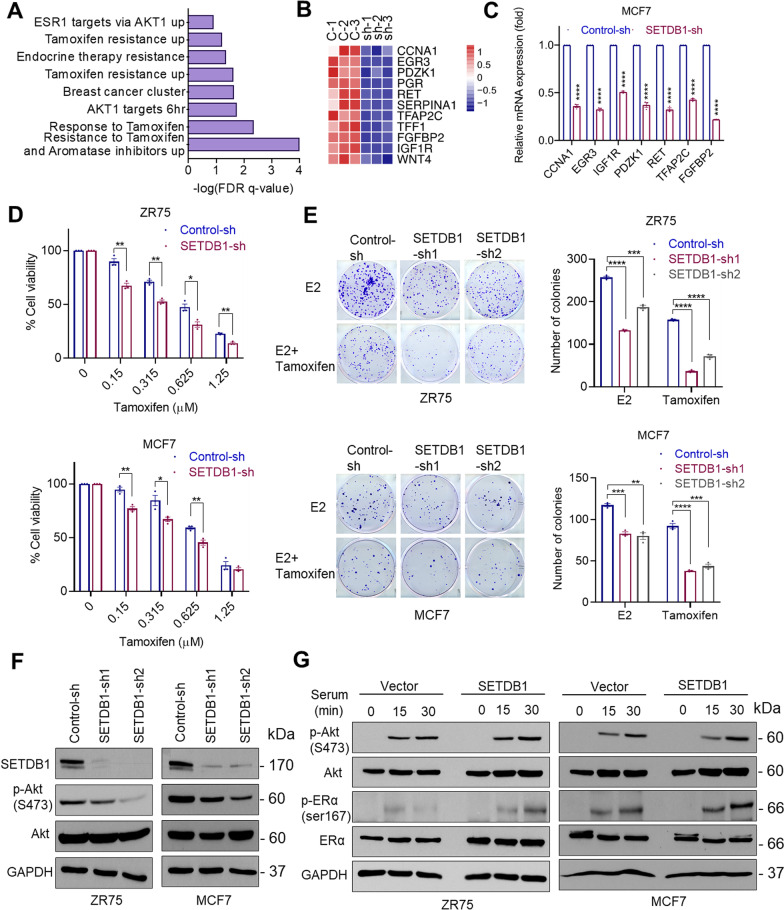
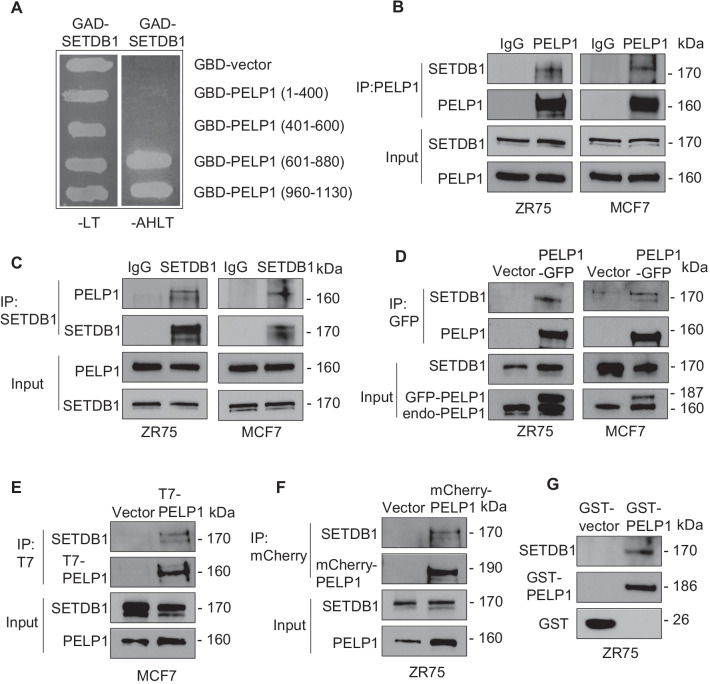
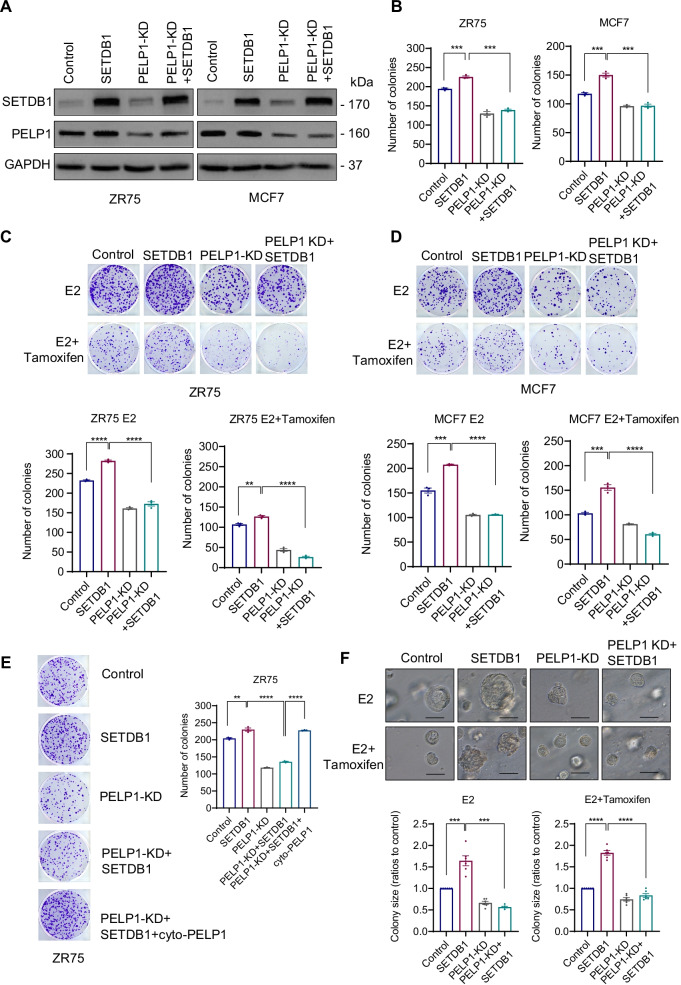
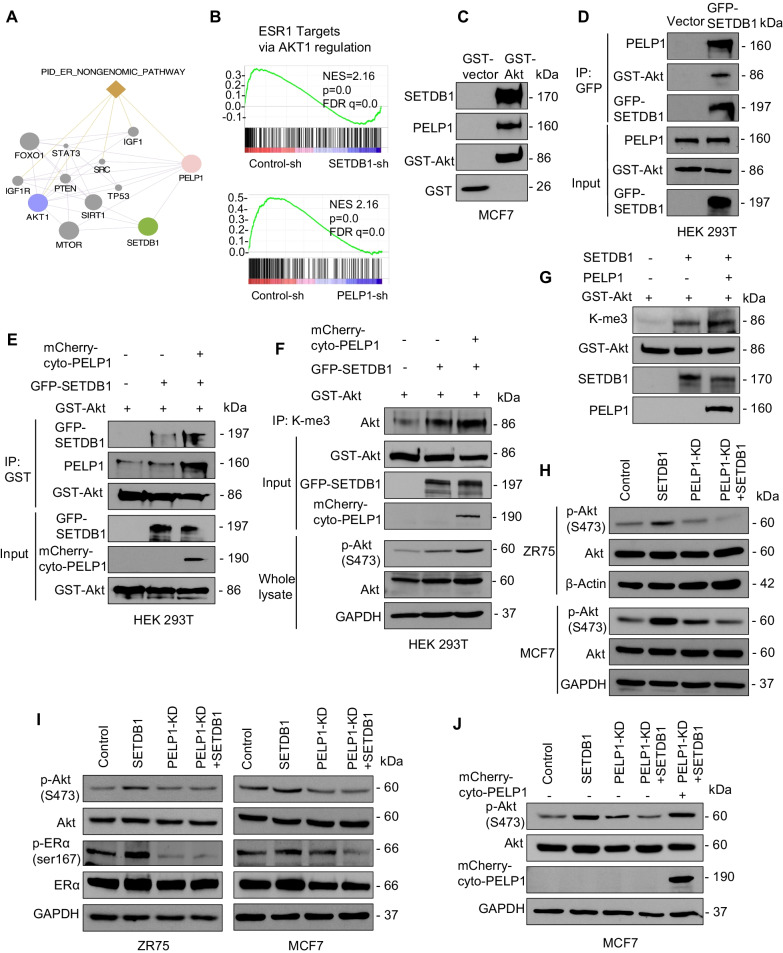
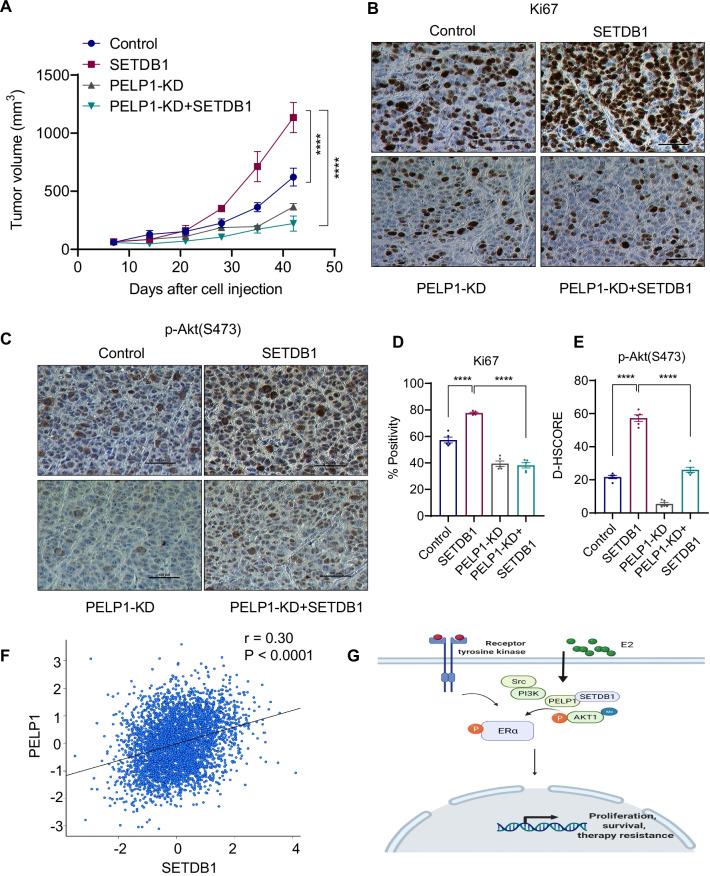
Results: RNA-seq analyses showed that SETDB1 regulates expression of a subset of estrogen receptor (ER) and Akt target genes that contribute to endocrine therapy resistance. Importantly, using yeast-two hybrid screen, we identified ER coregulator PELP1 as a novel interacting protein of SETDB1. Biochemical analyses confirmed SETDB1 and PELP1 interactions in multiple BC cells. Mechanistic studies confirmed that PELP1 is necessary for SETDB1 mediated Akt methylation and phosphorylation. Further, SETDB1 overexpression promotes tamoxifen resistance in BC cells, and PELP1 knockdown abolished these effects. Using xenograft model, we provided genetic evidence that PELP1 is essential for SETDB1 mediated BC progression in vivo. Analyses of TCGA datasets revealed SETDB1 expression is positively correlated with PELP1 expression in ER+ BC patients.

Conclusions: This study suggests that the PELP1/SETDB1 axis play an important role in aberrant Akt activation and serves as a novel target for treating endocrine therapy resistance in breast cancer.

Keywords: Akt; Breast cancer; PELP1; SETDB1; Therapy resistance.


Conflict of interest statement

The authors declare that they have no competing financial interests.

Figures

Fig. 1
Fig. 1
SETDB1 regulates ER driven transcription. A, B Expression level of SETDB1 between normal and BC tumor (A), and BC subtypes (B) were examined using online platforms TNM plot (A) and UALCAN portal (B). C Validation of SETDB1-KD by Western blotting using two independent shRNAs targeting SETDB1 in ZR75 and MCF7 cells. D Effect of SETDB1 KD on the cell viability of ER+ BC cells cultured in E2 (10−8 M) was measured by MTT assay. E MCF7 control-sh and SETDB1-sh cells were stimulated with E2 (10−8 M) for 8 h and then subjected to RNA-seq. Volcano plot of differentially expressed genes from RNA-seq data of MCF7 control-sh and SETDB1-sh cells. The x axis shows the log2 fold change and the y-axis shows the − log10 (p.value). The red dots represent significantly upregulated genes whereas the blue dots represent significantly downregulated genes upon SETDB1-KD. F GSEA enrichment plots of estrogen response signaling genes altered with SETDB1-KD. NES, normalized enrichment score. p values and FDR q.values were calculated using the GSEA package. G Representative KEGG pathways enriched (p.value < 0.05) in genes down-regulated upon SETDB1-KD. H 293 T-ERα-ERE-Luc cells were co-transfected with SETDB1 expressing vector or control vector along with pRL vector. After 48 h cells were stimulated with E2 for 24 h and luciferase activity was determined using Renilla dual luciferase assay system. I MCF7 cells that stably express SETDB1-shRNA were transduced with ERE-Luc, stimulated with E2 for 24 h and the reporter activity was determined. J Heat map depicting the expression levels of ER target genes from RNA-seq. K Selective ER target genes were validated by RT-qPCR in MCF7 control-sh and SETDB1-sh cells. Data was represented as mean ± SEM. *p < 0.05; **p < 0.01; ***p < 0.001; ****p < 0.0001
Fig. 2
Fig. 2
SETDB1 modulates tamoxifen response via Akt activation. A Gene set enrichment analysis of Akt signaling and tamoxifen resistance gene signatures upon SETDB1 KD were analyzed using RNA-seq data. B, C Effect of SETDB1 KD on selective tamoxifen resistance genes shown by heatmap (B) were validated using RT-qPCR analysis (C). D Effect of tamoxifen on the cell viability of control-sh and SETDB1-sh ZR75 and MCF7 cells was determined using the MTT assay. E Effect of tamoxifen on colony formation of control-sh and SETDB1-sh cells. Model cells were cultured in 5% DCC medium for 48 h, then treated with E2 (10−8 M) or Tamoxifen (2.5 μM). Shown are the results from one representative experiment of three replicates. F ZR75 and MCF7 cells stably expressing control-sh or SETDB1-sh were serum starved for 24 h and stimulated with 10% serum for 15 min. Effect of SETDB1-KD on Akt phosphorylation was analyzed by Western blotting. G ZR75 and MCF7 cells stably expressing control vector or SETDB1 vector were serum starved for 24 h and stimulated with 10% serum for 0, 15, and 30 min. Effect of SETDB1 overexpression on Akt downstream signaling was determined by Western blotting. Data was represented as mean ± SEM. *p < 0.05; **p < 0.01; ***p < 0.001; ****p < 0.0001
Fig. 3
Fig. 3
SETDB1 knockdown sensitizes therapy resistant cells to endocrine treatment. A SETDB1 expression in MCF7 and tamoxifen-resistant (TamR) or fulvestrant -resistant (FR) cells were examined by Western blotting. B, C Effect of tamoxifen or fulvestrant on the cell viability of MCF7-TamR (B) or MCF7-FR (C) that stably express control-sh and SETDB1-sh was determined using MTT assays. D SETDB1 expression was knocked down in MCF7-TamR and MCF7-FR cells and the status of Akt activation was measured using Western blotting. Cells were serum-starved for 24 h and stimulated with 10% serum for 15 min before being harvested and subjected to western blotting. E Confirmation of SETDB1-KD in MCF7-PELP1cyto cells. F Effect of SETDB1-KD on the colony formation of MCF7-PELP1cyto cells. G Effect of tamoxifen on the viability of PELP1cyto control-sh or SETDB1-sh cells was determined using MTT assays. H MCF7-PELP1cyto cells with/without SETDB1 KD were serum-starved for 24 h, stimulated with serum and total lysates were analyzed for Akt activation using Western blotting. I Cells were treated with indicated dose of Mithramycin A for 3 days, and the status of SETDB1 was determined using Western blotting. J, K Effect of Mithramycin A alone (J) or in combination with tamoxifen (K) on the cell survival was measured using colony formation assays. L, M Effect of Mithramycin A on the cell viability of MCF7-TamR (L) and MCF7-FR (M) cells was determined using MTT assays. Data was represented as mean ± SEM. *p < 0.05; **p < 0.01; ***p < 0.001; ****p < 0.0001
Fig. 4
Fig. 4
PELP1 is a novel interacting protein of SETDB1. A Mapping of PELP1-SETDB1 interaction region using yeast two hybrid assay. GBD fusions of PELP1 fragments were used to determine the PELP1 binding region in SETDB1. Positive interactors were selected on agar plates lacking either leucine and tryptophan (-LT) or adenine, histidine, leucine, and tryptophan (-AHLT). B, C Total lysates from ZR75 and MCF7 cells cultured in 10% serum were subjected to immunoprecipitation using PELP1 (B) or SETDB1 (C) antibody. IgG antibody was used as a negative control. SETDB1 and PELP1 interaction was confirmed by Western blotting. D ZR75 and MCF7 cells cultured in 10% serum were transfected with vector or GFP-tagged PELP1. The interaction of GFP-tagged PELP1 with SETDB1 was analyzed by immunoprecipitation using GFP-TRAP beads. E, F Total cell lysates from MCF7 cells transfected with T7-PELP1cyto or ZR75 cells transfected with mCherry-PELP1cyto were cultured in 5% DCC medium for 48 h, stimulated with E2 for 15 min, and then subjected to immunoprecipitation using epitope tag antibodies. Interaction between cytoplasmic PELP1 and SETDB1 was analyzed by Western blotting. G Total lysates from ZR75 cells cultured in 10% serum were subjected to GST pull-down assays using the purified GST vector or GST-PELP1 full length proteins. SETDB1 and PELP1 binding was analyzed by Western blotting
Fig. 5
Fig. 5
PELP1 knockdown reduces SETDB1 mediated clonogenic potential and therapy resistance. A Validation of ZR75 and MCF7 model cells expressing SETDB1 with/without PELP1-KD by Western blotting. B Characterization of the effect of PELP1-KD in cells expressing SETDB1 was analyzed by colony formation assays in 10% serum conditions. Quantitation of colonies is presented. C, D ZR75 and MCF7 model cells stably expressing with indicated constructs were cultured in E2 deprived 5% DCC medium, treated with E2 (10–8 M) or E2 with tamoxifen (2.5 μM) for 5 days and then cells were cultured with regular growth medium for 7 subsequent days. The image and number of colonies for each group was presented. E ZR75 model cells stably expressing SETDB1, PELP1 shRNA or PELP1cyto were cultured in 10% serum. The ability of PELP1cyto to rescue resistance phenotype was analyzed by colony formation assay. F MCF7 cells expressing SETDB1 or PELP1 shRNA were grown in 3D culture condition for 14 days in the presence of E2 (10–8 M) with or without tamoxifen (10 μM). Representative pictures were presented. Colony sizes were measured with ImageJ software and analyzed using relative ratio to control cells. Scale bar represents 100 μm, n = 6. Data was represented as mean ± SEM. **p < 0.01; ***p < 0.001; ****p < 0.0001
Fig. 6
Fig. 6
PELP1 interactions play an essential role in SETDB1 mediated Akt methylation. A Interactome network of PELP1, SETDB1, AKT1, and related genes based on GeneMANIA database. Each node represents genes and edges represent possible interactions. B GSEA plots of ESR1 targets via AKT1 regulation signature in RNA-seq data of ER+ BC with PELP1 or SETDB1- KD. C Total lysates from MCF7 cells grown in 10% serum were subjected to GST pull-down assays using GST-vector or GST-Akt purified from HEK293T cells and its ability to form trimeric complex with SETDB1, PELP1 was analyzed by Western blotting. D HEK293T cells are transfected with vector or SETDB1-GFP. Cells were serum-starved and stimulated with serum for 15 min and total lysates were subjected to immunoprecipitation and formation of trimeric complex was analyzed by Western blotting. E HEK293T cells transfected with indicated constructs were serum-starved and stimulated with serum for 15 min before being subjected to IP analysis.Western blotting was used to confirm trimeric complex. F Total lysates from HEK293T cells transfected with indicated constructs was subjected to immunoprecipitation using tri-methylation K-me3 antibody. Cells were serum-starved for 24 h and stimulated with 10% serum for 15 min before being subjected to IP analysis. The level of methylated Akt in immunoprecipitate and Akt phosphorylation in total cell lysate was verified by Western blotting. G In vitro methylation assay was performed using GST-Akt protein derived from HEK293T cells as substrate and recombinant SETDB1 protein as the source of methyltransferase. Effect of purified full-length PELP1 derived from baculovirus on SETDB1 mediated Akt methylation was determined. HJ MCF7 and ZR75 cells stably transfected with indicated constructs were serum starved for 24 h or E2 deprived for 48 h, and then stimulated with E2 (10–8 M, H) or 10% serum (I, J) for 15 min. Effect of PELP1 on SETDB1 induced Akt and ER phosphorylation was measured using Western blotting
Fig. 7
Fig. 7
PELP1 is needed for SETDB1 mediated BC progression. A MCF7-Control, MCF7-SETDB1, MCF7-PELP1-KD, MCF7-PELP1-KD + SETDB1 cells were implanted into SCID mice (n = 5) and tumor growth was measured at indicated time points. B–E Tumor sections were immunostained for status of Ki-67 (B) and p-Akt(S473) (C) expression and quantitation (D, E). Representative IHC images of Ki67 and p-Akt(S473) are shown. F Pearson’s pairwise correlation between SETDB1 and PELP1 in ER+ BC patients was plotted with bc-GenExMiner using a TCGA dataset. G Schematic model depicting PELP1-SETDB1 axis in mediating AKT signaling in ER+ BC. Data was represented as mean ± SEM. ****p < 0.0001

Similar articles

Cited by

References

    1. Turner NC, Neven P, Loibl S, Andre F. Advances in the treatment of advanced oestrogen-receptor-positive breast cancer. Lancet (London, England) 2017;389(10087):2403–2414. - PubMed
    1. Musgrove EA, Sutherland RL. Biological determinants of endocrine resistance in breast cancer. Nat Rev Cancer. 2009;9(9):631–643. - PubMed
    1. Viedma-Rodriguez R, Baiza-Gutman L, Salamanca-Gomez F, Diaz-Zaragoza M, Martinez-Hernandez G, Ruiz Esparza-Garrido R, Velazquez-Flores MA, Arenas-Aranda D. Mechanisms associated with resistance to tamoxifen in estrogen receptor-positive breast cancer (review) Oncol Rep. 2014;32(1):3–15. - PubMed
    1. Osborne CK, Schiff R. Mechanisms of endocrine resistance in breast cancer. Annu Rev Med. 2011;62:233–247. - PMC - PubMed
    1. Luqmani YA, Alam-Eldin N. Overcoming resistance to endocrine therapy in breast cancer: new approaches to a nagging problem. Med Princ Pract. 2016;25(Suppl 2):28–40. - PMC - PubMed

Publication types

MeSH terms