. 2022 Apr 26;9(2):ENEURO.0418-21.2022.
doi: 10.1523/ENEURO.0418-21.2022. Print 2022 Mar-Apr.

Drosophila Tet Is Required for Maintaining Glial Homeostasis in Developing and Adult Fly Brains

Affiliations

Drosophila Tet Is Required for Maintaining Glial Homeostasis in Developing and Adult Fly Brains

Felice Frey et al. eNeuro. .

Abstract

Ten-eleven translocation (TET) proteins are crucial epigenetic regulators highly conserved in multicellular organisms. TETs' enzymatic function in demethylating 5-methyl cytosine in DNA is required for proper development and TETs are frequently mutated in cancer. Recently, Drosophila melanogaster Tet (dTet) was shown to be highly expressed in developing fly brains and discovered to play an important role in brain and muscle development as well as fly behavior. Furthermore, dTet was shown to have different substrate specificity compared with mammals. However, the exact role dTet plays in glial cells and how ectopic TET expression in glial cells contributes to tumorigenesis and glioma is still not clear. Here, we report a novel role for dTet specifically in glial cell organization and number. We show that loss of dTet affects the organization of a specific glia population in the optic lobe, the "optic chiasm" glia. Additionally, we find irregularities in axon patterns in the ventral nerve cord (VNC) both, in the midline and longitudinal axons. These morphologic glia and axonal defects were accompanied by locomotor defects in developing larvae escalating to immobility in adult flies. Furthermore, glia homeostasis was disturbed in dTet-deficient brains manifesting in gain of glial cell numbers and increased proliferation. Finally, we establish a Drosophila model to understand the impact of human TET3 in glia and find that ectopic expression of hTET3 in dTet-expressing cells causes glia expansion in larval brains and affects sleep/rest behavior and the circadian clock in adult flies.

Keywords: 6mA DNA demethylation; Drosophila Ten-eleven translocation (Tet); Drosophila brain; brain tumor; human TET Drosophila model; optic chiasm glia.


Figures

Figure 1.
Figure 1.
dTet is required for Drosophila development and dTet-deficient flies have a severe locomotion phenotype. A, Schematic showing the cytogenetic location of Tet[MI03920] and Tet[MI04973]-G4 insertion, Tet[Df(3L)Excel6091] deficiency and Tet[null] deletion on Drosophila Chromosome 3 that were used to generate dTet-deficient flies. In order to generate dTet-deficient animals, Tet[MI03920] was either crossed to Tet[null] or to Tet[Df(3L)Excel6091]. In addition, Tet[null] was crossed to itself or to Tet[MI04973]. B, Kaplan–Meier survival curve of wild-type (n = 250), Tet[MI03920]/Tet[null] (n = 221), Tet[MI03920]/Tet[Df(3L)Excel6091] (n = 198), and Tet[null]/Tet[null] (n = 227) embryos is shown. Note that only 40–60% of dTet-deficient flies survived to the adult stage and those died within 2 d of eclosion. All Tet[null]/Tet[null] animals died as embryos or in early larval stages. C, Embryo survival assay of wild-type embryos (n = 218) compared with Tet[MI04973]-G4/TM3, Sb[1] Ser[1] heterozygous embryos (n = 159). The group of Tet[MI04973]-G4/TM3, Sb[1] Ser[1] heterozygous embryos showed an early lethality at the embryonic stage in >50% of observed animals. A chi-square test was used to determine the significance between the two groups (****p < 0.0001). D, Larval survival assay comparing Tet[MI04973]-G4/TM3, Sb[1] Ser[1] animals (n = 150) to Tet[MI04973]-G4/Tet[null] (n = 80) animals showed that only 50% of Tet[MI04973]-G4/Tet[null] animals eclose to adults, significantly less than in the control group. Statistical analysis was performed by a chi-square test (****p < 0.0001). E, Crawling assays with wandering third instar larvae on 0.4-cm grid paper showed that Tet[MI03920]/Tet[null] (n = 50) and Tet[MI03920]/Tet[Df(3L)Excel6091] animals (n = 50) have defective crawling activity. Statistical analysis was performed by ordinary one-way ANOVA and Sidak’s multiple comparison test (****p <0.0001). At adult stages, both mutants are incapable to fly or climb. F, Climbing assay displaying the average number of adults that were able to reach a 6-cm mark within 10 s (n = 60). Heterozygous Tet[MI04973]-G4/TM3, Sb[1] Ser[1] flies showed significantly reduced mobility compared with wild-type flies. Statistical analysis was performed by a chi-square test (*p = 0.0107). G, Dot blot assay was performed on 200 ng of indicated genomic DNA samples using an anti-6mA antibody (up). Methylene blue staining was performed as DNA input control (down). H, Quantification of 6mA levels in total genomic DNA (300 ng) using a commercial m6A ELISA kit. Statistical analysis was performed by ordinary one-way ANOVA and Bonferroni’s multiple comparison test. [**p <0.01 (n = 3); ns, p >0.05 (n = 2)]. Genomic DNA samples are as follows: control E: 6- to 8-h-old wild-type embryos; control B: brains from wild-type third instar wandering larvae; Tet[MI03920]/Tet[null] B: brains from Tet[MI03920]/Tet[null] third instar wandering larvae and Tet[MI03920]/Tet[Df(3L)Excel6091] B: brains from Tet[MI03920]/Tet[Df(3L)Excel6091] third instar wandering larvae. See also Extended Data Figure 1-1.
Figure 2.
Figure 2.
dTet is expressed in most neurons and in specific glia populations in the optic lobe of larval and adult brains. Genomic location of Gal4 cassette insertion site of Tet[MI05009]-G4 and Tet[MI04973]-G4 (A). Immunofluorescence co-staining of whole-mount Tet[MI05009]-G4> UAS-nuclear GFP/UAS-mCD8GFP or Tet[MI04973]-G4.UAS-nuclear GFP larval (L3) or 1-d-old adult (A) brains with five different markers including (B) anti-ELAV (neuronal cell marker), (C) anti-Repo (glial cell marker), (D) anti-slit (expressed in ventral midline, mushroom body, and others) and anti-wrapper (midline glia marker) as well as (E) anti-Fas2 antibody marking the mushroom body, longitudinal fascicles of the VNC and a subset of neurons. White arrowheads mark cells expressing both, dTet and the designated brain marker. See also Extended Data Figure 2-1. VNC: ventral nerve cord, CB: central brain, OL: optic lobe.
Figure 3.
Figure 3.
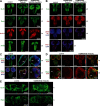
dTet-deficient larvae display distinct brain phenotypes. Whole-mount control (wild-type w1118), Tet[MI03920]/Tet[null] and Tet[MI03920]/Tet[Df(3L)Excel6091] third instar larval brains were dissected fixed and stained with (A) anti-ELAV (neuronal cell marker), anti-Repo (glial cell marker), anti-Robo1 (neuropile marker) and anti-NC82 (synaptic/active neuropile marker), (B) two neural progenitor markers, anti-Prospero (controls neuronal identity in a subset of neuroblast progeny and initiates the development of GMCs) and anti-Ase (marks embryonic/larval neuroblasts) as well as anti-phospho-Ser10 histone H3 (pS10-H3, mitotic marker) and anti-cleaved Death caspase-1 (Dcp-1, apoptosis marker). C, Whole-mount control (wild-type w1118) brains were dissected fixed and stained with ELAV and 6mA (epigenetic DNA mark, possible dTet substrate) or Repo and 6mA to determine a rough 6mA profile for larval brains. D, Whole-mount control and Tet[MI03920]/Tet[null] third instar larval brains were dissected fixed and stained with anti-Repo and 6mA. In Tet[MI03920]/Tet[null] brains glial cells of the IOC display slightly increased 6mA signal (open arrowheads versus white arrowheads). Contrary, several glia in the periphery show comparable 6mA signal in control and Tet[MI03920]/Tet[null] brains (open arrowhead). E, Whole-mount control and Tet[MI03920]/Tet[null] adult brains were dissected fixed and stained with anti-ELAV or anti-Repo. In Repo staining, arrowheads mark the giant glia of the IOC. In dTet-deficient brains this glia population appeared scattered (open arrowhead) and not arranged in a row in the middle of the optic lobe as observed for control brains (white arrowhead). Note that maximum z-projections are displayed for all markers.
Figure 4.
Figure 4.
dTet-deficient larvae display clear defects in midline glia organization and axon guidance. Whole-mount control (wild-type w1118), Tet[MI03920]/Tet[null] and Tet[MI03920]/Tet[Df(3L)Excel6091] larval brains were dissected fixed and stained with (A) anti-wrapper (midline glial cell marker). Higher magnification images (63× objective) of midline glia marked with wrapper showed that the organization of midline glia is disrupted in Tet[MI03920]/Tet[null] and Tet[MI03920]/Tet[Df(3L)Excel6091] larval brains (open arrowheads) compared with control brains (white arrowheads). For quantification of observed midline glia defects wrapper stains were scored blindly according to the indicated scoring system, where n corresponds to number of brains scored per group with control (n = 12), Tet[MI03920]/Tet[null] (n = 12) and Tet[MI03920]/Tet[Df(3L)Excel6091] (n = 8). B, Anti-slit (expressed in ventral midline and mushroom body among others). Higher magnification images (63× objective) of midline glia marked with slit showed that the organization of midline glia is disrupted in Tet[MI03920]/Tet[null] and Tet[MI03920]/Tet[Df(3L)Excel6091] larval brains (open arrowheads) compared with control brains (white arrowheads). For quantification of midline glia defects slit stains were scored blindly according to the indicated scoring system, where n corresponds to number of brains scored per group with control (n = 13), Tet[MI03920]/Tet[null] (n = 14) and Tet[MI03920]/Tet[Df(3L)Excel6091] (n = 9). C, Whole-mount control, Tet[MI03920]/Tet[null] and Tet[MI03920]/Tet[Df(3L)Excel6091] larval brains were dissected fixed and stained with anti-Fas3 (labeling one of the lateral axon tracts running lengthwise through the nerve cord and a band of axons that cross the midline in each segment). High-magnification images (63× objective) revealed that commissures crossing the midline appeared mostly discontinuous as if broken at the center (white stars) in the lower part of the VNC with some aberrant crossings in the upper part of the VNC (empty arrowhead). The graph below displays blinded scoring of disrupted horizontal commissure crossings according to the indicated scoring system, where n corresponds to number of brains scored per group with control (n = 13), Tet[MI03920]/Tet[null] (n = 14) and Tet[MI03920]/Tet[Df(3L)Excel6091] (n = 6). D, Whole-mount control and Tet[MI03920]/Tet[null] larval brains were dissected fixed and co-stained with anti-Fas2 antibody marking a subset of VNC axons and HRP (staining all VNC axons). In high-magnification images (63× objective, lower panel), Fas2 longitudinal tracts are designated by letters relative to their position in the dorsoventral (D, dorsal; C, central) and mediolateral (M, medial; I, intermediate; L, lateral) position. Cells of the midline (ML) are clearly visible with DAPI stain. Fas2-positive axons that cross the midline (ML) in Tet[MI03920]/Tet[null] mutants are marked by white stars. E, One-day-old adult control and Tet[MI03920]/Tet[null] Drosophila brains were dissected, fixed, and visualized using anti-Fas2 antibody that stains mushroom body axons. As seen in the control the mushroom body cells extend several axons bundles (so-called lobes) including dorsally projecting α-lobes, medially-projecting β- and γ-lobes. The expression of Fas2 in γ-lobes is weaker than in α- and β-lobes. The centrally located ellipsoid body is also visualized by Fas2 staining. Importantly, β-lobes of control flies usually terminate before the brain midline. The mushroom body axons of Tet[MI03920]/Tet[null] brains displayed multiple phenotypes including varying amounts of β-lobe mis-projection (open arrowheads) across the midline that was rarely observed in control brains (lower panel, left side) as well as frequently missing (white asterisk) or misdirected (open arrowheads) α- and/or β-lobes (lower panel, right side). Quantification of mushroom body phenotypes was done according to the indicated scoring systems. Maximum intensity z-stack projections of representative examples of each scored category are displayed.
Figure 5.
Figure 5.
dTet-deficient mutants display a highly significant increase in glial cell numbers in the brain lobes, accompanied by an increase in proliferating and apoptotic cell numbers. Whole-mount control (wild-type w1118) or Tet[MI03920]/Tet[null] larval brains were dissected fixed and stained with (A) anti-Repo (glial cell marker), (B) anti-Repo and anti-phospho-Ser10 histone H3 (pS10-H3; mitotic marker), or (C) anti-Repo and anti-cleaved Death caspase-1 (Dcp-1; apoptosis marker). Whole-mount brains of 1-d-old control or Tet[MI03920]/Tet[null] adult flies were dissected fixed and stained with anti-Repo (D). Tet[MI03920]/Tet[null] adult brains exhibited scattered giant glial cells of the IOC (open arrowheads) as compared with linear alignment in control brains (white arrowheads). Displayed images are maximum intensity projections of 6 (1 μm) z-stacks taken with 40× oil objective. Cell counts were conducted using ImageJ plug-in ITCN. Each dot corresponds to the average amount of cells detected per animal in one brain lobe, where n indicates the number of animals analyzed. Statistical significance was analyzed by unpaired Student’s t test and graphs generated using GraphPad Prism version 5.01 (****p <0.0001; ns, not significant).
Figure 6.
Figure 6.
dTet-deficient mutants display a highly significant increase in glial cell numbers in the brain lobes that coincides with changes in hippo pathway activation. A, Simplified schematic of the hippo signaling pathway, an intracellular kinase cascade that negatively regulates the transcriptional co-activator yki (yorkie), which in turn activates transcription of a wide range of downstream targets including mer (merlin), ex (expanded), diap1 (death-associated inhibitor of apoptosis 1), cycE (cyclin E), and dally (division abnormally delayed). Activation of the hippo pathway results in the downregulation of cell proliferation and upregulation of apoptosis. B, Relative expression of selected hippo pathway members and several downstream targets listed in A. Note that Tet[MI03920]/Tet[null] brains showed a 0.25-fold reduced transcription of hippo pathway member hpo that coincided with 0.4-fold reduced yki transcription. Additionally, downstream targets dally (0.35-fold) and diap1 (0.69-fold) were both significantly reduced in Tet[MI03920]/Tet[null] brains. Hippo pathway members mer and ex that are acting upstream of hpo showed no significant change in expression in Tet[MI03920]/Tet[null] brains. C, UCSC genome browser image showing two gain-of-6mA regions in the CycE genomic region in dTet-deficient brains relative to controls. These regions correspond to active 6mA demethylation loci in wild-type brains (Yao et al., 2018). D, Whole-mount control (wild-type w1118) or Tet[MI03920]/Tet[null] larval brains were dissected fixed and stained with anti-CycE (Cyclin-E, control of cell cycle at G1/S transition) and anti-phospho-Ser10 histone H3 (pS10-H3). In control brains, cells in the lamina region do not show much CycE or pS10-H3 signal (white arrowheads), while the corresponding cells in Tet[MI03920]/Tet[null] brains show an increase in CycE and pS10-H3 signal (open arrowheads). Note that maximum z-projections are displayed for all markers. Statistical significance was analyzed by unpaired Student’s t test and graphs generated using GraphPad Prism version 5.01 (***p <0.001, **p <0.01, *p <0.05; ns, not significant).
Figure 7.
Figure 7.
Glia-specific knock-down of dTet has no significant effect on survival or locomotion, but knock-down of dTet in chiasm glia has a negative effect on survival. A, Knock-down of dTet in glial cells (Repo-Gal4) does not affect the survival from third instar larvae to adult stage (n = 80). B, Crawling assays with wandering third instar larvae on 0.4-cm grid paper showed that knock-down of dTet in glial cells has no major effect on third instar larval locomotion or number of body contractions (n = 50). C, Survival assay on third instar larvae yielded a moderate reduction in the number of eclosed adult flies, when dTet is specifically knocked down in the outer optic chiasm glial cells using driver R25A01-Gal4 [*p = 0.0209 (n = 80)]. D, Survival assay on Tet[MI04973]-G4> dTet RNAi larvae that either co-expressed human TET3 or not, showed that simultaneous expression of hTET3 cannot rescue dTet knock-down. Larvae expressing dTet RNAi and hTET3 showed a significantly reduced survival rate [**p = 0.0011 (n = 80)]. E, Crawling assay on Tet[MI04973]-G4> dTet RNAi larvae that either co-express human TET3 or not, showed no significant changes between both groups (n = 50). GFP-RNAi was used as a control. Statistical analysis on survival assays was performed by a chi-square. Statistical analysis on crawling assays was performed by unpaired Student’s t test. F, Whole-mount Tet[MI04973]-G4> dTet RNAi, Tet[MI04973]-G4> hTET3 and Tet[MI04973]-G4> dTet RNAi; hTET3 larval brains were dissected fixed and stained with anti-HA antibody to validate expression of human TET3 transgene containing N-terminal Flag and HA tag (see Fig. 8A).
Figure 8.
Figure 8.
Expression of human TET3 in dTet-expressing cells results in an increase in glial cells in larval brain lobes as well as a reduced life-span and a circadian phenotype in adult flies. A, Schematic representation of the human TET3 transgene with N-terminal Flag and HA tag used in the described experiments. Functional domains are indicated including a CXXC zinc finger, a Cys-rich domain and a double-stranded β helix (DSBH) domain containing iron (II) and 2-OG binding sites. B, The Gal4/UAS system was used for targeted expression of human TET3 (hTET3). The system is composed of two independent parent transgenic lines, the Tet[MI05009]-G4 driver line, in which the Gal4 gene is expressed in a dTet-specific pattern, and the hTET3 transgene containing line that contains the Gal4 DNA binding sequence UAS (upstream activating sequence) adjacent to the hTET3 gene. Mating of the described parental flies results in a F1 generation, where Gal4 is expressed in the transcriptional pattern of dTet and binds to the UAS to activate transcription of hTET3 in the same pattern. Here, the Gal4 driver was combined with a UAS-containing transgene to express nuclear GFP (nGFP) to visualize the cells/tissue that express hTET3 transgene. C, Light microscope images of control flies and Tet[MI05009]-G4> hTET3-expressing flies displaying incomplete fusion of the adult abdominal epidermis (open arrowhead, right panel) as well as protrusions of the most posterior abdominal segments including the male genitalia (open arrowhead, left panel). Approximately 50% of flies displayed either of the phenotypes or both as shown in the sex-specific quantification in the left graph. D, Whole-mount Tet[MI05009]-G4::UAS-nGFP> control or Tet[MI05009]-G4::UAS-nGFP> hTET3 larval brains were dissected fixed and double stained with anti-Repo and anti-pS10-H3. Displayed images are maximum z-projections of six (1 μm) z-stacks taken with 40× oil objective. Cell counts were conducted using ImageJ plug-in ITCN. Each dot corresponds to the average amount of cells detected per animal in one brain lobe, where n indicates the number of animals analyzed. Statistical significance was analyzed by unpaired Student’s t test and graphs generated using GraphPad Prism version 5.01 (**p <0.005, *p <0.05, ns, no statistical significance). E, Kaplan–Meier survival curve of male flies expressing either no transgene (driver control, n = 31) or hTET3 (n = 28) through Tet[MI05009]-G4. Statistical significance of difference between survival curves was determined using the Mantel–Haenszel test (p <0.005). F, Activity graphs illustrating daily locomotor activities of flies over several days. For each group, the locomotor activity levels of individual flies (n ≅ 30) were measured in 5-min bins and then averaged to obtain a representative activity profile. Since locomotion is age-dependent, we subdivided flies in two age groups: “young”: 1–12 d old and “old”: 13–20 d old. Drosophila melanogaster generally exhibits two activity bouts one centered around ZT0 (morning peak) and the second around ZT12 (evening peak). Black arrows indicate the anticipatory increase in locomotor activity that occurs before light transition states. G, Graph showing average locomotor activity over 12-h intervals. Note that hTET3-expressing flies are significantly less active at night. Statistical significance was analyzed by unpaired Student’s t test (***p <0.0005). H, Graph illustrating the wake activity in counts per min over 12-h intervals. Wake activity, is a measure of the activity rate when the flies are awake. Note that the wake activity is comparable between hTET3-expressing and control flies indicating that hTET3 flies are affected in sleep/rest behavior and not in locomotion. I, Graph showing the average of daily sleep minutes for all flies in one group for 12-h intervals (day: light on, night: light off) over 20 d. During day and night hTET3-expressing flies showed a significant increase in sleep time compared with control flies. Statistical significance was analyzed by unpaired Student’s t test (**p <0.005, ***p <0.0005). J, Graph indicating the mean rest bout length of each group in minutes for 12-h intervals. The mean rest bout length is a measure of how consolidated sleep is and was significantly higher for TET3-expressing flies during night time. Statistical significance was analyzed by unpaired Student’s t test (**p <0.005). K, Graph illustrating the percent of time that flies spend sleeping over several days. For each group, the percent of flies sleeping was measured in 5-min bins and then averaged to obtain a representative sleep profile. Since sleep is age-dependent, we subdivided flies in two age groups as described above. ZT0 indicates morning peak and ZT12 the evening peak. Black arrows indicate the anticipatory phase occurring before light transition states. L, Graph showing the average number of rest bouts for all flies in one group for 12-h intervals over 20 d. During night hTET3-expressing flies showed significantly less rest bouts compared with control flies. Statistical significance was analyzed by unpaired Student’s t test (***p <0.0005). ZT stands for Zeitgeber time. ZT0 indicates the beginning of the day (light phase) and ZT12 the beginning of the night (dark phase).
Figure 9.
Figure 9.
Expression of human TET3 in glial cells results in circadian phenotypes and decrease in mitotic cells. A, The Gal4/UAS system was used for targeted expression of human TET3. The system is composed of two independent parent transgenic lines, the Repo-Gal4 driver line, in which the Gal4 gene is expressed in a glia-specific pattern, and the hTET3 transgene containing line that contains the Gal4 DNA binding sequence UAS (upstream activating sequence) adjacent to the hTET3 gene. Mating of the described parental flies results in a F1 generation, where Gal4 is expressed in the transcriptional pattern of the glia marker Repo and binds to the UAS to activate transcription of hTET3 in the same pattern. Here, the Gal4 driver was combined with a UAS-containing transgene to express membrane-targeted GFP (mCD8-GFP) to visualize the cells/tissue that express hTET3 transgene. B, Whole-mount Repo-Gal4::UAS-mCD8GFP> control or Repo-Gal4::UAS-mCD8-GFP> hTET3 larval brains were dissected fixed and double stained with anti-Repo and anti-pS10-H3. Displayed images are maximum z-projections of six (1 μm) z-stacks taken with 40× oil objective. Cell counts were conducted using ImageJ plug-in ITCN. Each dot corresponds to the average amount of cells detected per animal in one brain lobe, where n indicates the number of animals analyzed. Statistical significance was analyzed by unpaired Student’s t test and graphs were generated using GraphPad Prism version 5.01 (*p <0.05; ns, p >0.05). C, Kaplan–Meier survival curve of male flies expressing either no transgene (driver control, n = 31) or hTET3 (n = 30) through Repo-Gal4. Statistical significance of difference between survival curves was determined using the Mantel–Haenszel test (p <0.005). D, Activity graphs illustrating daily locomotor activities of flies over several days. For each group, the locomotor activity levels of individual flies (n ≅ 30) were measured in 5-min bins and then averaged to obtain a representative activity profile for two age groups as described above. Drosophila melanogaster generally exhibits two activity bouts one centered around ZT0 (morning peak) and the second around ZT12 (evening peak). Black arrows indicate the anticipatory increase in locomotor activity that occurs before light transition states. E, Graph showing average locomotor activity over 12-h intervals. Note that hTET3-expressing flies are significantly less active at night. Statistical significance was analyzed by unpaired Student’s t test (***p <0.0005). F, Graph illustrating the wake activity counts per minute over 12-h intervals. G, Graph showing the average of daily sleep minutes for all flies in one group for 12-h intervals (day: light on, night: light off) over 20 d. During day and night hTET3-expressing flies showed a significant increase in sleep time compared with control flies. Statistical significance was analyzed by unpaired Student’s t test (**p <0.005, ***p <0.0005). H, Graph indicating the mean rest bout length of each group in minutes for 12-h intervals. The mean rest bout length is a measure of how consolidated sleep is and was significantly higher for TET3-expressing flies during night time. Statistical significance was analyzed by unpaired Student’s t test (**p <0.005). I, Graph illustrating the percent of time that flies spend sleeping over several days. For each group, the percent of flies sleeping was measured in 5-min bins and then averaged to obtain a representative sleep profile. ZT0 indicates morning peak and ZT12 the evening peak. Black arrows indicate the anticipatory phase occurring before light transition states. J, Graph showing the average number of rest bouts for all flies in one group for 12-h intervals over 20 d. Note that the number of rest bouts are comparable between hTET3-expressing and control flies. ZT stands for Zeitgeber time. ZT0 indicates the beginning of the day (light phase) and ZT12 the beginning of the night (dark phase).

References

    1. Al-Mahdawi S, Virmouni SA, Pook MA (2014) The emerging role of 5-hydroxymethylcytosine in neurodegenerative diseases. Front Neurosci 8:397. 10.3389/fnins.2014.00397 - DOI - PMC - PubMed
    1. Antunes C, Sousa N, Pinto L, Marques CJ (2019) TET enzymes in neurophysiology and brain function. Neurosci Biobehav Rev 102:337–344. 10.1016/j.neubiorev.2019.05.006 - DOI - PubMed
    1. Battye R, Stevens A, Jacobs JR (1999) Axon repulsion from the midline of the Drosophila CNS requires slit function. Development 126:2475–2481. - PubMed
    1. Bian EB, Zong G, Xie YS, Meng XM, Huang C, Li J, Zhao B (2014) TET family proteins: new players in gliomas. J Neurooncol 116:429–435. 10.1007/s11060-013-1328-7 - DOI - PubMed
    1. Bischof J, Maeda RK, Hediger M, Karch F, Basler K (2007) An optimized transgenesis system for Drosophila using germ-line-specific phiC31 integrases. Proc Natl Acad Sci U S A 104:3312–3317. 10.1073/pnas.0611511104 - DOI - PMC - PubMed

Publication types

Substances