. 2022 May;32(5):930-944.
doi: 10.1101/gr.275870.121. Epub 2022 Apr 8.

Chromatin interaction-aware gene regulatory modeling with graph attention networks

Affiliations

Chromatin interaction-aware gene regulatory modeling with graph attention networks

Alireza Karbalayghareh et al. Genome Res. 2022 May.

Abstract

Linking distal enhancers to genes and modeling their impact on target gene expression are longstanding unresolved problems in regulatory genomics and critical for interpreting noncoding genetic variation. Here, we present a new deep learning approach called GraphReg that exploits 3D interactions from chromosome conformation capture assays to predict gene expression from 1D epigenomic data or genomic DNA sequence. By using graph attention networks to exploit the connectivity of distal elements up to 2 Mb away in the genome, GraphReg more faithfully models gene regulation and more accurately predicts gene expression levels than the state-of-the-art deep learning methods for this task. Feature attribution used with GraphReg accurately identifies functional enhancers of genes, as validated by CRISPRi-FlowFISH and TAP-seq assays, outperforming both convolutional neural networks (CNNs) and the recently proposed activity-by-contact model. Sequence-based GraphReg also accurately predicts direct transcription factor (TF) targets as validated by CRISPRi TF knockout experiments via in silico ablation of TF binding motifs. GraphReg therefore represents an important advance in modeling the regulatory impact of epigenomic and sequence elements.


Figures

Figure 1.
Figure 1.
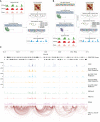
A schematic overview of GraphReg models. (A) The Epi-GraphReg model uses 1D epigenomic data, such as H3K4me3 and H3K27ac ChIP-seq and DNase-seq (or ATAC-seq) to learn local features of genomic bins via convolutional neural networks, and then propagates these features over adjacency graphs extracted from Hi-C/HiChIP contact matrices using graph attention networks to predict gene expression (CAGE-seq) across genomic bins. (B) The Seq-GraphReg model uses DNA sequence as input and, after some convolutional and dilated convolutional layers, predicts epigenomic data. This helps to learn useful latent representations of genomic DNA sequences that are then passed to the graph attention networks to be integrated over the adjacency graphs derived from Hi-C/HiChIP contact matrices and to predict gene expression values (CAGE-seq). (C) A 6-Mb genomic region (11 Mb–17 Mb) of Chr 19 showing input and output signals and predictions in K562 cells, including epigenomic data (H3K4me3, H3K27ac, DNase), CAGE, HiChIP interaction graph, and predicted CAGE values for GraphReg and CNN models. Training and evaluations of the models are performed in the dashed middle 2 Mb (here 13 Mb–15 Mb) region so that all genes can see the effects of their distal enhancers up to 2 Mb.
Figure 2.
Figure 2.
GraphReg models outperform their CNN counterparts for gene expression prediction. (A,B) Negative log-likelihood (NLL, lower is better) between true and predicted CAGE signals of epigenome-based (A) and sequence-based (B) GraphReg and CNN models over 50 random selections of 2000 predicted genes from test chromosomes concatenated from 10 cross-validation experiments with different training, test, and validation chromosomes. Box plots show the distributions of NLL in GM12878, K562, hESC, and mESC for three gene sets: all genes, expressed genes (CAGE signal ≥ 5), and expressed genes with at least one 3D interaction (interacting). The 3D data used in Epi-GraphReg (A) for each cell type is as follows: Hi-C (FDR = 0.001) for GM12878, H3K27ac HiChIP (FDR = 0.01) for K562, Micro-C (FDR = 0.1) for hESC, and H3K27ac HiChIP (FDR = 0.1) for mESC. The 3D data used for Seq-GraphReg (B) is H3K27ac HiChIP (FDR = 0.1) for GM12878, K562, and mESC, and Micro-C (FDR = 0.1) for hESC. Example scatterplots of all predicted test genes that are expressed (CAGE ≥ 5) are plotted for GM12878 in epigenome-based models (A) and K562 in sequence-based models (B), where the genes are color-coded by the number of 3D interactions n. The sequenced-based models have been trained separately (and not using dilated CNN) for K562 and end-to-end for GM12878, hESC, and mESC. (C) Box plots show mean squared error (MSE) of the true and predicted log-fold gene expression changes between GM12878 and K562 in 50 random selections of 2000 predicted genes from test chromosomes concatenated from 10 cross-validation experiments with different training, test, and validation chromosomes. The sets All, Expressed, and Interacting denote the intersections of such sets in GM12878 and K562. Both Epi- and Seq-GraphReg models have better prediction accuracy than their CNN counterparts. The scatterplots of the true log-fold gene expression changes and the log-fold changes derived from the predicted CAGE values by Seq-GraphReg and Seq-CNN, between GM12878 and K562, are shown for expressed genes (CAGE ≥ 5 in both K562 and GM12878). TSS bins are color-coded by the minimum number of 3D interactions in GM12878 and K562 (m). Seq-GraphReg has higher R and lower MSE than Seq-CNN. (D) Epi-GraphReg models show higher cell-to-cell generalization capability than Epi-CNN models. Box plots show the distributions of NLL on the test cell type (K562 or GM12878) when trained on the other cell type over 50 random selections of 2000 predicted genes from test chromosomes of the test cell concatenated from 10 cross-validation experiments with different training, test, and validation chromosomes in the training cell. The models are evaluated on the same test chromosomes in the unseen test cell. HiChIP (FDR = 0.1) is used for both cells. The generalization of Epi-GraphReg from K562 to GM12878 is significantly better (P < 10−4, Wilcoxon signed-rank test) than Epi-CNN in all gene sets. The generalization of Epi-GraphReg from GM12878 to K562 is significantly better (P < 10−4, Wilcoxon signed-rank test) than Epi-CNN in expressed and interacting genes. The scatterplots of all predicted test genes that are expressed (CAGE ≥ 5) are plotted when trained on K562 and tested on GM12878.
Figure 3.
Figure 3.
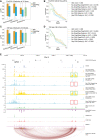
GraphReg models more accurately identify functional enhancers of genes. (A) Distribution of the area under the precision-recall curve (auPR) for 19 genes in K562 cells based on CRISPRi-FlowFISH data. GraphReg models have higher median of auPR than both CNN and activity-by-contact (ABC) models. (B) Precision-recall curves of the GraphReg, CNN, and ABC models for identifying enhancers of 19 genes screened by CRISPRi-FlowFISH. (C) Distribution of auPR for 35 genes in K562 cells based on TAP-seq data. GraphReg models have higher median of auPR than both CNN and ABC models. (D) Precision-recall curves for the GraphReg, CNN, and ABC models for identifying functional enhancers of 35 genes as determined by TAP-seq. (E) MYC locus (2.5 Mb) on Chr 8 with epigenomic data, true CAGE, predicted CAGE using GraphReg and CNN models, HiChIP interaction graph, and the saliency maps of the GraphReg and CNN models, all in K562 cells. Experimental CRISPRi-FlowFISH results and ABC values are also shown for MYC. Feature attribution shows that GraphReg models exploit HiChIP interaction graphs to find the distal enhancers, whereas CNN models find only promoter-proximal enhancers. Green and red boxes show true positives and false negatives, respectively. CNN models miss the distal enhancers and consequently lead to false negatives in very distal regions.
Figure 4.
Figure 4.
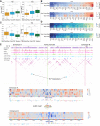
Seq-GraphReg accurately predicts the regulatory effects of transcription factor knockouts by in silico motif ablation. (A) Distributions of true mean logFC (over 100 predicted target genes) over all TFs for Seq-GraphReg, Seq-CNN, and baseline for n ≥ 0 and n ≥ 5, where n denotes the number of enhancer–promoter (E–P) interactions. The median of true mean logFCs for predicted genes by Seq-GraphReg is negative, and the distribution is significantly more down-regulated than that of Seq-CNN and baseline (Wilcoxon signed-rank test). (B) Heatmaps of the true mean logFC of the top 100 predicted genes by Seq-GraphReg and Seq-CNN for each TF, for n ≥ 0 and n ≥ 5. For the majority of TFs, the mean logFC of Seq-GraphReg's predicted targets is more negative than that of Seq-CNN's targets. (C) Distributions of precision values (fraction of true significantly down-regulated genes among 100 predicted genes) of all TFs for Seq-GraphReg, Seq-CNN, and baseline, for n ≥ 0 and n ≥ 5. The precision is always highest in Seq-GraphReg and significantly greater than for Seq-CNN and baseline (Wilcoxon signed-rank test). (D) Heatmaps of precision values (fraction of true significantly down-regulated genes among the top 100 predicted genes) for Seq-GraphReg and Seq-CNN for each TF and for n ≥ 0 and n ≥ 5. For the majority of TFs, the precision of Seq-GraphReg is higher than Seq-CNN. (E) A visual example of the effect of JUND KO on the gene TCF3. JUND motif hits around TCF3 are plotted in blue bars. The promoter of TCF3 is indicated by green lines, and two distal enhancers A (1.08 Mb downstream) and B (1.29 Mb upstream) of the gene TCF3 by red lines. The interactions of enhancers A and B with the promoter of TCF3 in HiChIP graph are marked by blue circles. In silico mutagenesis (ISM) is performed in 100-bp regions of enhancers A and B, each centered at a JUND motif, and the ISM heatmaps are shown. The heatmaps show the difference in predictions (mutated − reference) after applying a mutation at each nucleotide. The heatmaps around the JUND motif in both enhancers A and B are blueish, indicating the importance of JUND motif in these regions for TCF3 expression prediction. The base-level representations of ISM scores are the negative summation of all four scores (only three are non-zero) at each nucleotide.

References

    1. Agarwal V, Shendure J. 2020. Predicting mRNA abundance directly from genomic sequence using deep convolutional neural networks. Cell Rep 31: 107663. 10.1016/j.celrep.2020.107663 - DOI - PubMed
    1. Anders S, Huber W. 2010. Differential expression analysis for sequence count data. Genome Biol 11: R106. 10.1186/gb-2010-11-10-r106 - DOI - PMC - PubMed
    1. Avsec Ž, Agarwal V, Visentin D, Ledsam JR, Grabska-Barwinska A, Taylor KR, Assael Y, Jumper J, Kohli P, Kelley DR. 2021a. Effective gene expression prediction from sequence by integrating long-range interactions. Nat Methods 18: 1196–1203. 10.1038/s41592-021-01252-x - DOI - PMC - PubMed
    1. Avsec Ž, Weilert M, Shrikumar A, Krueger S, Alexandari A, Dalal K, Fropf R, McAnany C, Gagneur J, Kundaje A, et al. 2021b. Base-resolution models of transcription-factor binding reveal soft motif syntax. Nat Genet 53: 354–366. 10.1038/s41588-021-00782-6 - DOI - PMC - PubMed
    1. Bigness J, Loinaz X, Patel S, Larschan E, Singh R. 2022. Integrating long-range regulatory interactions to predict gene expression using graph convolutional networks. J Comput Biol 10.1089/cmb.2021.0316 - DOI - PMC - PubMed

Publication types

MeSH terms