. 2022 Apr 8;5(1):341.
doi: 10.1038/s42003-022-03300-4.

ROCK2-induced metabolic rewiring in diabetic podocytopathy

Affiliations

ROCK2-induced metabolic rewiring in diabetic podocytopathy

Keiichiro Matoba et al. Commun Biol. .

Abstract

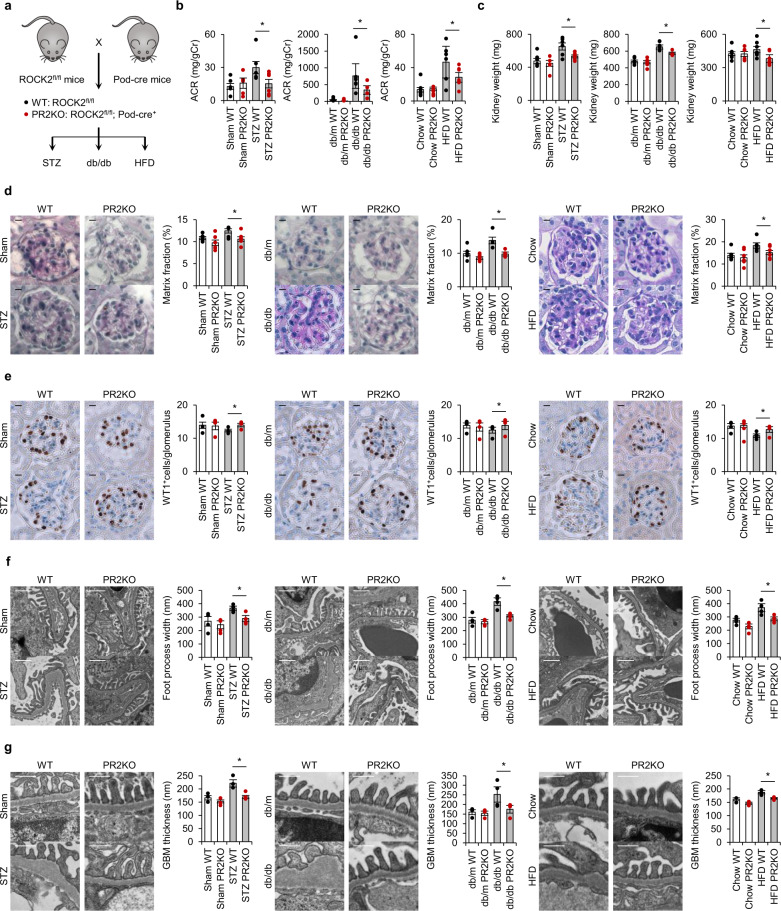
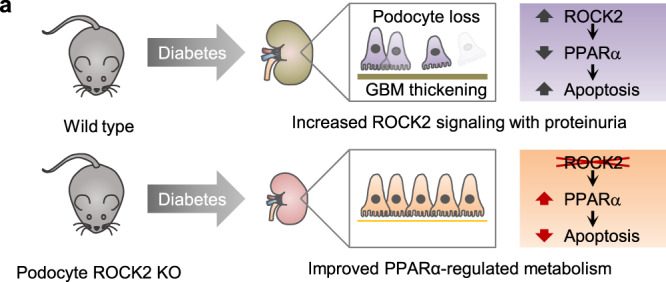
Loss of podocytes is a common feature of diabetic renal injury and a key contributor to the development of albuminuria. We found that podocyte Rho associated coiled-coil containing protein kinase 2 (ROCK2) is activated in rodent models and patients with diabetes. Mice that lacked ROCK2 only in podocytes (PR2KO) were resistant to albuminuria, glomerular fibrosis, and podocyte loss in multiple animal models of diabetes (i.e., streptozotocin injection, db/db, and high-fat diet feeding). RNA-sequencing of ROCK2-null podocytes provided initial evidence suggesting ROCK2 as a regulator of cellular metabolism. In particular, ROCK2 serves as a suppressor of peroxisome proliferator-activated receptors α (PPARα), which rewires cellular programs to negatively control the transcription of genes involved in fatty acid oxidation and consequently induce podocyte apoptosis. These data establish ROCK2 as a nodal regulator of podocyte energy homeostasis and suggest this signaling pathway as a promising target for the treatment of diabetic podocytopathy.


Conflict of interest statement

The authors declare no competing interests.

Figures

Fig. 1
Fig. 1. Podocyte ROCK2 is upregulated in animal models of diabetes and in patients with diabetes.
a ROCK2 levels in the renal cortex of streptozotocin (STZ)-injected mice, db/db mice, and mice treated with high-fat diet (HFD). b The expression levels of ROCK2 in isolated glomeruli. c A correlation analysis between glomerular ROCK2 mRNA and albumin-to-creatinine ratio (ACR). Hodgin Diabetes Mouse Glom data obtained from the transcriptomic database Nephroseq (https://www.nephroseq.com) were used. The trendline is shown in red. The R value was determined by Pearson correlation analysis; white and gray plots represent non-diabetic mice and diabetic mice, respectively (n = 18–21). d Immunostaining of ROCK2 (green) and Nephrin (red) in the glomerulus of STZ-injected mice, db/db mice, and HFD-fed mice. Nuclei were visualized with DAPI (blue). The scale bar on the top left represents 10 μm. e Immunostaining of ROCK2 (green) and Nephrin (red) in the glomeruli of patients without or with diabetes. Nuclei were visualized with DAPI (blue). The scale bar on the top left represents 50 μm. *p < 0.05. Data represent the mean ± s.e.m.
Fig. 2
Fig. 2. Generation of podocyte-specific ROCK2-deficient mice.
a The strategy for the generation of podocyte-specific ROCK2 knockout mice. Gene-targeting vectors were constructed to delete exon 3 of ROCK2. b Representative genotyping PCR detecting transgenic ROCK2-floxed alleles and Podocin-Cre (Pod-Cre). c Confirmation of tissue-restricted-ROCK2 deletion in podocyte-specific ROCK2 knockout mice (PR2KO). The mRNA levels of ROCK2 in the glomerulus (Glom), liver, muscle, and heart are demonstrated (n = 3). d Immunolabeling of ROCK2 and the expression of nephrin in kidney sections obtained from WT and PR2KO mice. The scale bar at the left top represents 10 μm. e Representative images of the whole body (upper panel) and kidney (lower panel) in each genotype. The scale bar on the top left represents 1 cm. f Representative PAS staining and transmission electron microscope (TEM) images of the glomerulus from WT and PR2KO mice. The scale bars at the top represents 10 μm and 1 μm, respectively. g Body weight information in aged WT and PR2KO (n = 9–11). h ACR at 12 months of age (n = 9–10). *p < 0.05. Data represent the mean ± s.e.m.
Fig. 3
Fig. 3. Ablation of podocyte ROCK2 prevents diabetic renal damage in mice.
a The breeding scheme that was used to generate PR2KO mice. Diabetes was induced by STZ injection, mating with db/m mice to generate db/db mice, or HFD feeding. b ACR in STZ-injected, db/db, HFD-fed WT and PR2KO mice (n = 4–8). c The kidney weight in the three experimental groups (n = 4–8). d Representative PAS-stained images of kidney glomeruli from mice. The scale bar on the top left represents 10 μm (n = 4–6). e Wilms tumor 1 (WT1) immunostaining and quantification of WT1-positive cells in glomeruli from mice. The scale bar on the top left represents 10 μm (n = 4). f Foot process width examined by transmission electron microscopy. The scale bar on the top left represents 1 μm (n = 4). g Glomerular basement membrane (GBM) thickness assessed by transmission electron microscopy. The scale bar on the top left represents 0.5 μm (n = 4). *p < 0.05. Data represent the mean ± s.e.m.
Fig. 4
Fig. 4. RNA-sequencing reveals the metabolic signature in ROCK2-null podocytes.
a The experimental approach to generate samples for high throughput RNA-sequencing. Murine podocytes were treated with negative control (siCtrl) or siRNA against ROCK2 (siR2). b, c A heat map (b) and volcano plot (c) of differentially expressed genes in podocytes based on log (fold change) >1.5 with adjusted p < 0.05. d Results of a gene-set enrichment analysis (p value top 20).
Fig. 5
Fig. 5. ROCK2 deletion improves fatty acid metabolism.
ac The amounts of ATP (a), the expression of markers of apoptosis (b), the number of TUNEL-positive podocytes (c) treated with vehicle (DMSO) or etomoxir for 24 h. The scale bar on the top left represents 100 μm (n = 3). d The glomerular expression of TGF-β in STZ-injected mice, db/db mice, and mice treated with HFD (n = 6). e FAO was assessed using cell lysates obtained from podocytes treated with siRNA against ROCK2 (n = 3). f Relative mRNA levels of FAO mediators in podocytes treated with siRNA against ROCK2 before stimulation with TGF-β (n = 3). g PPARα mRNA levels in podocytes treated with siRNA against ROCK2 before stimulation with TGF-β (n = 3). h Representative microphotographs and the quantification of TUNEL-positive apoptotic podocytes. Podocytes were pretreated with siRNA against ROCK2 before stimulation with TGF-β. Etomoxir was used in order to inhibit fatty acid oxidation in podocytes treated with ROCK2 siRNA. Fenofibrate was used to investigate the effect of PPARα activation on podocyte apoptosis. The scale bar on the top left represents 50 μm (n = 3). i Glomerular PPARα mRNA levels in WT and PR2KO mice. j A correlation analysis between glomerular transcripts of ROCK2 and PPARα. Hodgin Diabetes Mouse Glom data obtained from the transcriptomic database Nephroseq (https://www.nephroseq.com) were used. The trendline is shown in red. The R value was determined by Pearson correlation analysis; white and gray plots represent non-diabetic mice and diabetic mice, respectively (n = 18–21). *p < 0.05. Data represent the mean ± s.e.m.
Fig. 6
Fig. 6. ROCK2 inhibition attenuates diabetic podocytopathy through targeting PPARα.
a A schematic summary of key observations. In diabetic kidneys, podocyte ROCK2 is upregulated with proteinuria. Podocyte-specific ROCK2 deletion prevents the loss of podocytes by recovering PPARα signaling.

References

    1. Steffes MW, Schmidt D, McCrery R, Basgen JM, International Diabetic Nephropathy Study Group. Glomerular cell number in normal subjects and in type 1 diabetic patients. Kidney Int. 2001;59:2104–2113. doi: 10.1046/j.1523-1755.2001.00725.x. - DOI - PubMed
    1. Dalla Vestra M, et al. Is podocyte injury relevant in diabetic nephropathy? Studies in patients with type 2 diabetes. Diabetes. 2003;52:1031–1035. doi: 10.2337/diabetes.52.4.1031. - DOI - PubMed
    1. Matoba K, et al. Rho-kinase inhibition prevents the progression of diabetic nephropathy by downregulating hypoxia-inducible factor 1alpha. Kidney Int. 2013;84:545–554. doi: 10.1038/ki.2013.130. - DOI - PubMed
    1. Matoba K, et al. Rho-kinase regulation of TNF-alpha-induced nuclear translocation of NF-kappaB RelA/p65 and M-CSF expression via p38 MAPK in mesangial cells. Am. J. Physiol. Renal Physiol. 2014;307:F571–F580. doi: 10.1152/ajprenal.00113.2014. - DOI - PubMed
    1. Matoba K, et al. Rho-kinase mediates TNF-alpha-induced MCP-1 expression via p38 MAPK signaling pathway in mesangial cells. Biochem. Biophys. Res. Commun. 2010;402:725–730. doi: 10.1016/j.bbrc.2010.10.093. - DOI - PubMed

Publication types