. 2022 Apr 8;12(1):5985.
doi: 10.1038/s41598-022-09891-6.

Dopamine receptor 1 expressing B cells exert a proinflammatory role in female patients with rheumatoid arthritis

Affiliations

Dopamine receptor 1 expressing B cells exert a proinflammatory role in female patients with rheumatoid arthritis

Karolin Wieber et al. Sci Rep. .

Abstract

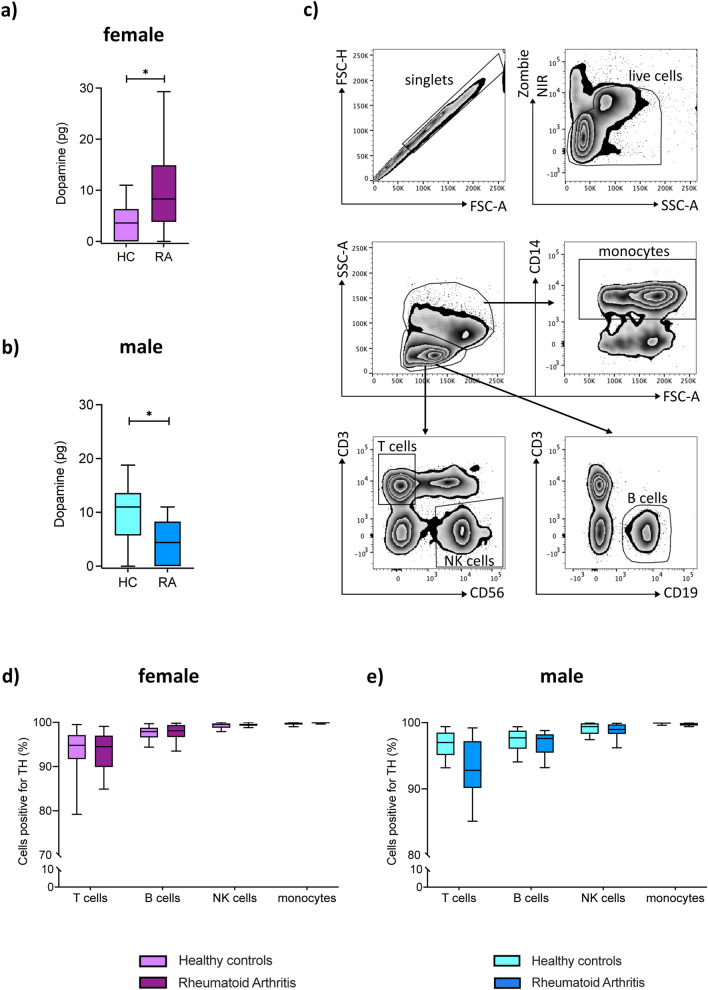
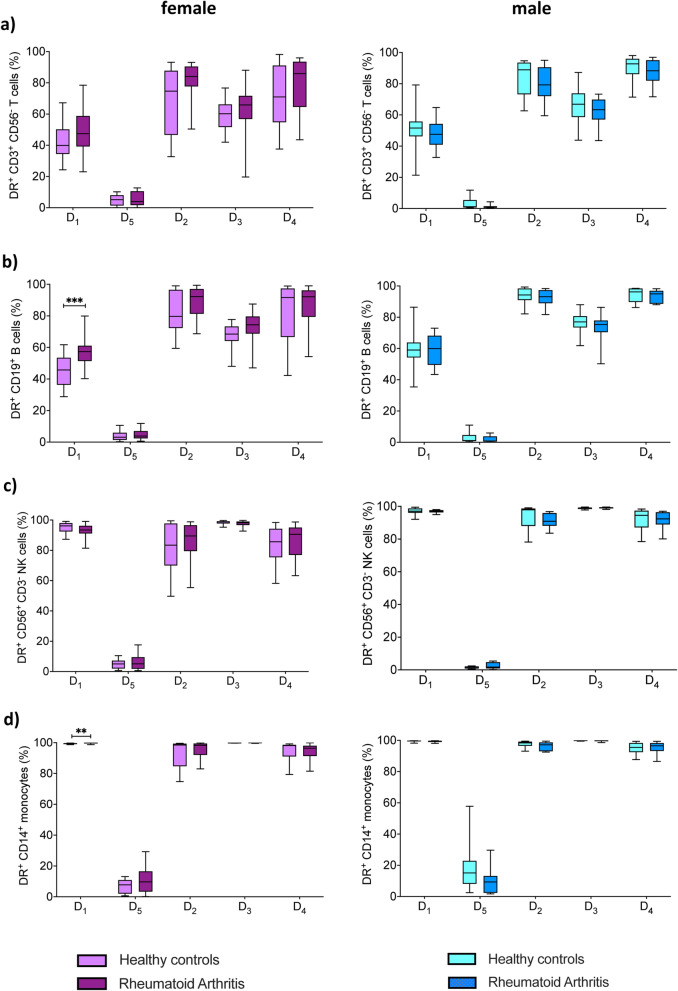
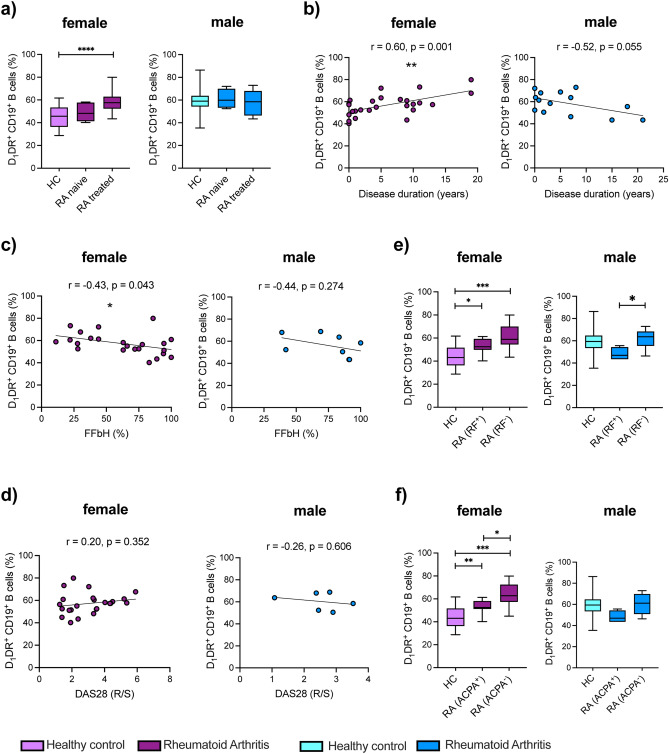
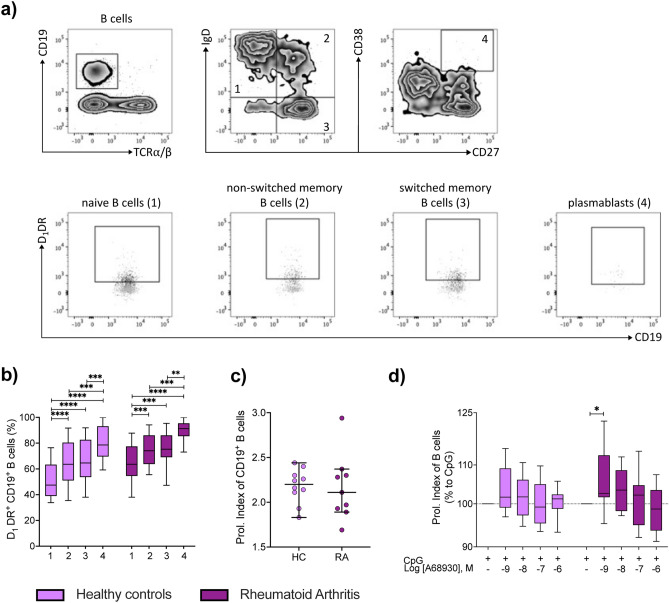
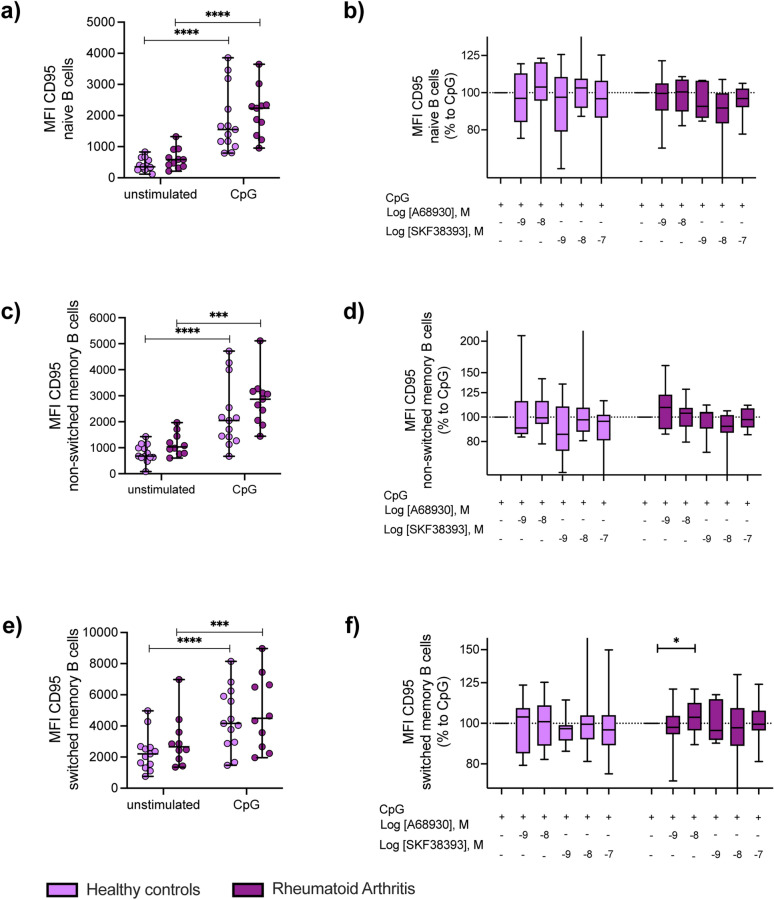
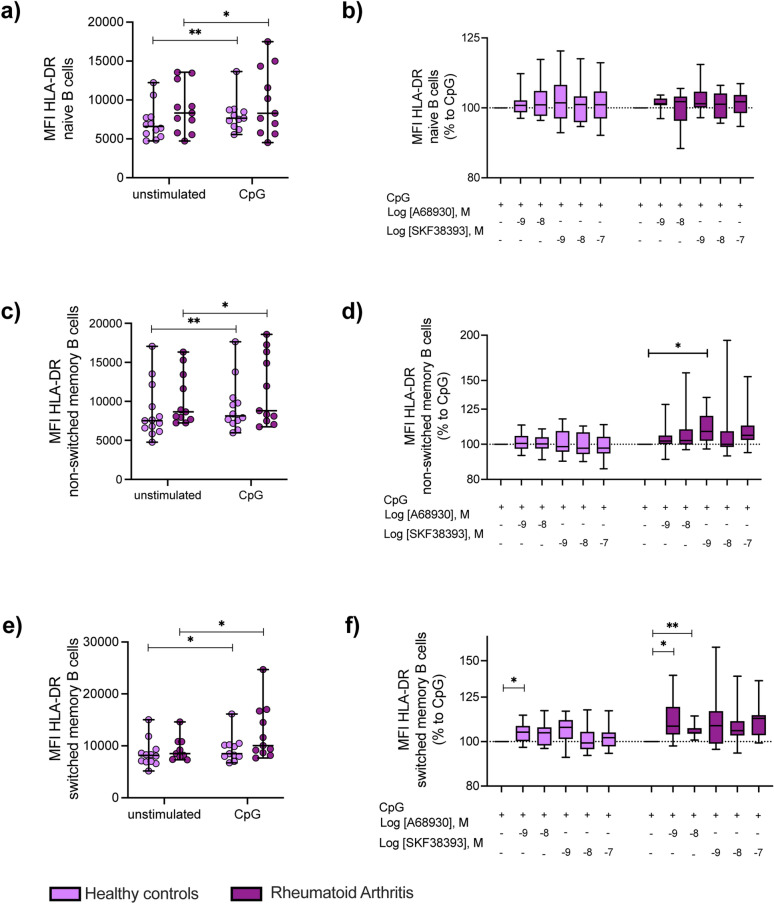
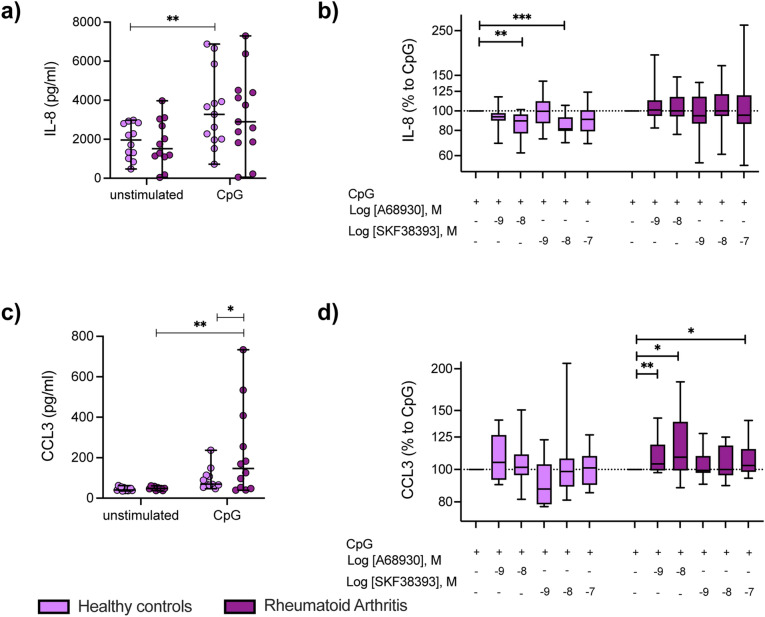
Rheumatoid arthritis (RA) is a chronic rheumatic disease with a clear sex-bias. Recent data indicated a role for dopamine in RA pathogenesis, while dopaminergic pathways can be modulated by estrogens. As defined mechanism of action of dopamine on B cell function in RA are unclear, we aimed to elucidate this, with special focus on sex-differences. Healthy controls (HC, n = 64) and RA patients (n = 61) were recruited. Expression of D1-D5 dopamine receptors (DRs) was investigated by flow cytometry on peripheral blood mononuclear cells (PBMCs). D1-like DRs were stimulated in vitro to assess effects on B cell activation and proliferation. Secretion of cytokines and dopamine content were measured by ELISA. All DRs were expressed on PBMCs of HC and RA patients. Dopamine content in PBMCs, and frequency of D1DR expressing B cells were significantly higher in RA females (p < 0.001). Expression of D1DR on RA B cells correlated positively with disease duration and severity only in women. Combined B cell and D1-like DR stimulation induced higher IL-8 and CCL-3 secretion from PBMCs of female RA patients compared to HC. These results indicate sex-specific differences in dopaminergic pathway in RA, with a proinflammatory feature of the D1DR pathway in women.


Conflict of interest statement

The authors declare no competing interests.

Figures

Figure 1
Figure 1
Dopamine content and expression of tyrosine hydroxylase in peripheral immune cells from RA patients and HC. Dopamine level was measured in PBMCs obtained from healthy control (HC) and rheumatoid arthritis (RA) patients by TriCat ELISA and TH expression was analyzed by flow cytometry. (a, b) Concentration of dopamine in 106 freshly isolated PBMCs (HC female n = 10, RA female n = 14, HC male n = 11, RA male n = 10). (c) Gating strategy to discriminate between CD3+CD56- T cells, CD3-CD56+ NK cells, CD19+ B cells and CD14+ monocytes d) Quantification of TH expression in aforementioned PBMC subsets from HC and RA patients (HC female n = 24, RA female n = 27, HC male n = 16, RA male n = 15). Welch’s t test was used to compare catecholamine levels in PBMCs from HC and RA patients; Mixed-effects analysis with Geisser-Greenhouse correction and Sidak multiple comparison test was used for comparing TH expression between groups; *p ≤ 0.05.
Figure 2
Figure 2
Expression of dopaminergic receptors in peripheral immune cells from RA patients and HC. Quantification of D1–D5 DR expression in CD3+CD56- T cells (a), CD19+ B cells (b), CD3-CD56+ NK cells (c) and CD14+ monocytes (d) from HC (female n = 24, male n = 16) and RA patients (female n = 27, male n = 15). Mixed-effects analysis with Geisser-Greenhouse correction and Sidak multiple comparison test was used for comparing DR expression between groups; **p ≤ 0.01, ***p ≤ 0.001.
Figure 3
Figure 3
D1DR expression on peripheral B cells from female RA patients correlates with clinical parameters. Differential expression of D1DR on CD19+ B cells from RA patients was correlated with available patient information at day of blood withdrawal. (a) comparison of D1DR level on CD19+ B cells from HC (female n = 24, male n = 16) as well as naïve RA (female n = 5, male n = 4) and treated RA (female n = 20, male n = 11) patients (bd) D1DR level on CD19+ B cells from RA patients was analyzed regarding disease duration (b, female n = 27, male n = 14), FFbH (c, female n = 27, male n = 7) and DAS28 score (d, female n = 27, male n = 6). (e, f) Quantification of D1DR expression on CD19+ B cells from HC (female n = 23, male n = 14) and RA patients categorized into rheumatoid factor (RF) positive and negative (e, female n = 14 and 13, male n = 4 and 9 respectively)) or anti-citrullinated protein antibodies (ACPA) positive and negative (f, female n = 16 and 10, male n = 4 and 6 respectively). Simple linear regression with Pearson correlation analysis was used to analyze D1DR expression in relation to clinical parameters; Brown-Forsythe and Welch ANOVA tests with Dunnett T3 multiple comparison test were used to compare D1DR expression between groups; *p ≤ 0.05, **p ≤ 0.01, ***p ≤ 0.001, ****p ≤ 0.0001.
Figure 4
Figure 4
D1DR expression in different maturation stages of B cells and during B cell proliferation. D1DR expression was analyzed in defined B cell subpopulations from HC and RA patients by flow cytometry. (a) Gating strategy to investigate D1DR expression in naïve (1, CD19+TCRα/β-IgD+CD27-), non-switched memory (2, CD19+TCRα/β-IgD+CD27+), switched memory B cells (3, CD19+TCRα/β-IgD-CD27+) and plasmablasts (4, CD19+TCRα/β-CD27+CD38+), black: stained sample, grey: FMO control. (b) Quantification of D1DR on aforementioned B cell subsets from HC and RA female patients (n = 17 and 21 respectively). (c, d) PBMCs from HC and RA female patients were stimulated with CpG and indicated concentrations of D1-like receptor agonist A68930 for 6 days in vitro. Proliferation of CD19+ B cells was then analyzed by CFSE-dye dilution via flow cytometry. (c) Proliferation index of CD19+ B cells from HC and RA patients (n = 10 and 9 respectively) under pure CpG stimulation are presented as median with SD. (d) Proliferation index of CD19+ B cells of both groups after D1-like stimulation were normalized to CpG controls and are presented as relative changes (n = 10). One-Way ANOVA with Geisser-Greenhouse correction and Tukey multiple comparison test was used to analyze expression between B cell subsets within HC and RA group; Welch’s t test was used to compare CpG stimulated controls from HC and RA group; Raw data were logarithmized and analyzed by mixed-effects analysis with Geisser-Greenhouse correction and Dunnett multiple comparison test to determine the influence of D1-like receptor stimulation within the HC and RA group; *p ≤ 0.05, **p ≤ 0.01, ***p ≤ 0.001, ****p ≤ 0.0001.
Figure 5
Figure 5
D1-like receptor stimulation slightly increases CD95 expression on switched memory B cells from female RA patients. PBMCs from HC (n = 13) and RA patients (n = 10–11) were stimulated with CpG and indicated concentrations of D1-like receptor agonists A68930 and SKF38393 for 24 h in vitro. Expression of CD95 was analyzed in naïve B cells (CD19+IgD+CD27-), non-switched memory B cells (CD19+IgD+CD27+) and switched memory B cells (CD19+IgD-CD27+) by flow cytometry and expression data are shown as MFI. (a, c, e) Absolute CD95 expression is shown for naïve B cells (a), non-switched memory B cells (c) and switched memory B cells (e) in unstimulated and CpG-stimulated PBMCs from HC and RA patients. Lines indicate median with SD. (b, d, f) CD95 expression of naïve B cells (b), non-switched memory B cells (d) and switched memory B cells (f) after D1-like stimulation was normalized to CpG controls from HC and RA patients and are presented as relative changes on a logarithmic scale. Two-Way ANOVA or mixed-effects-analysis, depending on missing values, with Sidak multiple comparison test was used to analyze CD95 expression between unstimulated and CpG stimulated samples from HC and RA; Raw data were logarithmized and analyzed by One-Way ANOVA or mixed-effects analysis, depending on missing values, with Geisser-Greenhouse correction and Dunnett multiple comparison test to determine the influence of D1-like receptor stimulation on CD95 expression within HC and RA group; *p ≤ 0.05, ***p ≤ 0.001, ****p ≤ 0.0001.
Figure 6
Figure 6
D1-like receptor stimulation increases activation of memory B cells from female RA patients. PBMCs from HC (n = 13–12) and RA patients (n = 11) were stimulated with CpG and indicated concentrations of D1-like receptor agonists A68930 and SKF38393 for 24 h in vitro. Expression of HLA-DR was analyzed in naïve B cells (CD19+IgD+CD27-), non-switched memory B cells (CD19+IgD+CD27+) and switched memory B cells (CD19+IgD-CD27+) by flow cytometry and expression data are shown as MFI. (a, c, e) Absolute HLA-DR expression is shown for naïve B cells (a), non-switched memory B cells (c) and switched memory B cells (e) in unstimulated and CpG-stimulated PBMCs from HC and RA patients. Lines indicate median with SD. (b, d, f) HLA-DR expression of naïve B cells (b), non-switched memory B cells (d) and switched memory B cells (f) after D1-like stimulation was normalized to CpG controls from HC and RA patients and are presented as relative changes on a logarithmic scale. Two-Way ANOVA or mixed-effects-analysis, depending on missing values, with Sidak multiple comparison test was used to analyze HLA-DR expression between unstimulated and CpG stimulated samples from HC and RA; Raw data of HLA-DR expression were logarithmized and analyzed by One-Way ANOVA or mixed-effects analysis, depending on missing values, with Geisser-Greenhouse correction and Dunnett multiple comparison test to determine the influence of D1-like receptor stimulation on HLA-DR expression within HC and RA group; *p ≤ 0.05, **p ≤ 0.01.
Figure 7
Figure 7
D1-like receptor stimulation alters cytokine secretion of PBMCs from female RA patients compared to HC. PBMCs from HC (n = 13–12) and RA patients (n = 13–12) were stimulated with CpG and indicated concentrations of D1-like receptor agonists A68930 and SKF38393 for 24 h in vitro. Supernatants were stored at -80 °C for subsequent analysis of IL-8 and CCL3 concentrations by ELISA. (a, c) Absolute IL-8 (a) and CCL3 (c) concentrations in supernatants from unstimulated and CpG-stimulated PBMCs from HC and RA patients are shown. Lines indicate median with SD. (b, d) IL-8 (b) and CCL3 (d) concentrations in supernatants after D1-like stimulation were normalized to CpG controls from HC and RA patients and are presented as relative changes on a logarithmic scale. Mixed-effects-analysis with Sidak multiple comparison test was used to analyze cytokine secretion between unstimulated and CpG stimulated samples from HC and RA; Raw data of cytokine concentrations were logarithmized and analyzed by mixed-effects analysis with Geisser-Greenhouse correction and Dunnett multiple comparison test to determine the influence of D1-like receptor stimulation on cytokine secretion within HC and RA group; *p ≤ 0.05, **p ≤ 0.01, ***p ≤ 0.001.

Similar articles

Cited by

References

    1. Smolen JS, Aletaha D, Barton A, Burmester GR, Emery P, Firestein GS, Kavanaugh A, McInnes IB, Solomon DH, Strand V, et al. Rheumatoid arthritis. Nat. Rev. Dis. Primers. 2018;4:18001. doi: 10.1038/nrdp.2018.1. - DOI - PubMed
    1. Myasoedova E, Crowson CS, Kremers HM, Therneau TM, Gabriel SE. Is the incidence of rheumatoid arthritis rising? Results from Olmsted County, Minnesota, 1955–2007. Arthritis Rheum. 2010;62(6):1576–1582. doi: 10.1002/art.27425. - DOI - PMC - PubMed
    1. Tobon GJ, Youinou P, Saraux A. The environment, geo-epidemiology, and autoimmune disease: Rheumatoid arthritis. J. Autoimmun. 2010;35(1):10–14. doi: 10.1016/j.jaut.2009.12.009. - DOI - PubMed
    1. Ngo ST, Steyn FJ, McCombe PA. Gender differences in autoimmune disease. Front. Neuroendocrinol. 2014;35(3):347–369. doi: 10.1016/j.yfrne.2014.04.004. - DOI - PubMed
    1. Straub RH. The complex role of estrogens in inflammation. Endocr. Rev. 2007;28(5):521–574. doi: 10.1210/er.2007-0001. - DOI - PubMed