. 2022 Apr 8;5(1):47.
doi: 10.1038/s41746-022-00590-0.

Cohort design and natural language processing to reduce bias in electronic health records research

Affiliations

Cohort design and natural language processing to reduce bias in electronic health records research

Shaan Khurshid et al. NPJ Digit Med. .

Abstract

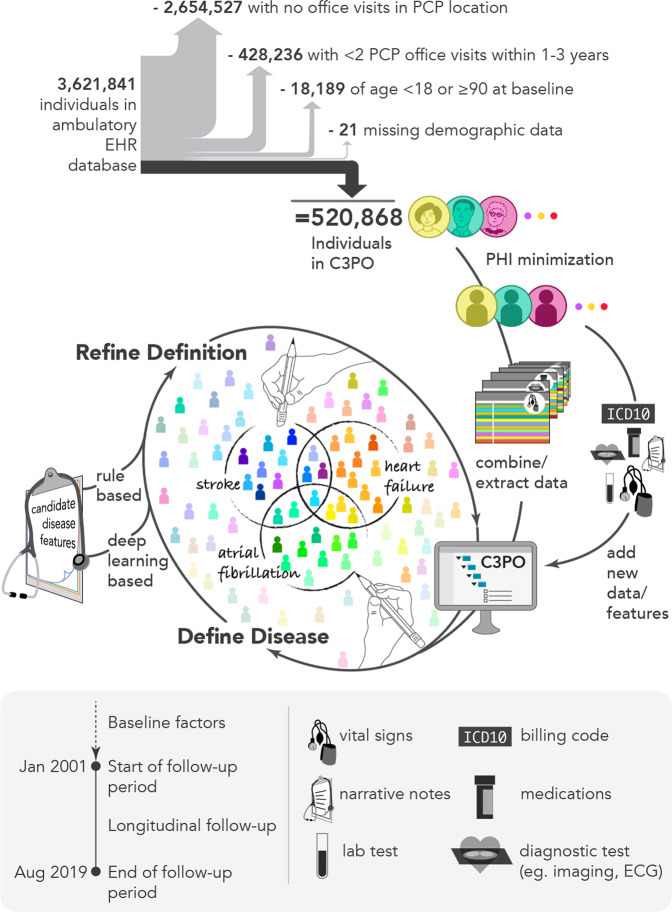
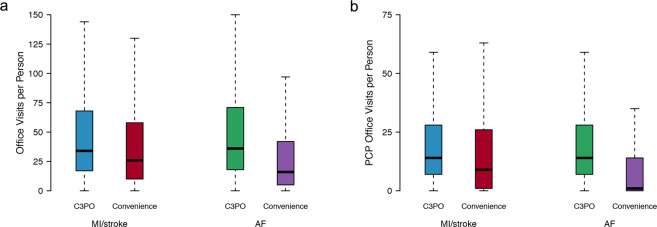
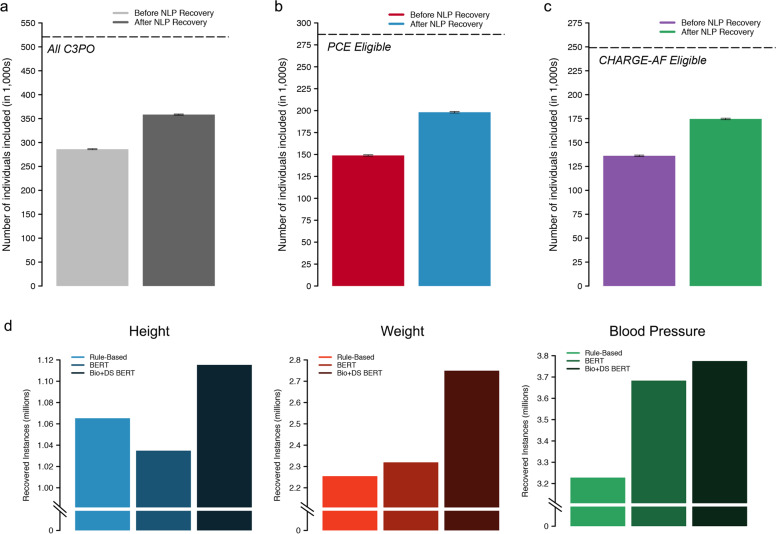
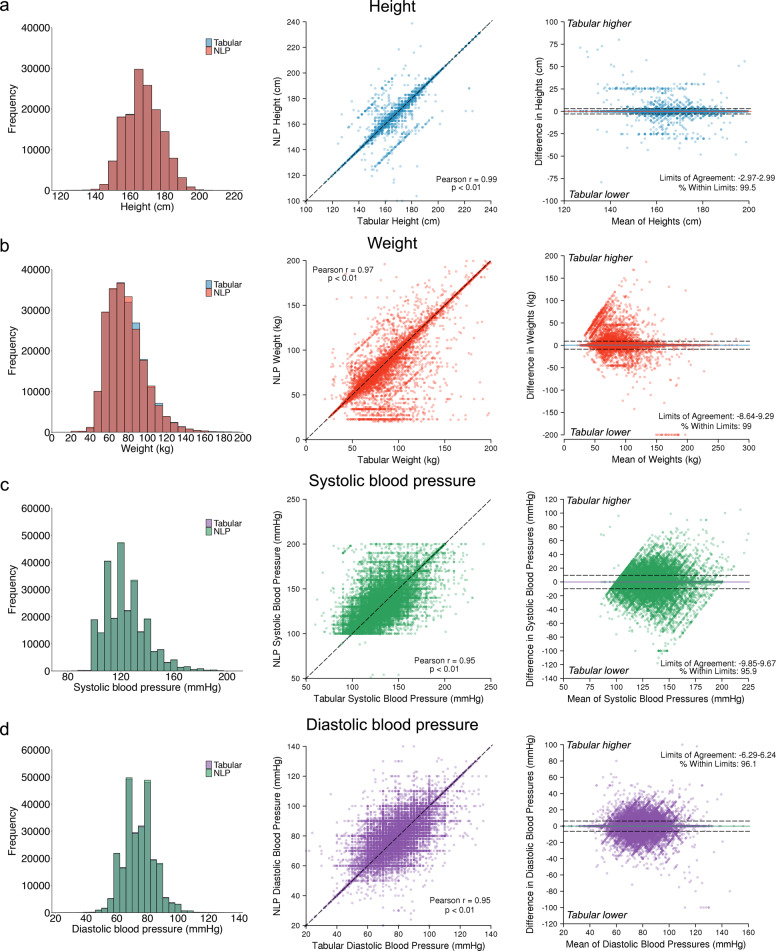
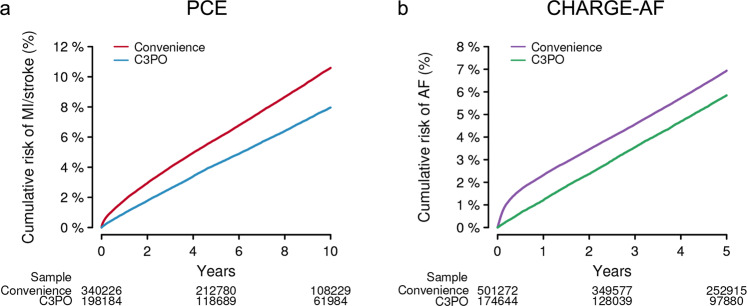
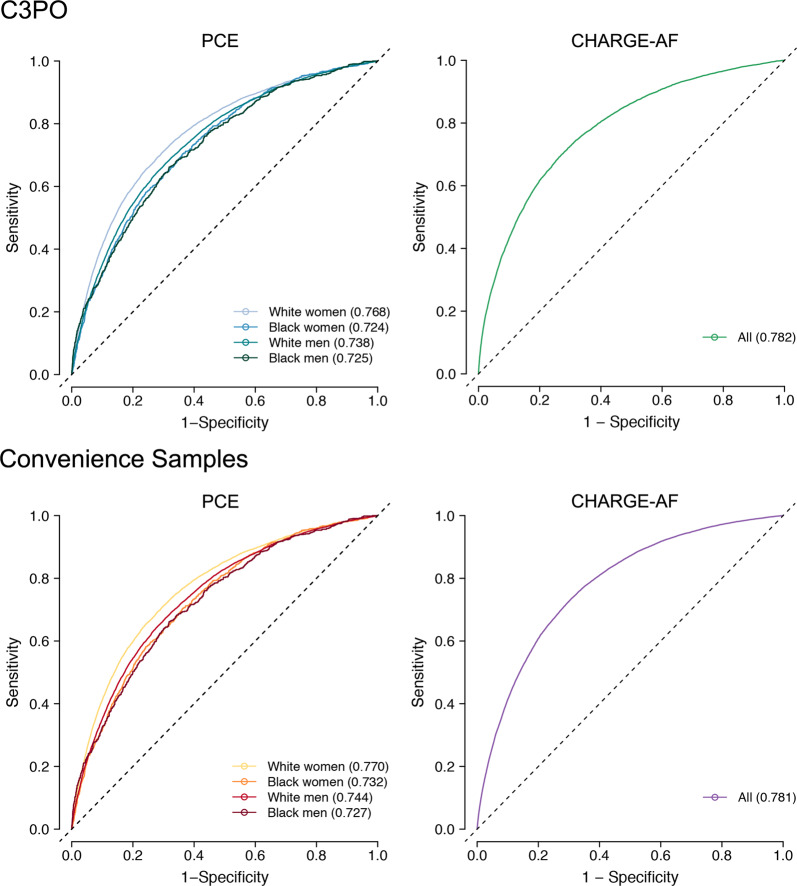
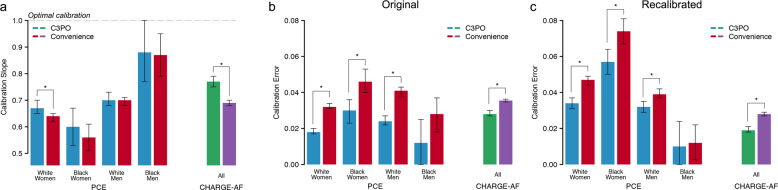
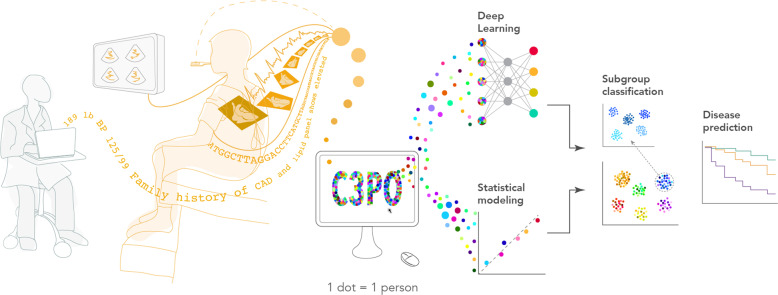
Electronic health record (EHR) datasets are statistically powerful but are subject to ascertainment bias and missingness. Using the Mass General Brigham multi-institutional EHR, we approximated a community-based cohort by sampling patients receiving longitudinal primary care between 2001-2018 (Community Care Cohort Project [C3PO], n = 520,868). We utilized natural language processing (NLP) to recover vital signs from unstructured notes. We assessed the validity of C3PO by deploying established risk models for myocardial infarction/stroke and atrial fibrillation. We then compared C3PO to Convenience Samples including all individuals from the same EHR with complete data, but without a longitudinal primary care requirement. NLP reduced the missingness of vital signs by 31%. NLP-recovered vital signs were highly correlated with values derived from structured fields (Pearson r range 0.95-0.99). Atrial fibrillation and myocardial infarction/stroke incidence were lower and risk models were better calibrated in C3PO as opposed to the Convenience Samples (calibration error range for myocardial infarction/stroke: 0.012-0.030 in C3PO vs. 0.028-0.046 in Convenience Samples; calibration error for atrial fibrillation 0.028 in C3PO vs. 0.036 in Convenience Samples). Sampling patients receiving regular primary care and using NLP to recover missing data may reduce bias and maximize generalizability of EHR research.


Conflict of interest statement

The authors declare the following financial and non-financial interests: A.A.P. receives sponsored research support from Bayer AG, IBM, Intel, and Verily. He has also received consulted fees from Novartis and Rakuten. He is a Venture Partner at GV and is compensated for this work. J.E.H. receives sponsored research support from Bayer AG and Gilead Sciences. J.E.H. has received research supplies from EcoNugenics. S.F.F. receives sponsored research support from Bayer AG and IBM. C.D.A. receives sponsored research support from Bayer AG and has consulted for ApoPharma and Invitae. P.B. receives sponsored research support from Bayer AG and IBM, and consults for Novartis. S.A.L. receives sponsored research support from Bristol Myers Squibb/Pfizer, Bayer AG, Boehringer Ingelheim, and Fitbit, has consulted for Bristol Myers Squibb/Pfizer and Bayer AG, and participates in a research collaboration with IBM. P.T.E. receives sponsored research support from Bayer AG and IBM Research and he has consulted for Bayer AG, Novartis, MyoKardia, and Quest Diagnostics. S.J.A. receives sponsored research support from Bristol Myers Squibb/Pfizer and has consulted for Bristol Myers Squibb/Pfizer and Fitbit. J.M.A. has received sponsored research support from Bristol Myers Squibb/Pfizer. C.D., J.M., H.M.E., A.D., and M.G. are employees of Bayer AG. The remaining authors declare no competing interests.

Figures

Fig. 1
Fig. 1. Overview of C3PO construction and data pipeline.
Depicted is a graphical overview of the construction of the Community Care Cohort Project (C3PO). C3PO comprises the electronic health record (EHR) data of 520,868 individuals aged 18–90 at the start of sample follow-up, selected from an ambulatory EHR database on the basis of receiving periodic primary care (i.e., ≥2 visits within 1–3 consecutive years, see text). C3PO is structured as an indexed file system containing protected health information-minimized data of various types (bottom panel). The C3PO database can readily accommodate updating of existing data, integration of new data features, and construction of composite disease phenotypes based on multiple data features.
Fig. 2
Fig. 2. Distribution of office visits in C3PO versus Convenience Samples.
Depicted are boxplots demonstrating the distribution of office visits (a) and primary care physician (PCP) office visits (b) in the C3PO analysis samples (AF [blue] and MI/stroke [green]) versus the respective Convenience Samples (AF [red] and MI/stroke [purple]). In each boxplot, the black bar denotes the median number of office visits per individual, the box represents the interquartile range, and the whiskers represent points beyond the interquartile range. Points greater than quartile 3 plus 1.5 times the interquartile range and points smaller than quartile 1 minus 1.5 times the interquartile range are not depicted.
Fig. 3
Fig. 3. Yield of NLP-based missing data recovery.
Depicted is a summary of the yield of our deep natural language processing (NLP) based model for missing data recovery in C3PO. ac Compare effective sample sizes with versus without NLP recovery, where error bars depict 95% confidence intervals. a The y-axis depicts the total number of individuals with a baseline height, weight, and blood pressure, and the hashed line indicates the total sample size of C3PO. b The y-axis depicts the total number of individuals with a complete Pooled Cohort Equations (PCE) score at baseline and the hashed line indicates the total number of individuals eligible for PCE analysis (i.e., within age 40–79 years, with available follow-up data, and without prevalent MI/stroke). c The y-axis depicts the total number of individuals with a complete CHARGE-AF score at baseline and the hashed line indicates the total number of individuals eligible for CHARGE-AF analysis (i.e., within age 45–94 years, with available follow-up data, and without prevalent AF). d Depicts the total number of vital sign extractions obtained using the rule-based method (light shades), BERT (medium shades), and Bio + DischargeSummaryBERT (Bio + DS BERT, dark shades).
Fig. 4
Fig. 4. Agreement between tabular and natural language processing-extracted vital signs.
Depicted is agreement between vital signs obtained from tabular data and those obtained from our NLP model among individuals with values obtained on the same day. a Depict height values, b depict weight values, c depict systolic blood pressures, and d depict diastolic blood pressures. For individuals with multiple eligible values, only the pair most closely preceding the start of follow-up was used. Left panels show the distribution of values obtained from tabular versus NLP sources. Middle panels show the correlation between tabular values (x-axis) and NLP values (y-axis). Right panels are Bland–Altman plots showing agreement between paired tabular and NLP values. The x-axis depicts the increasing mean of the paired values, and the y-axis depicts the difference between the paired values, where positive values denote tabular values greater than corresponding NLP values and negative values denote tabular values lower than corresponding NLP values. The colored horizontal lines depict the mean difference between sources, and the hashed horizontal lines depict 1.96 standard deviations above and below the mean. The values corresponding to the bounds and percentage of values contained within those bounds is printed on each plot.
Fig. 5
Fig. 5. Cumulative event risk in C3PO versus Convenience Samples.
Depicted is Kaplan–Meier cumulative risk of MI/stroke (a) and AF (b) observed in C3PO (blue [left] and green [right]) versus the Convenience Samples (red [left] and purple [right]). The number of individuals remaining at risk over time is labeled below each plot. Note an initial rapid inflection in MI/stroke and AF incidence observed in the Convenience Samples but not in C3PO.
Fig. 6
Fig. 6. Model discrimination in C3PO and Convenience Samples.
Depicted are time-dependent receiver operating characteristic curves for the Pooled Cohort Equations (PCE, left panels) and the CHARGE-AF score (right panels) in C3PO (top panels) versus the respective Convenience Samples (bottom panels). Each plot shows the discrimination performance of each risk score for its respective prediction target (i.e., 10-year MI/stroke for the PCE, 5-year incident AF for CHARGE-AF). Since the PCE score comprises four models stratified on the basis of sex and race, the curves for each score are represented separately (see legend). The c-index calculated using the inverse probability of censoring weighting method is depicted for each model.
Fig. 7
Fig. 7. Model calibration in C3PO and Convenience Samples.
Depicted is model calibration performance in C3PO versus the Convenience Samples. a Depicts the calibration slope for the PCE models (x-axis, left) and CHARGE-AF (x-axis, right) in C3PO (blue, green) versus the Convenience Samples (red, purple). The y-axis depicts the calibration slope, a measure of the relationship between predicted event risk and observed event incidence, where a slope of one indicates an optimal relationship (horizontal hashed line), with corresponding 95% confidence intervals. b, c Compare calibration error in C3PO versus the Convenience Samples. Calibration error is depicted on the y-axis using the Integrated Calibration Index (ICI, see text), where lower values indicate better absolute agreement between predicted risk and observed event incidence. b Depicts ICI values using the original models, while c depicts ICI values after recalibration to the baseline hazard of each sample. In all plots, statistically significant differences between values in C3PO versus the Convenience Sample (p < 0.05) are depicted with an asterisk.
Fig. 8
Fig. 8. Conceptual overview of C3PO analysis methods.
Depicted is a graphical overview of the potential analyses enabled by the Community Care Cohort Project (C3PO). By integrating diverse data types (e.g., diagnoses, imaging, vital signs, diagnostic test data, genetics), C3PO may enable methods such as traditional statistical modeling and deep learning to facilitate more accurate disease risk prediction models and enable deep phenotyping including disease subgroup identification.

References

    1. Cowie MR, et al. Electronic health records to facilitate clinical research. Clin. Res. Cardiol. 2017;106:1–9. doi: 10.1007/s00392-016-1025-6. - DOI - PMC - PubMed
    1. Attia ZI, et al. An artificial intelligence-enabled ECG algorithm for the identification of patients with atrial fibrillation during sinus rhythm: a retrospective analysis of outcome prediction. Lancet. 2019;394:861–867. doi: 10.1016/S0140-6736(19)31721-0. - DOI - PubMed
    1. Tison GH, Zhang J, Delling FN, Deo RC. Automated and interpretable patient ECG profiles for disease detection, tracking, and discovery. Circulation. 2019;12:e005289. - PMC - PubMed
    1. Hulme OL, et al. Development and validation of a prediction model for atrial fibrillation using electronic health records. JACC Clin. Electrophysiol. 2019;5:1331–1341. doi: 10.1016/j.jacep.2019.07.016. - DOI - PMC - PubMed
    1. Li F, et al. Fine-tuning Bidirectional Encoder Representations From Transformers (BERT)-based models on large-scale electronic health record notes: an empirical study. JMIR Med. Inform. 2019;7:e14830. doi: 10.2196/14830. - DOI - PMC - PubMed