. 2022 Jun;19(6):711-723.
doi: 10.1038/s41592-022-01475-6. Epub 2022 Apr 8.

DiMeLo-seq: a long-read, single-molecule method for mapping protein-DNA interactions genome wide

Affiliations

DiMeLo-seq: a long-read, single-molecule method for mapping protein-DNA interactions genome wide

Nicolas Altemose et al. Nat Methods. 2022 Jun.

Abstract

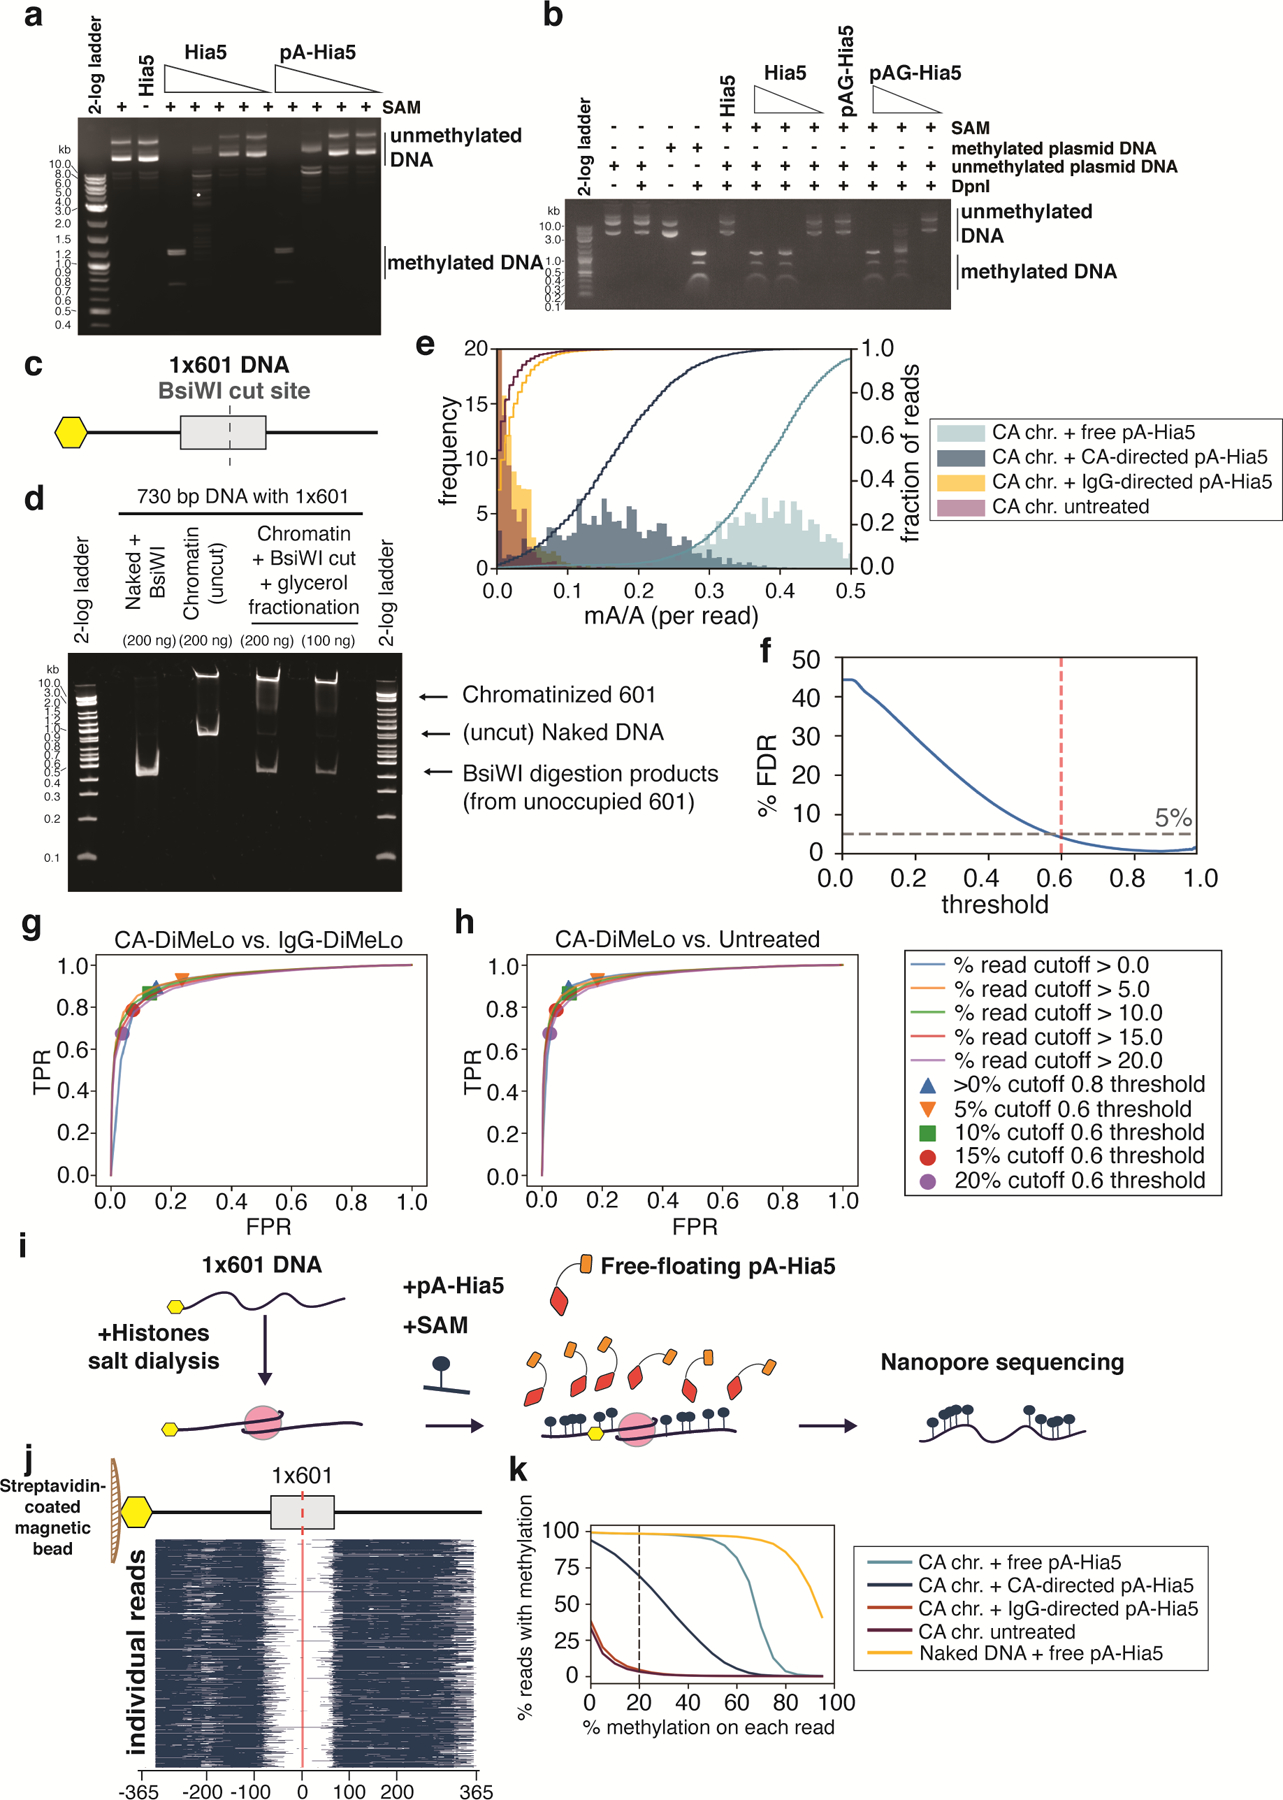
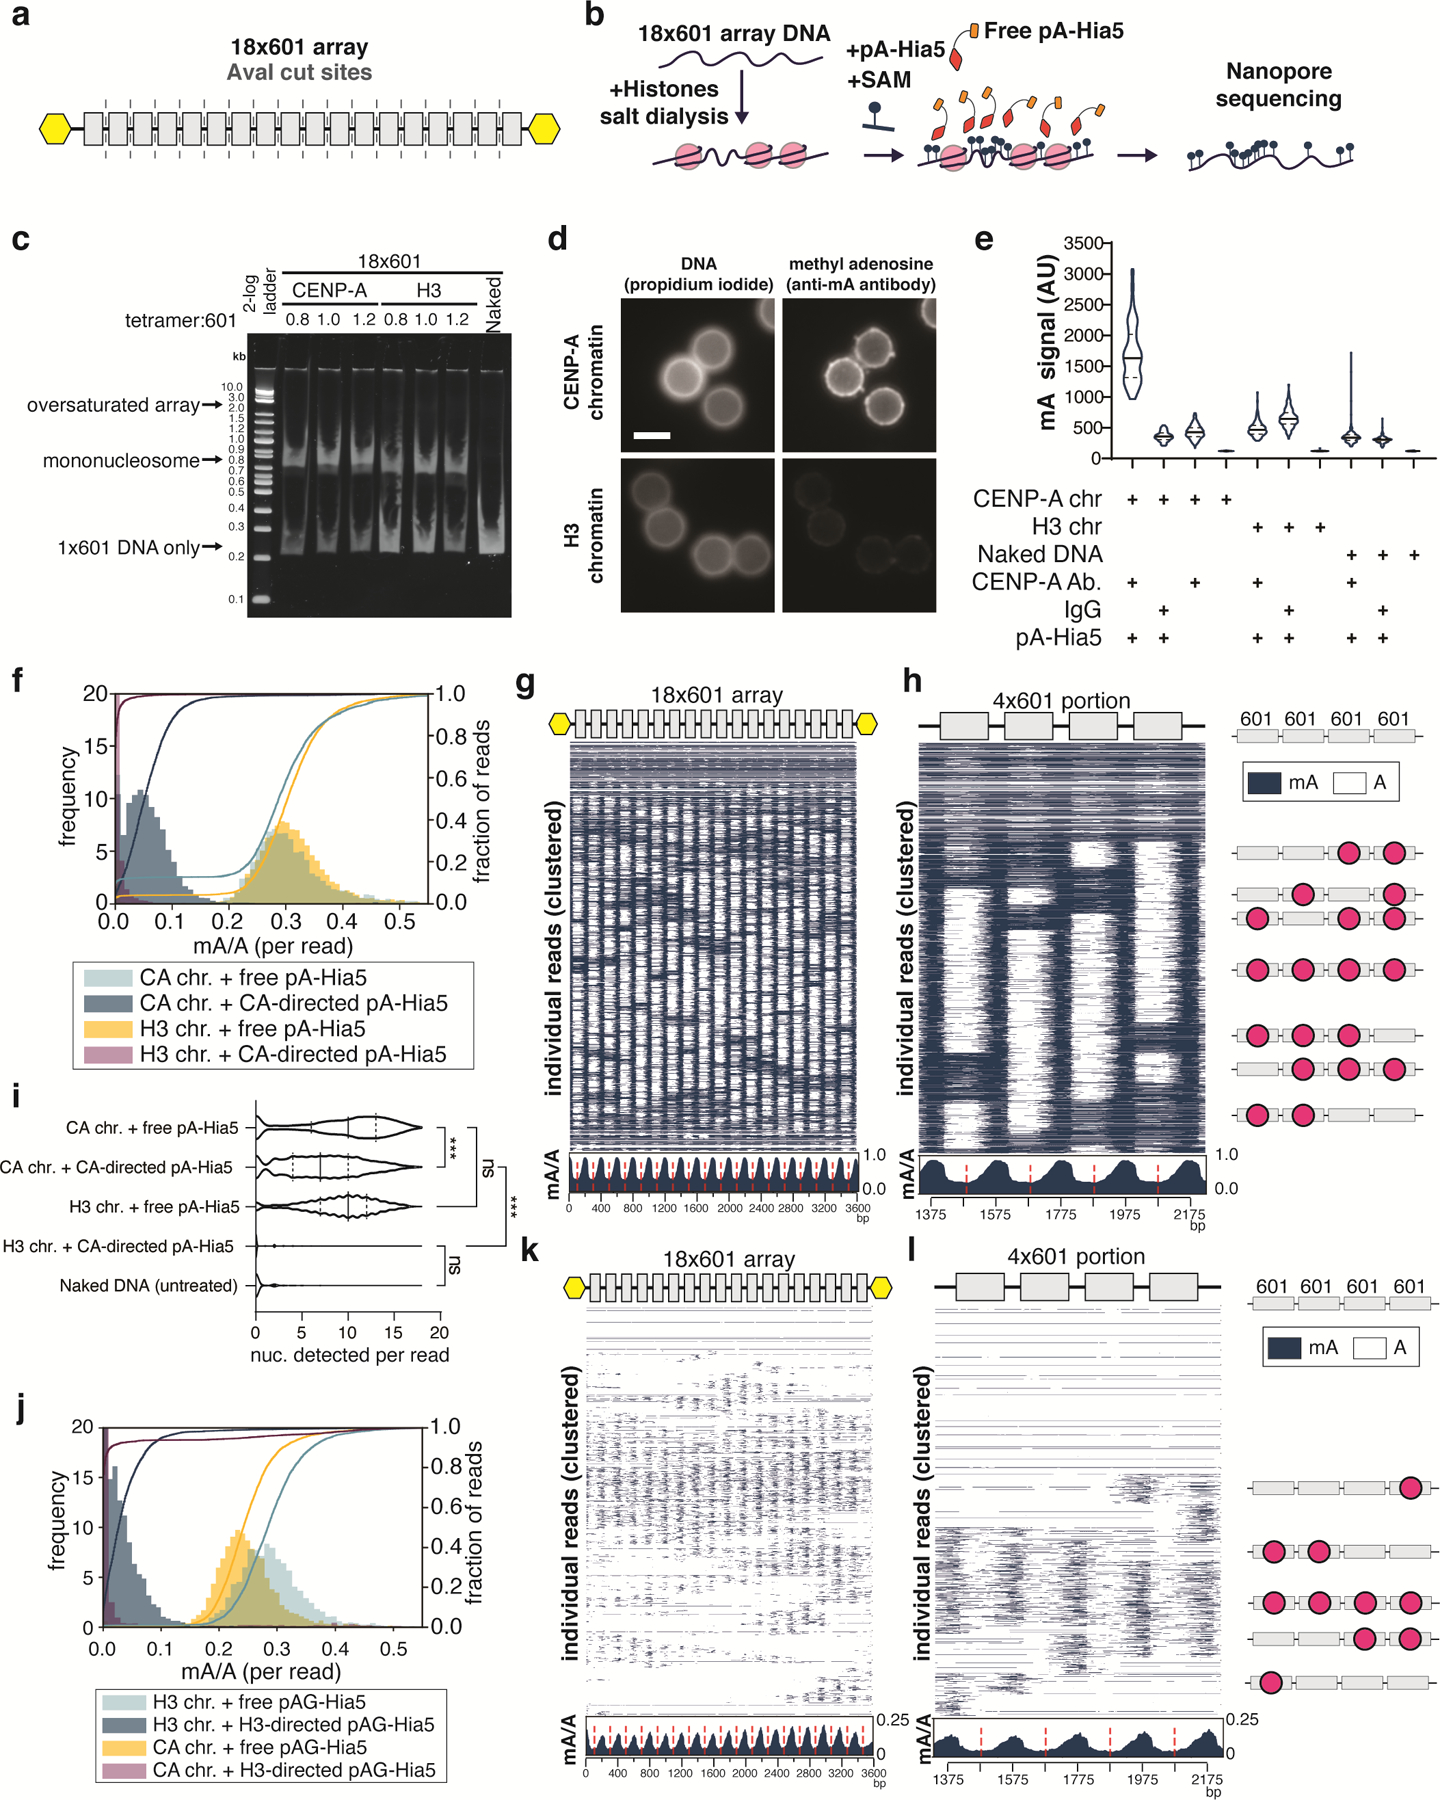
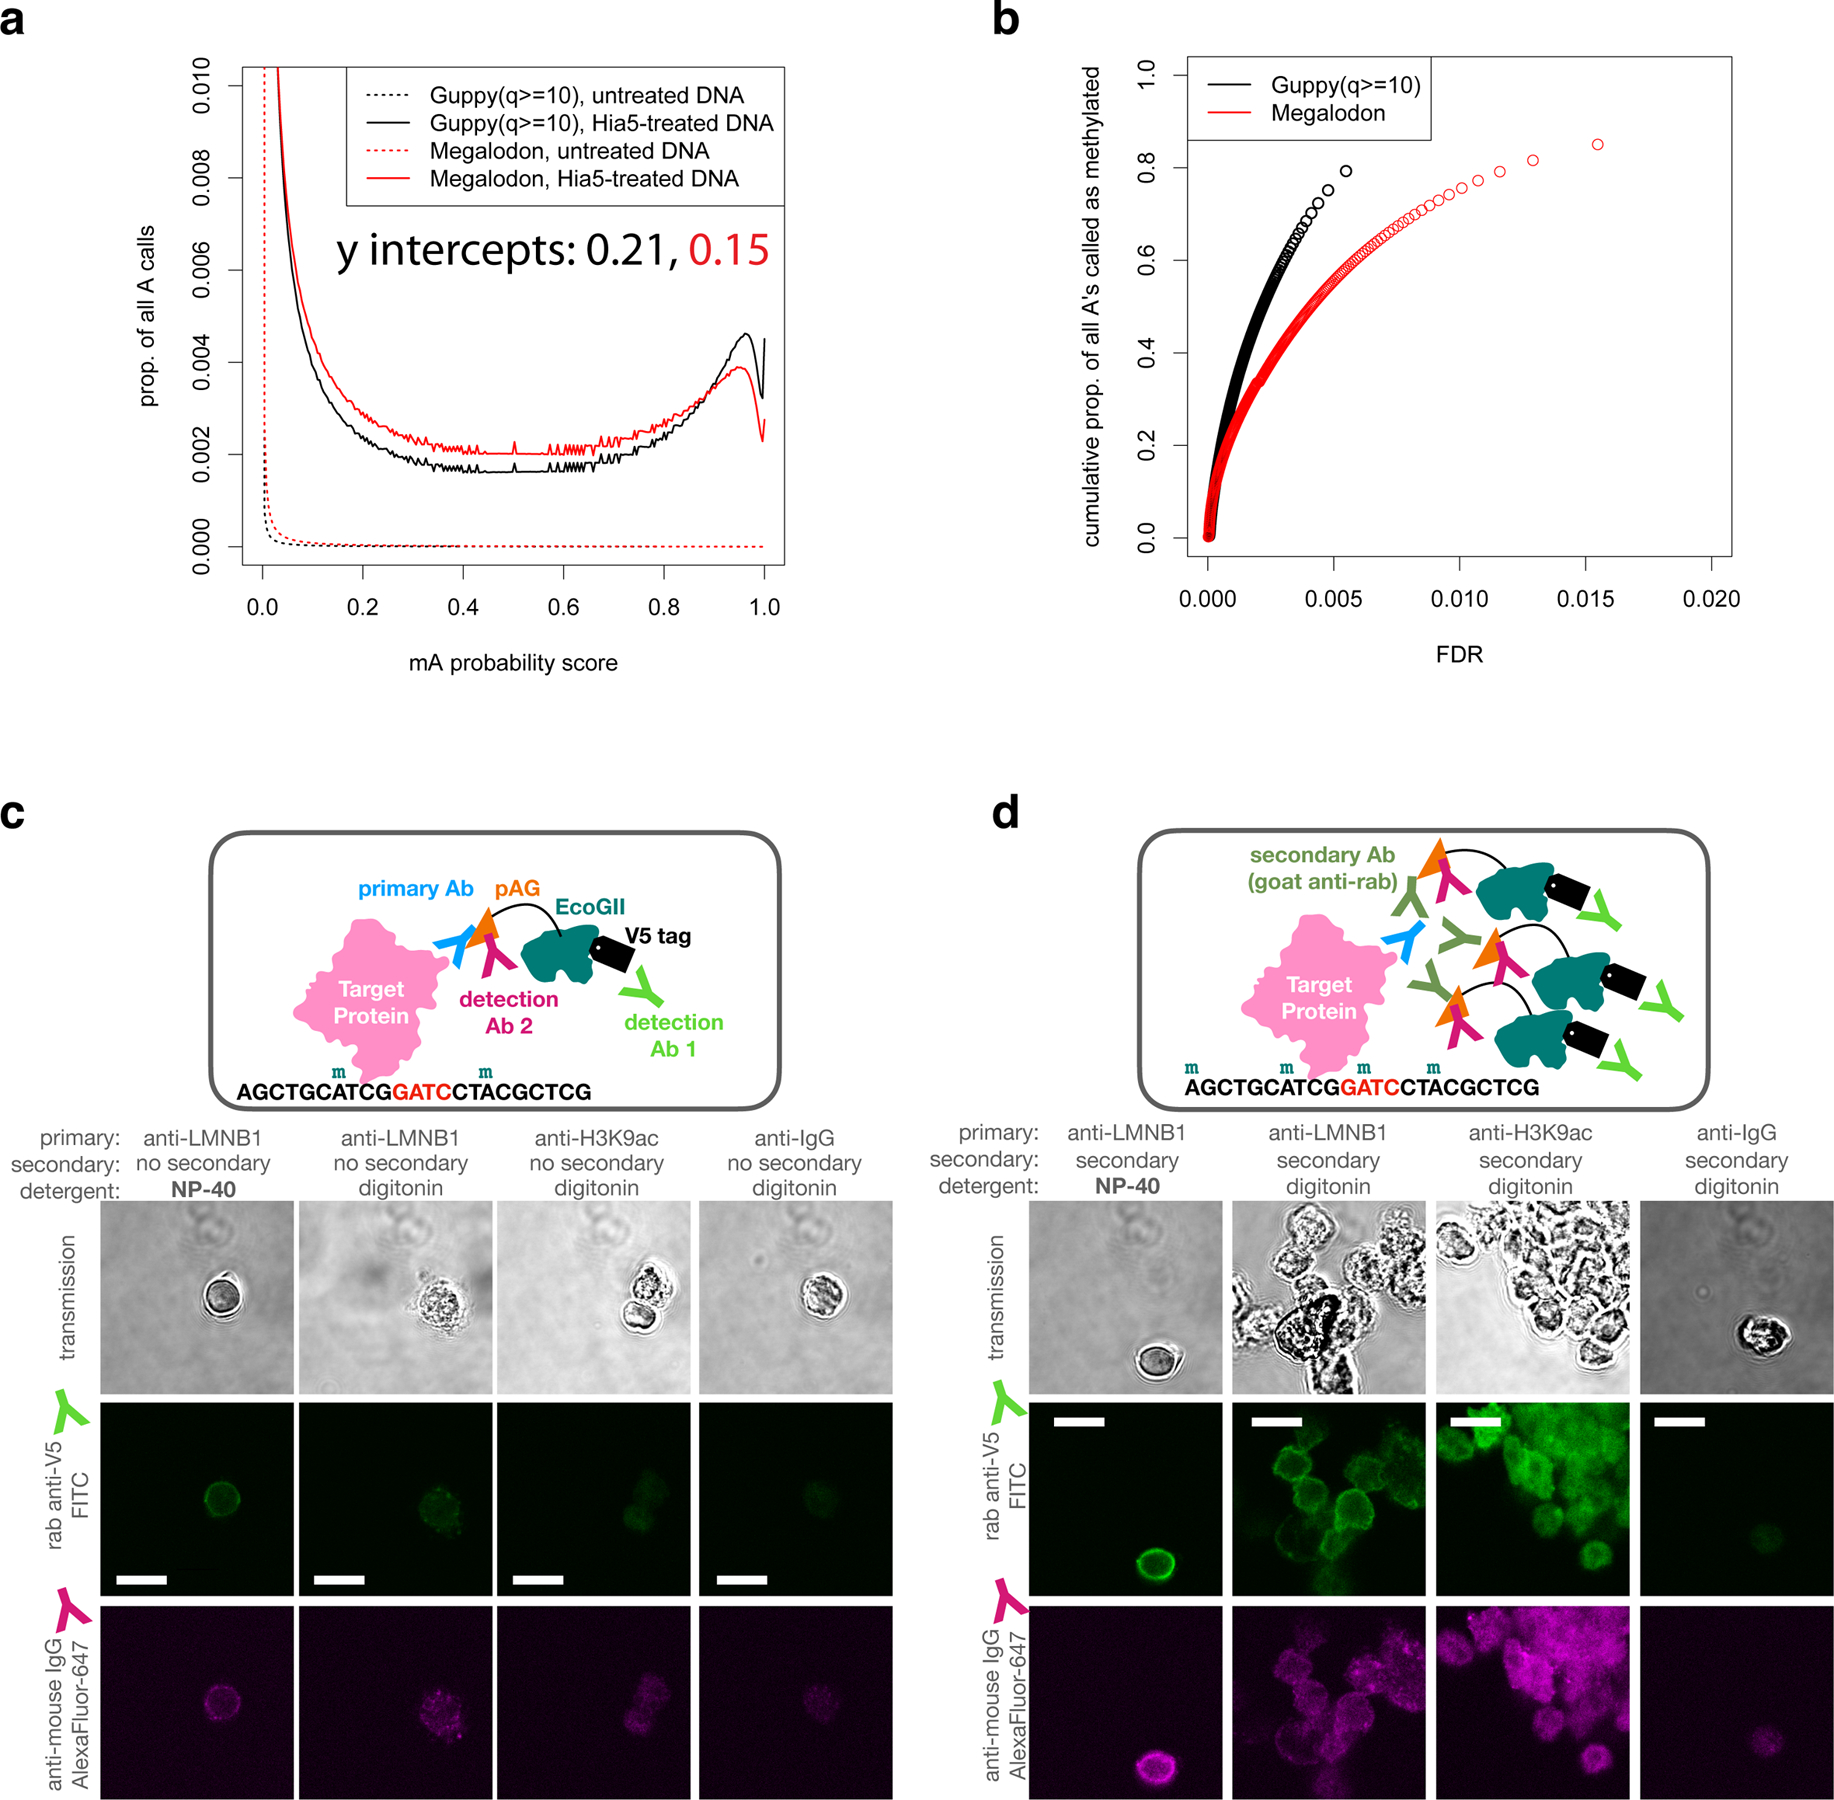
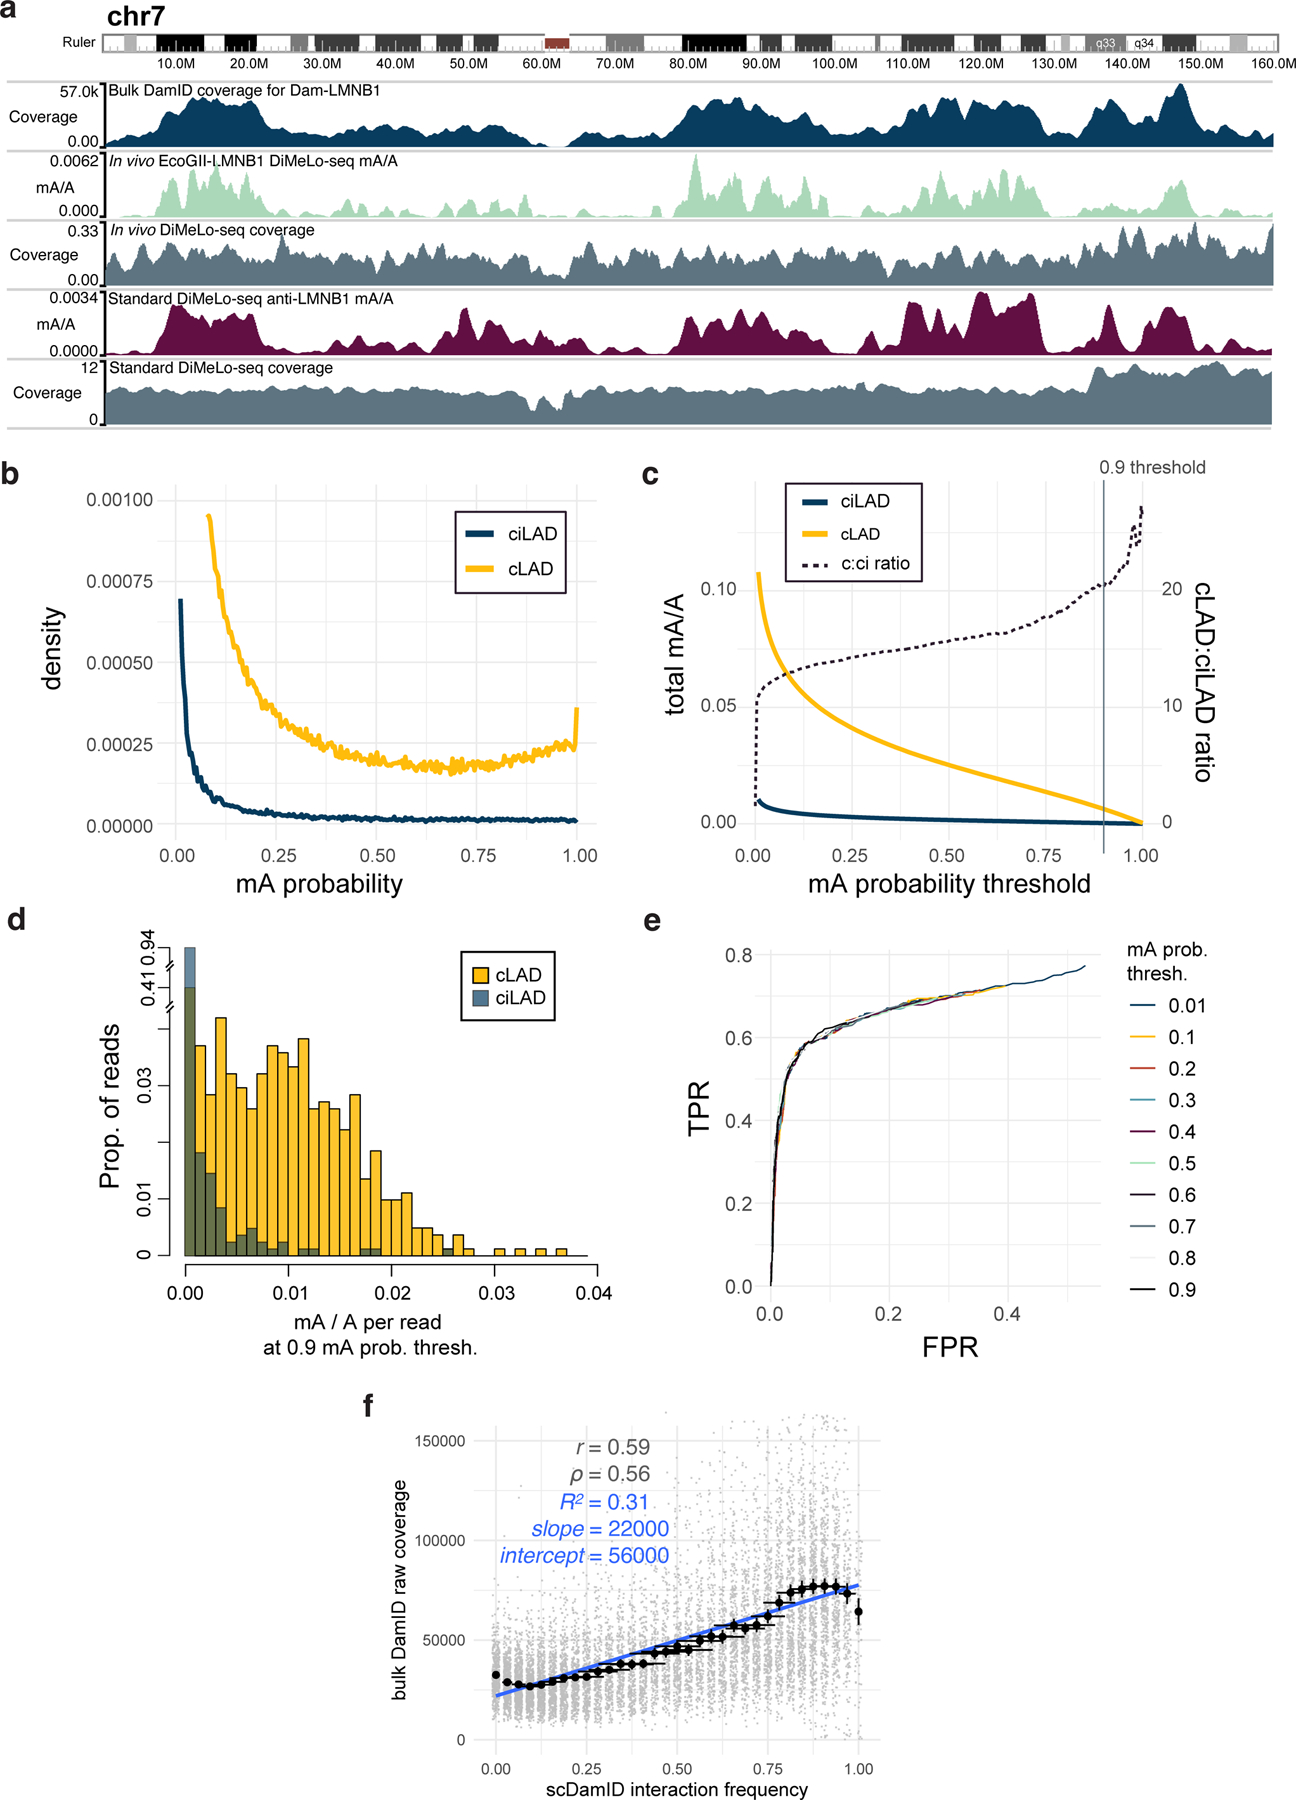
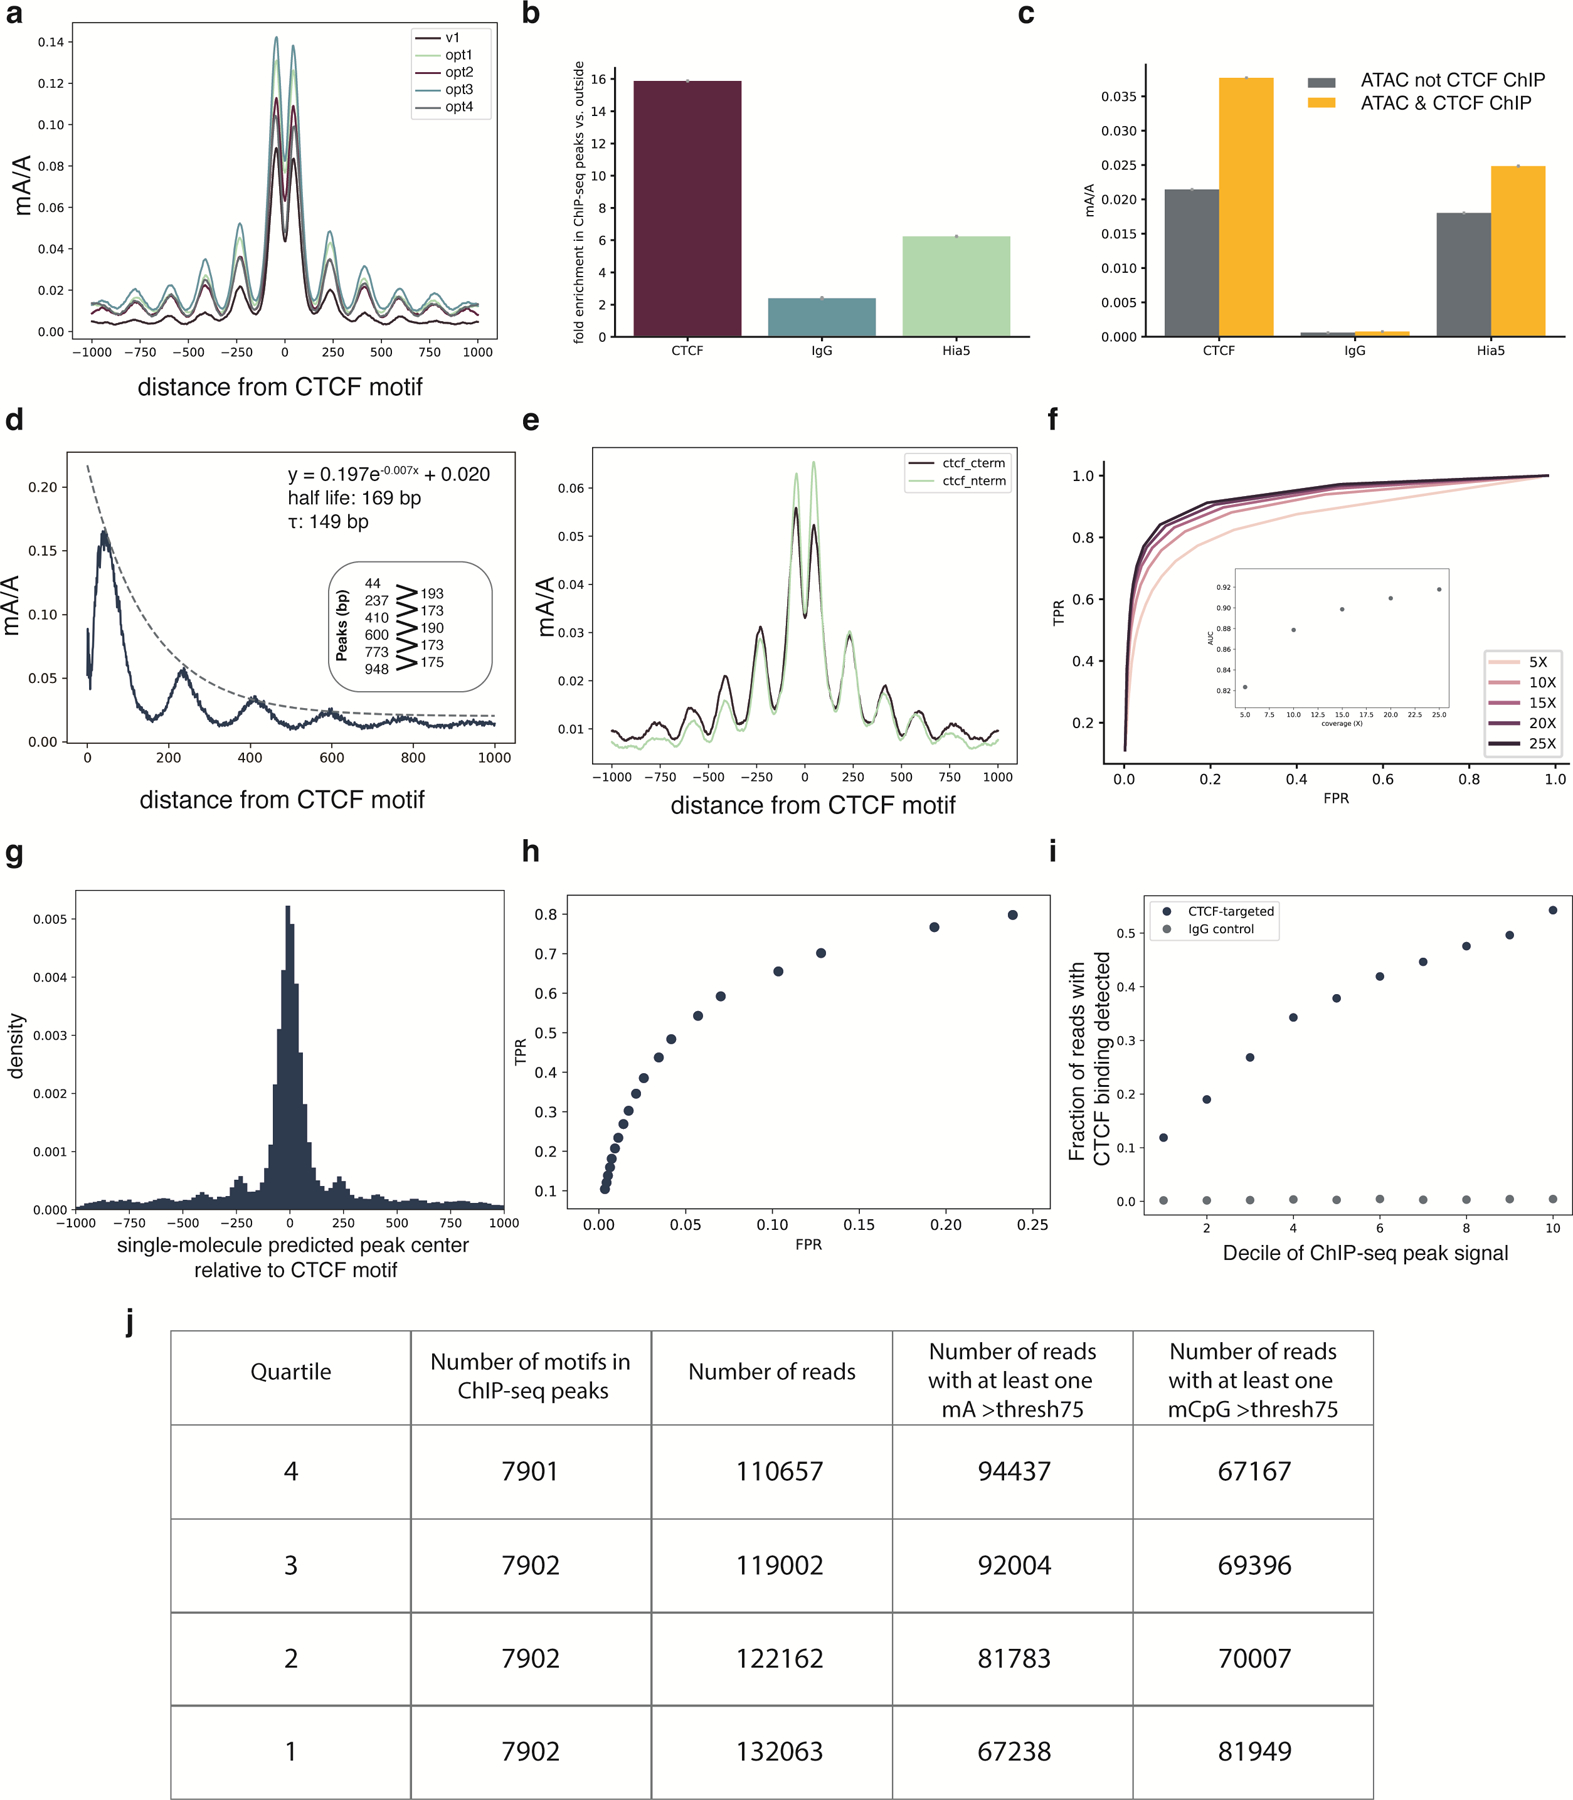
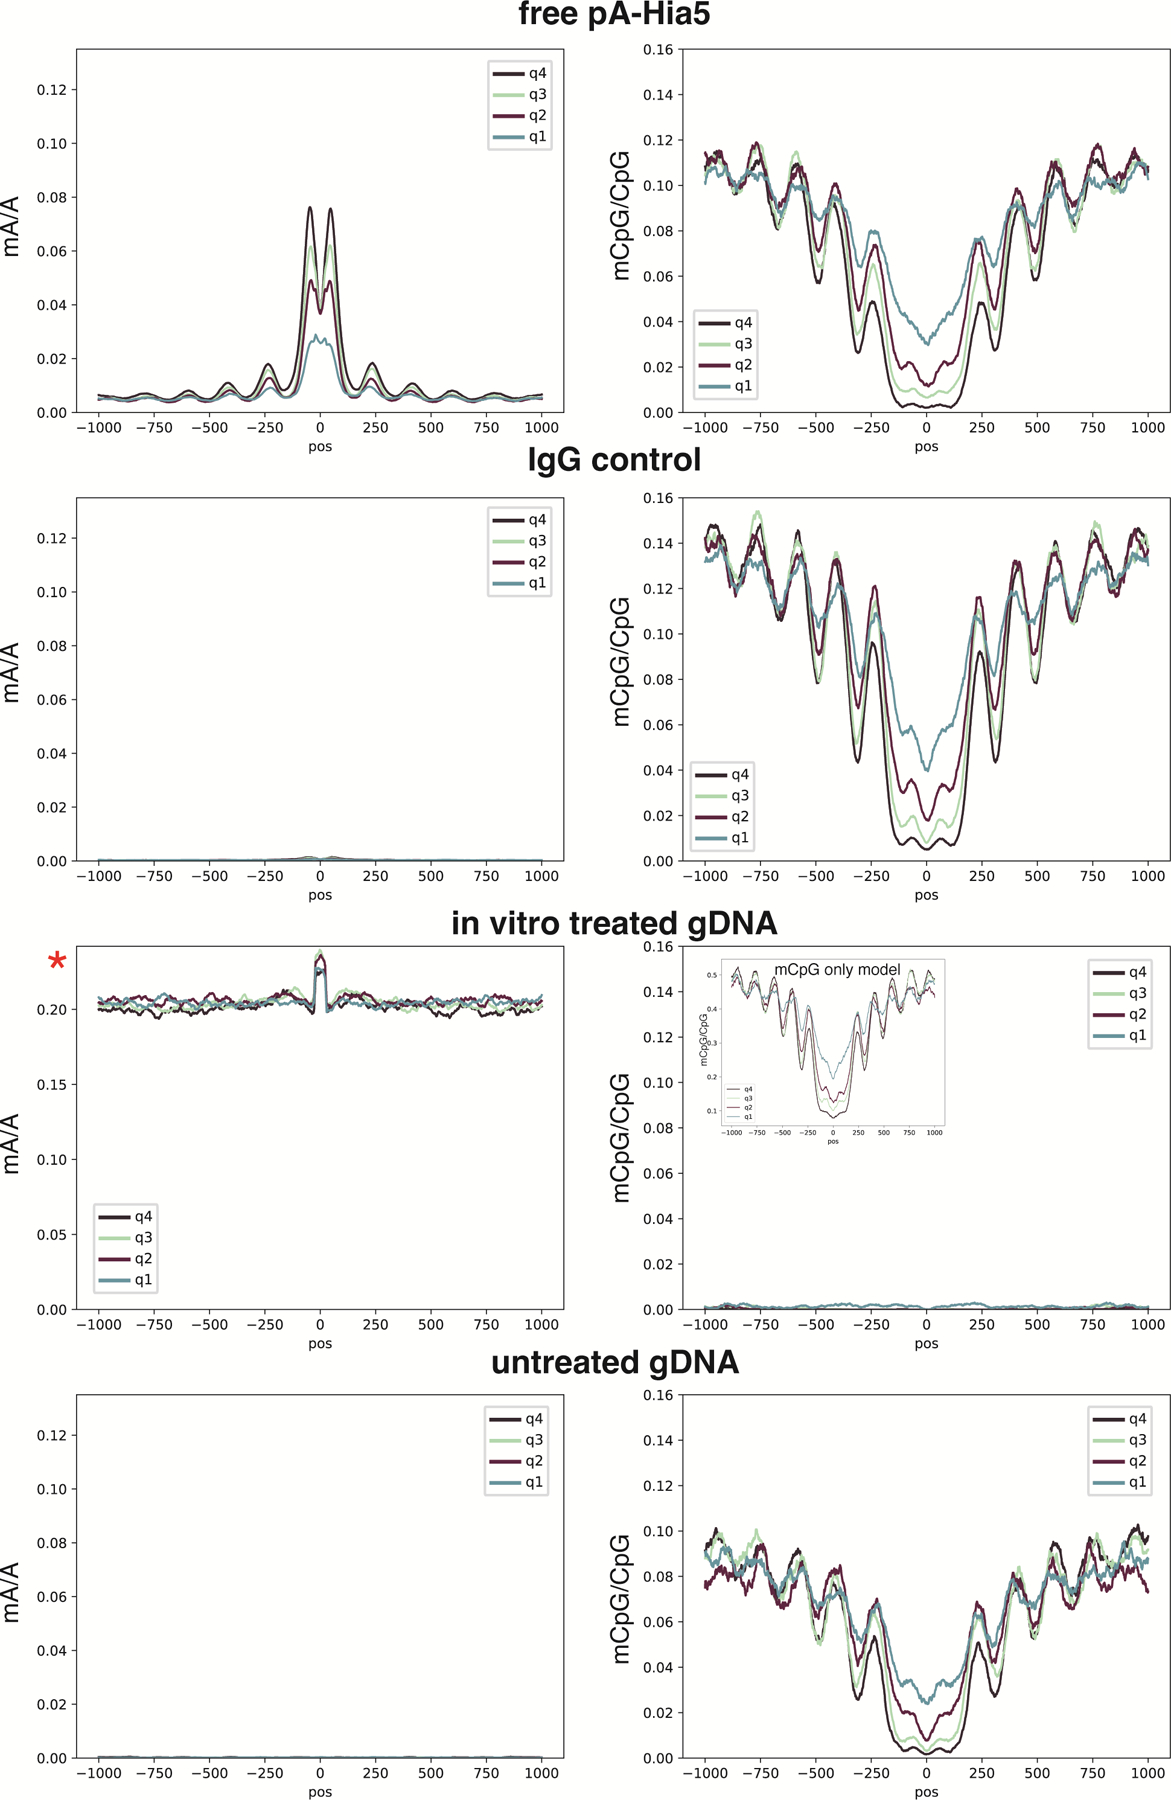
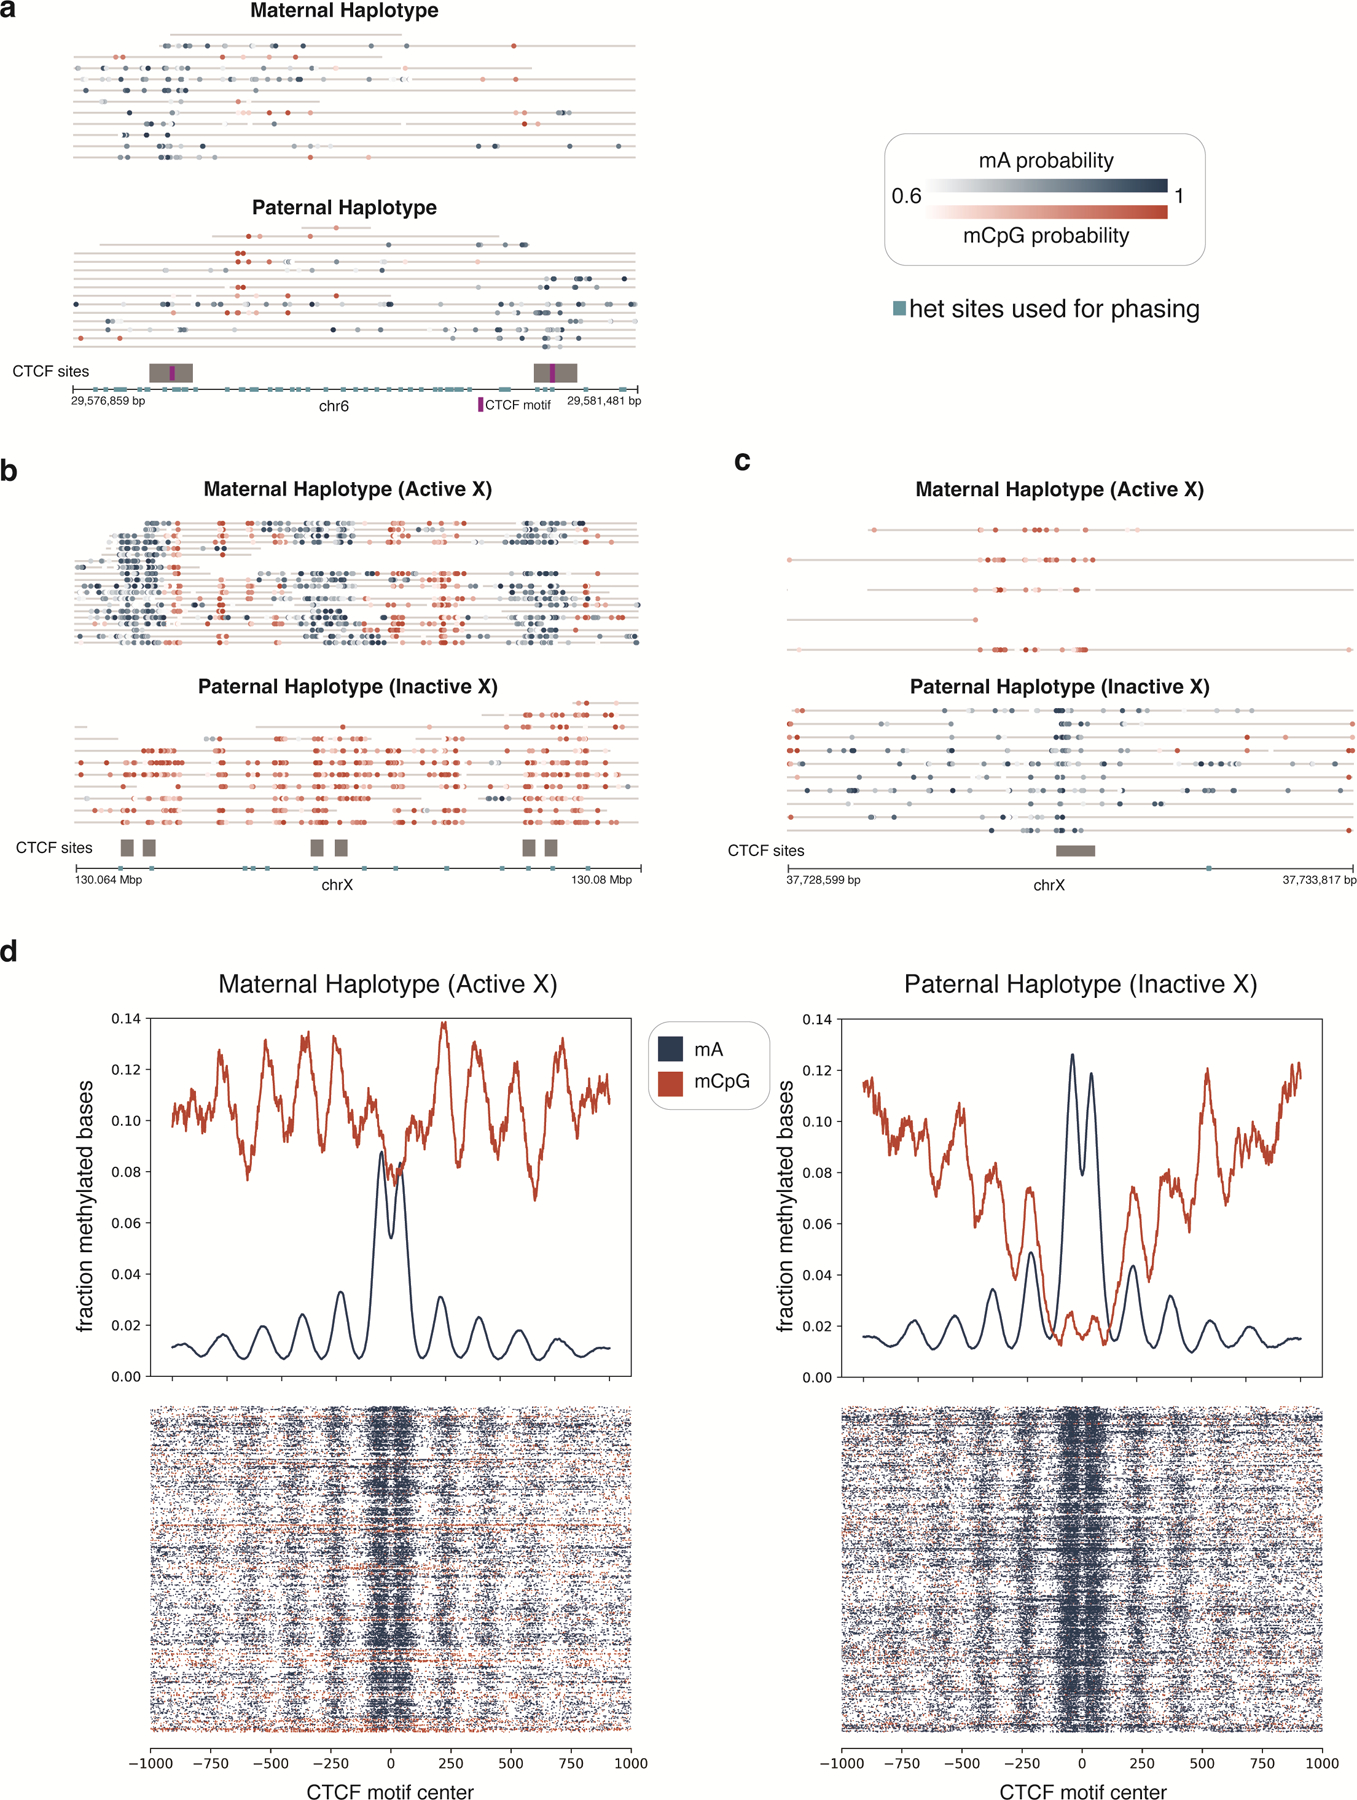
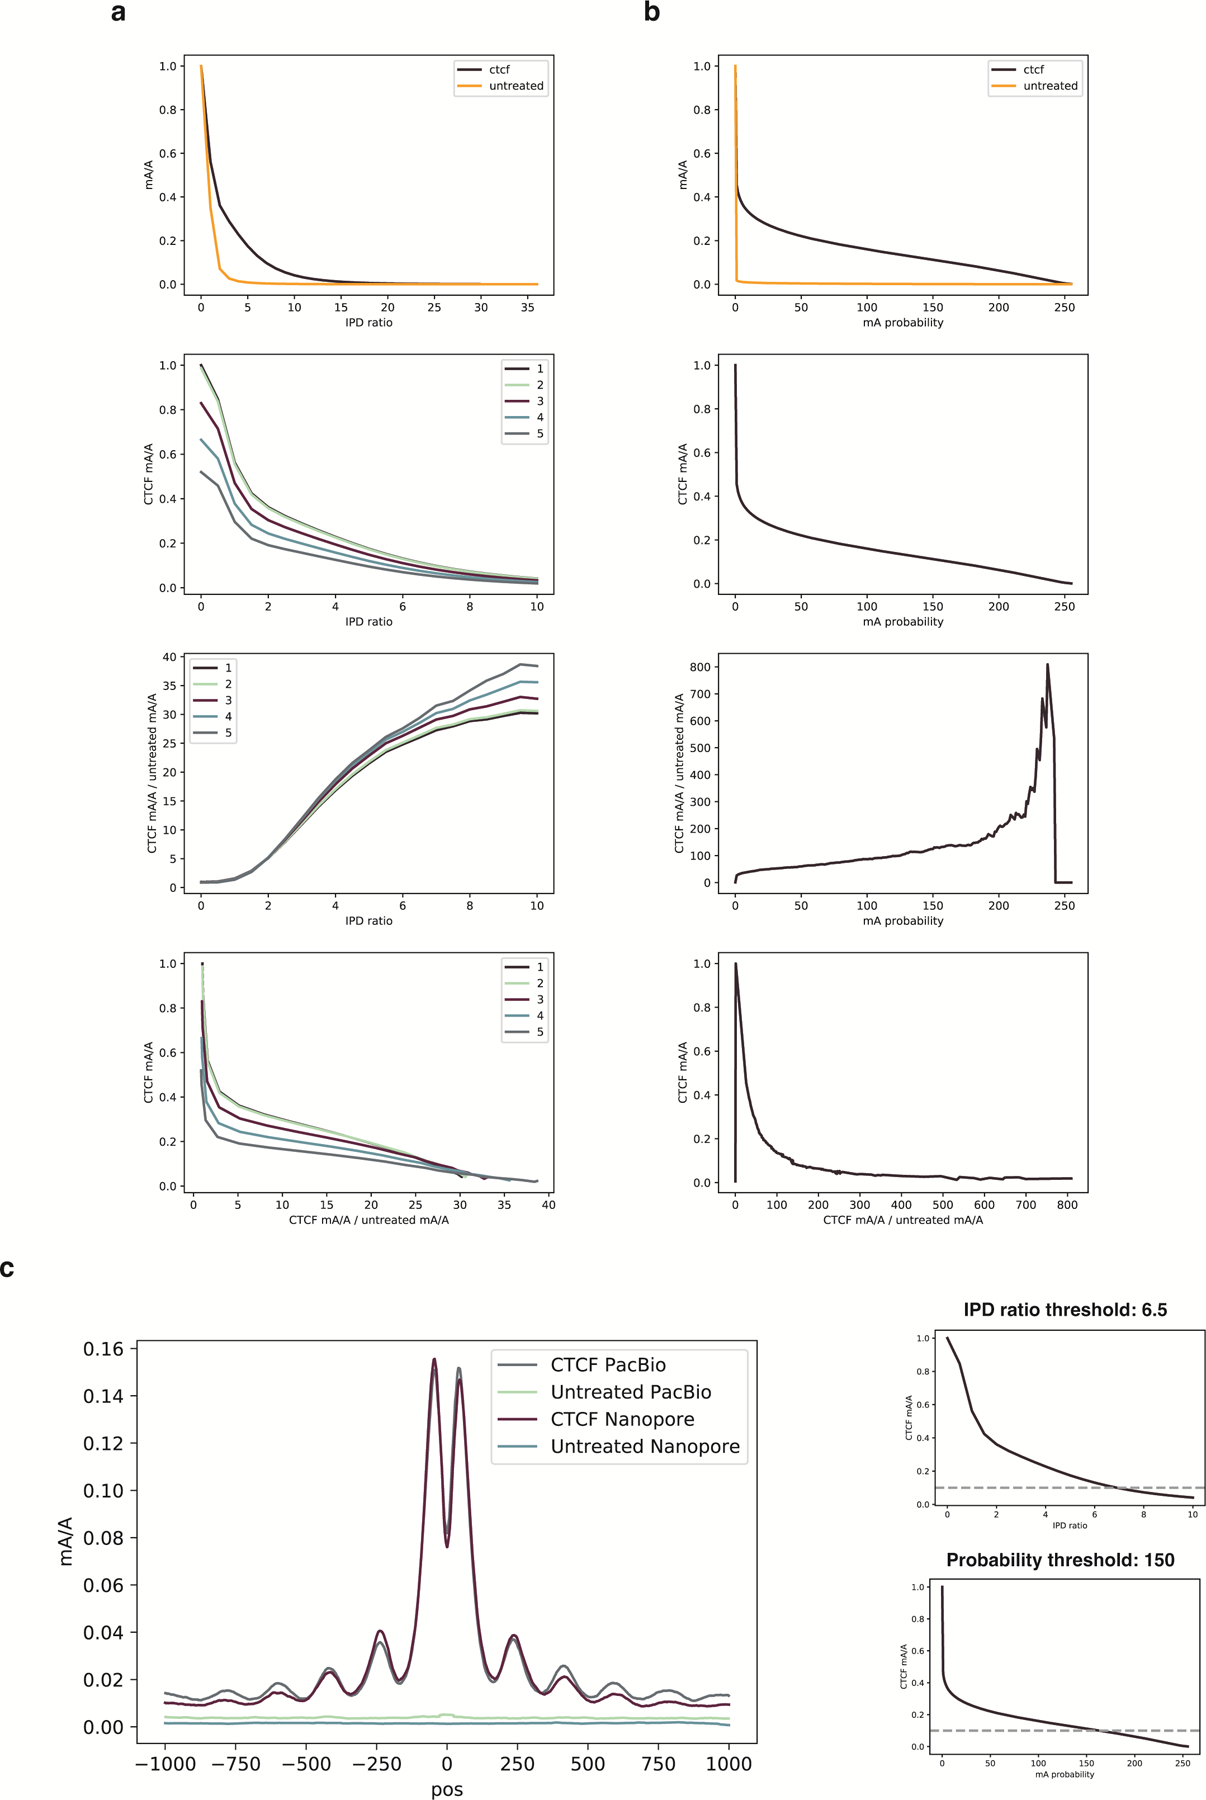
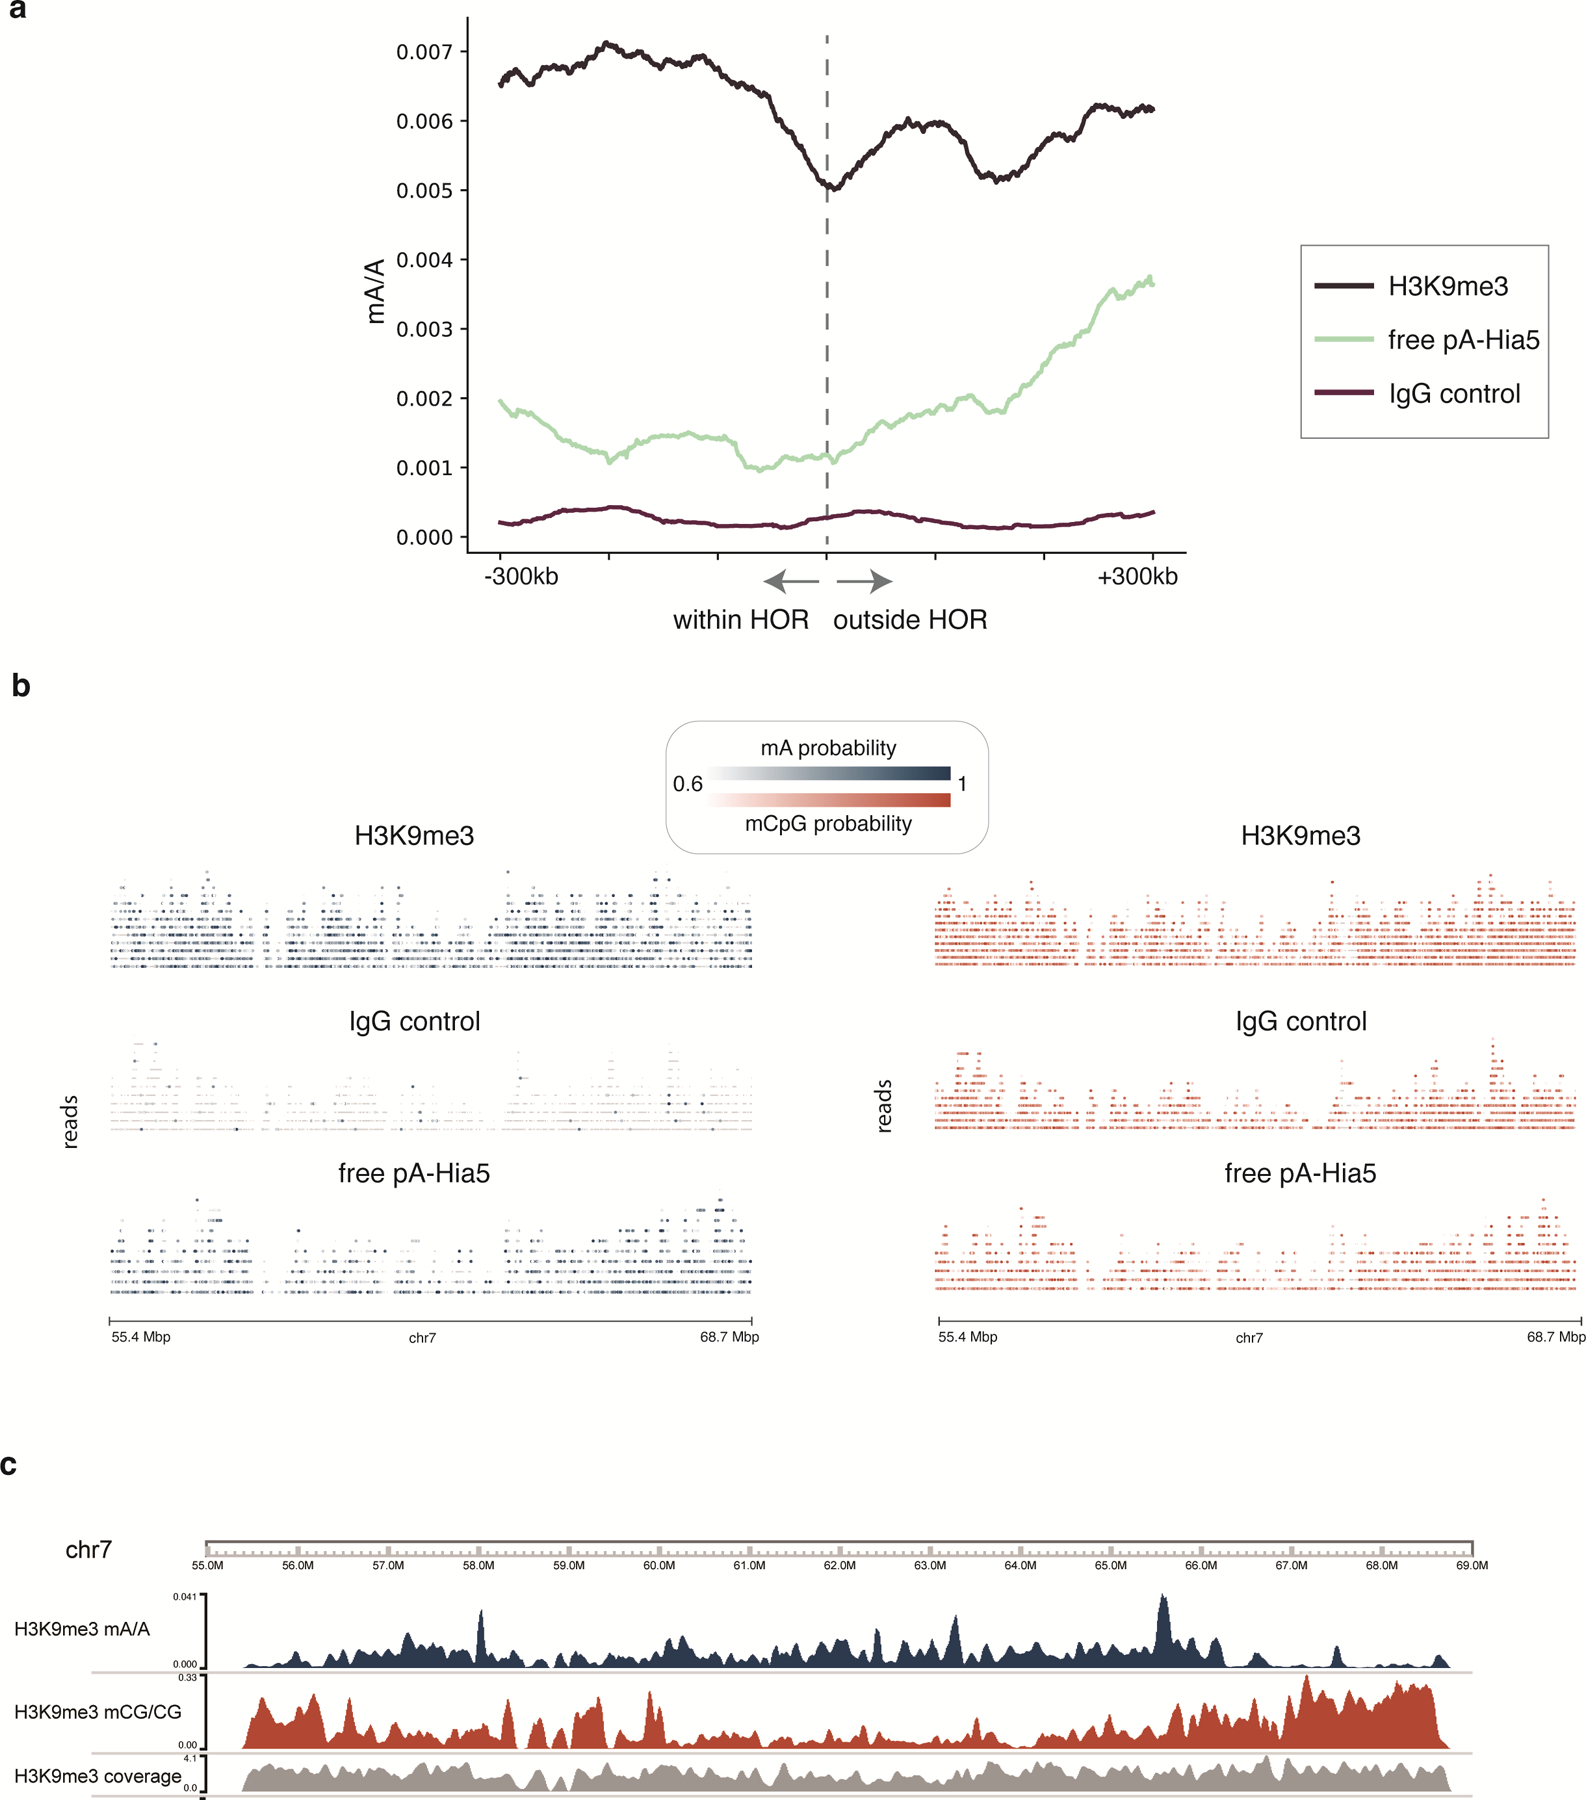
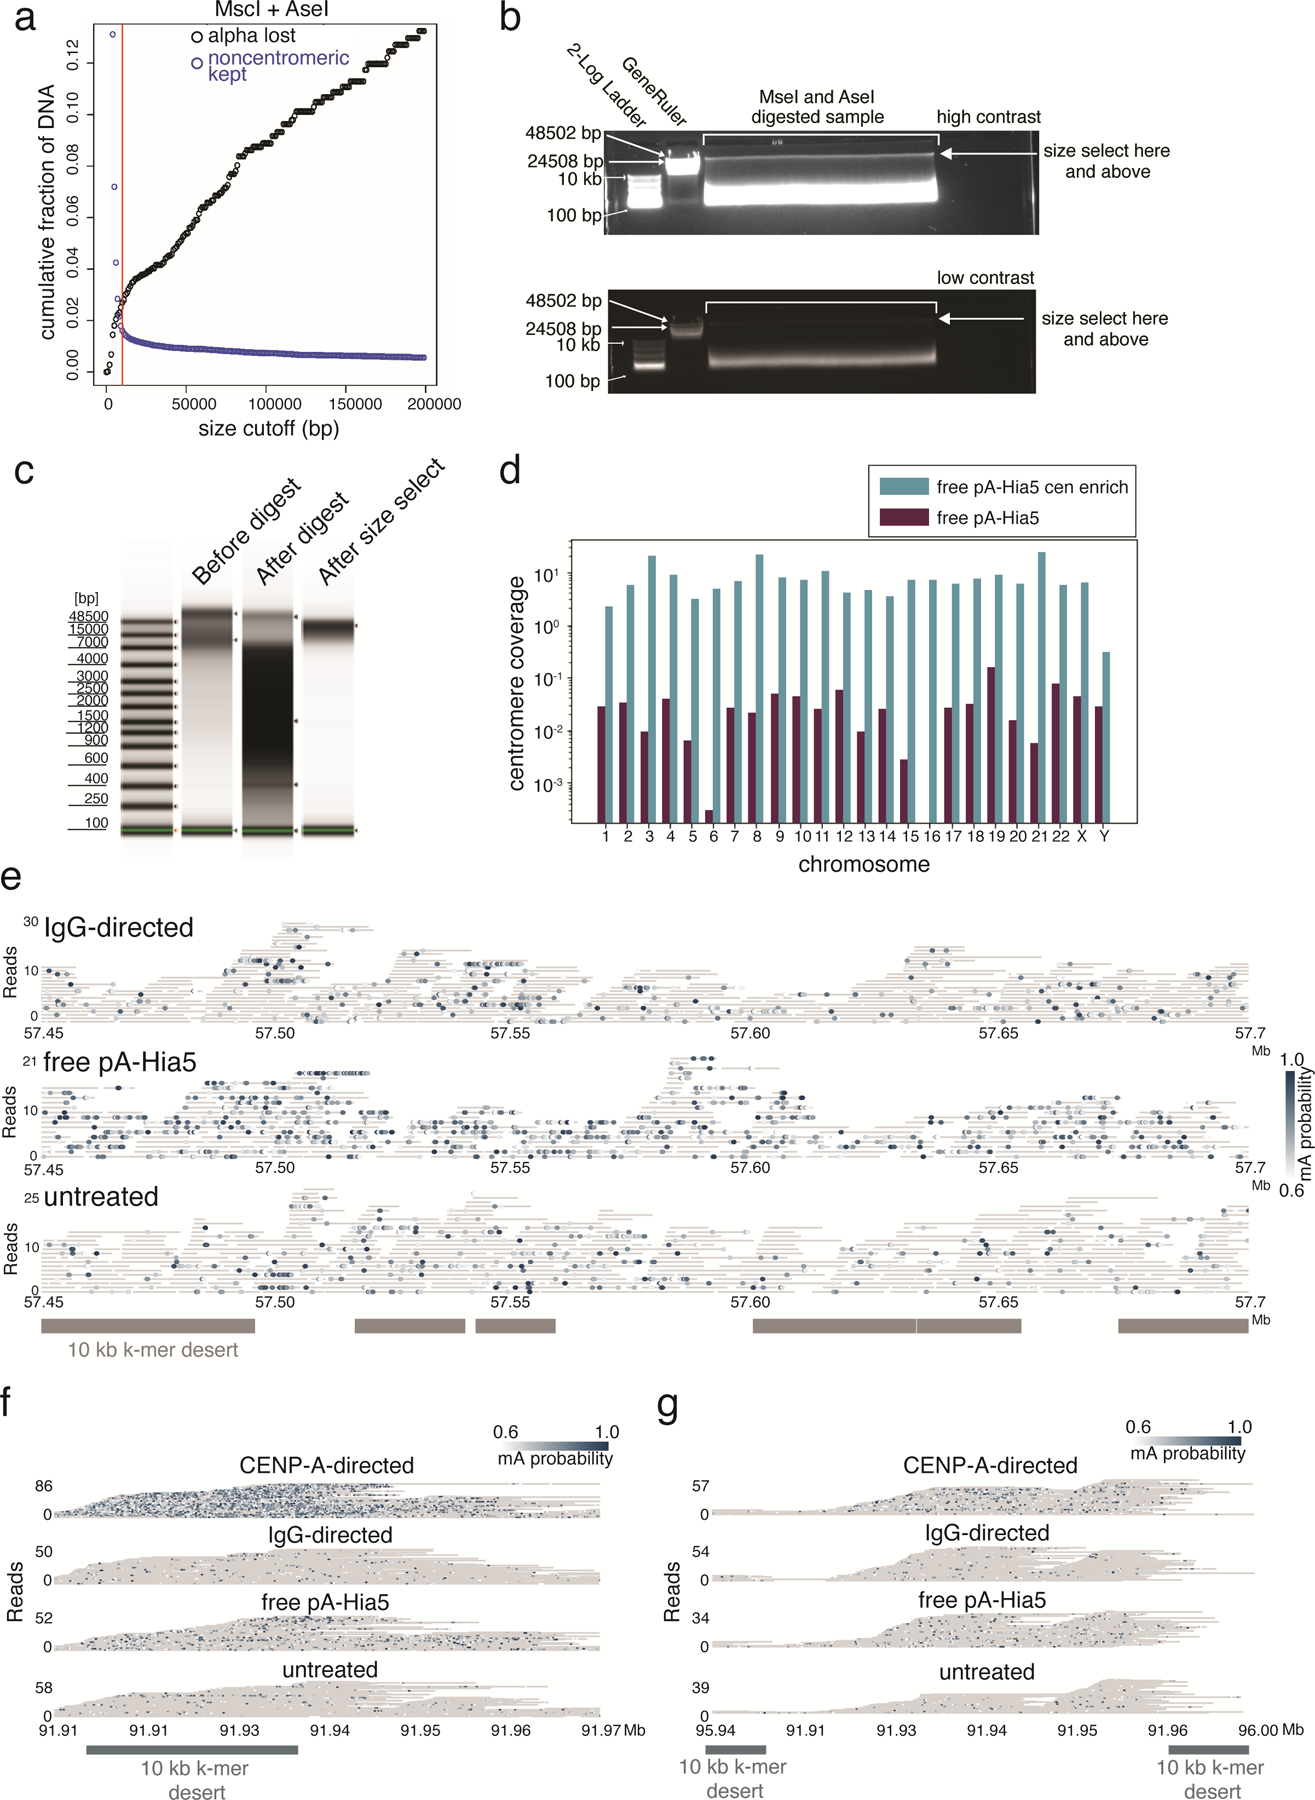
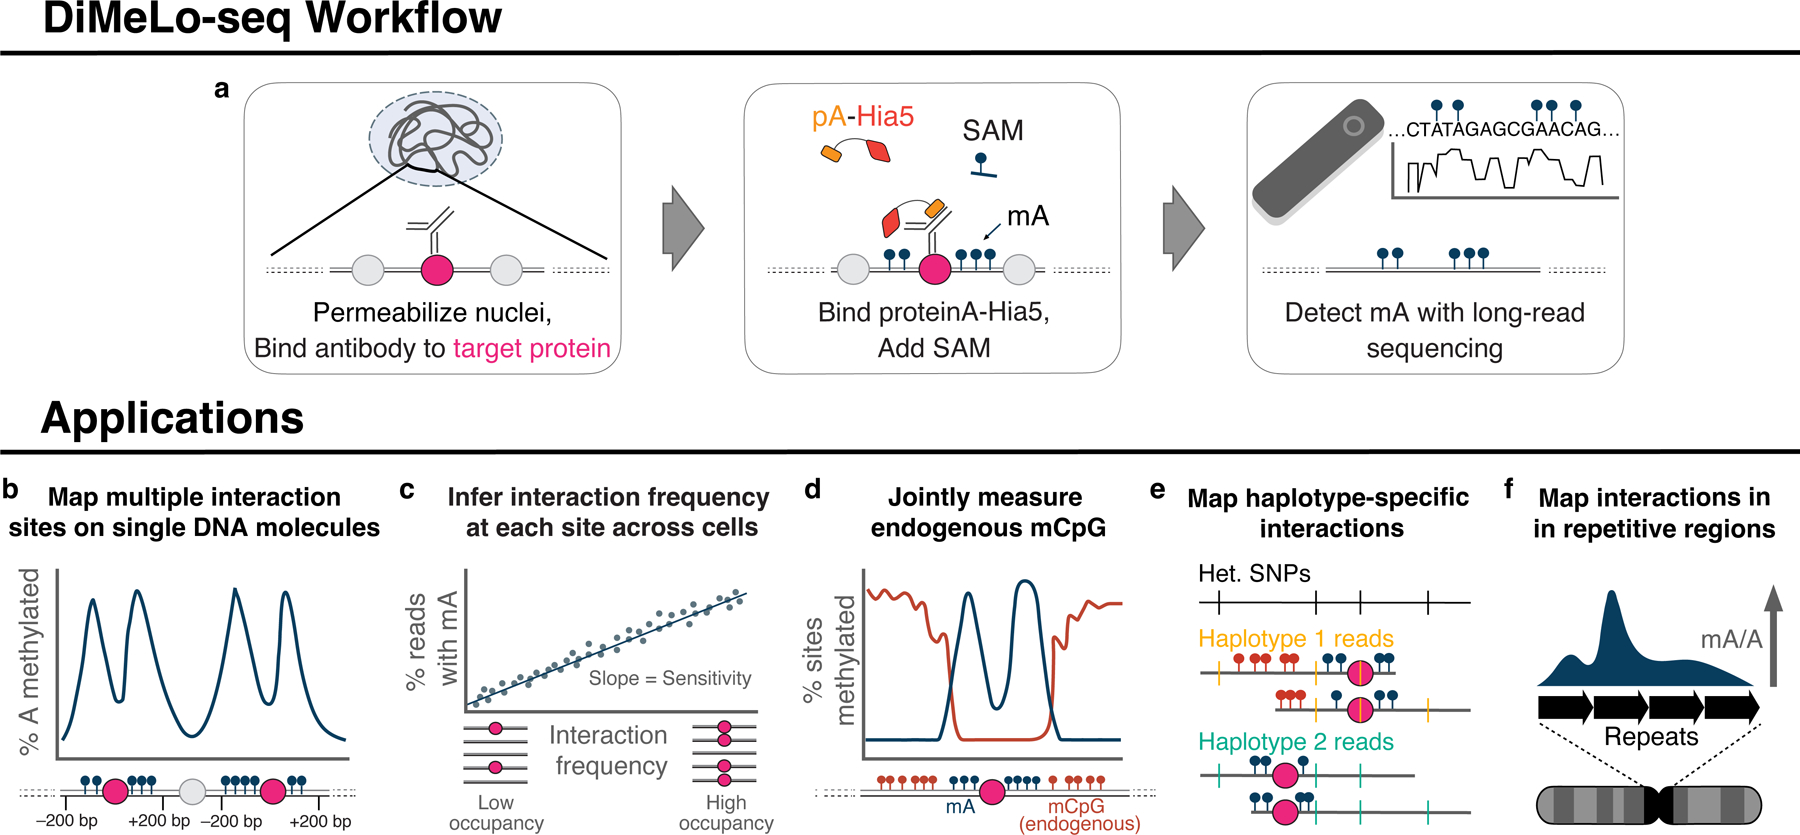
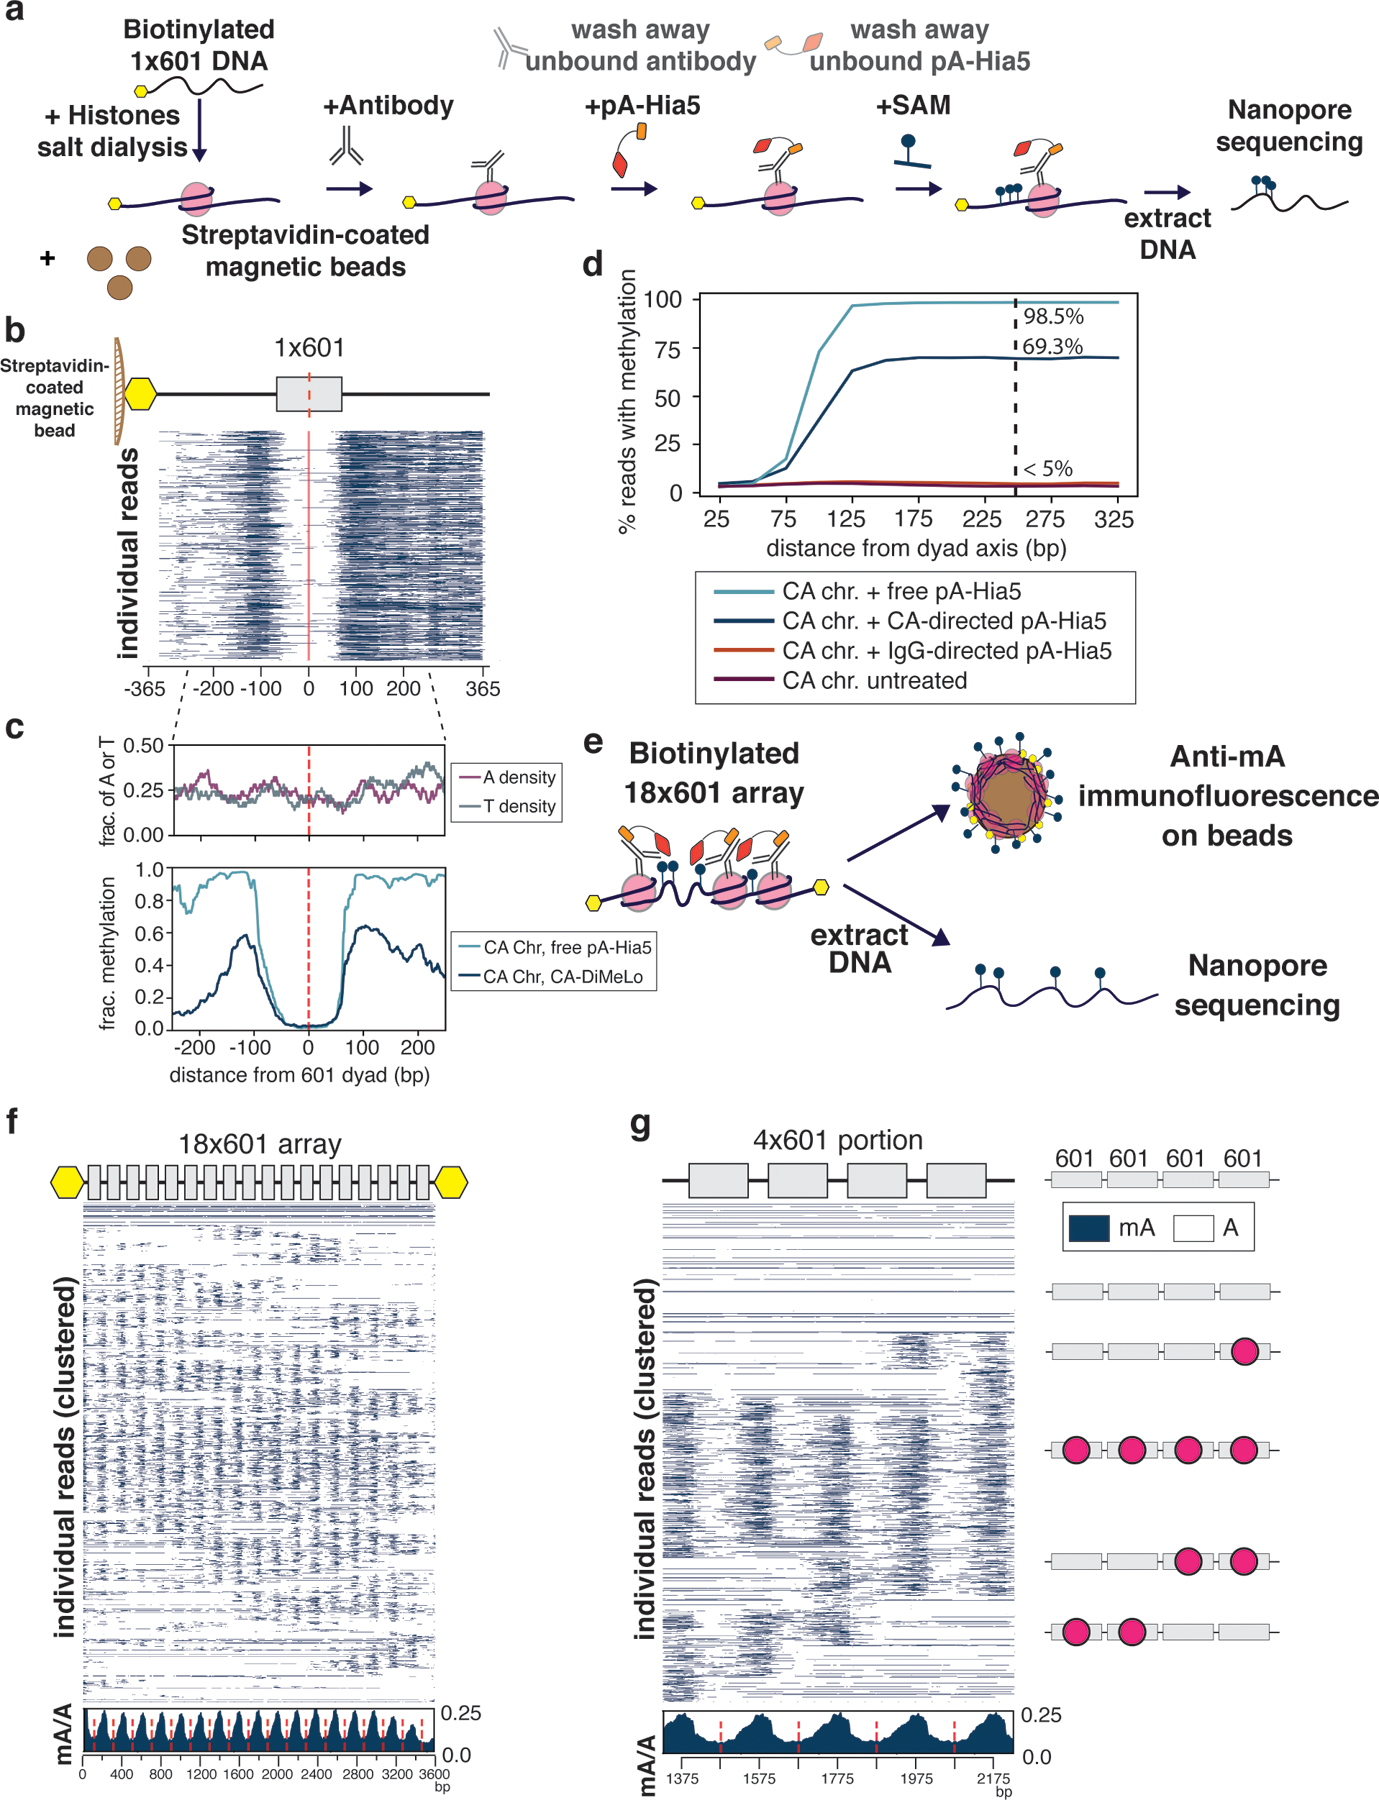
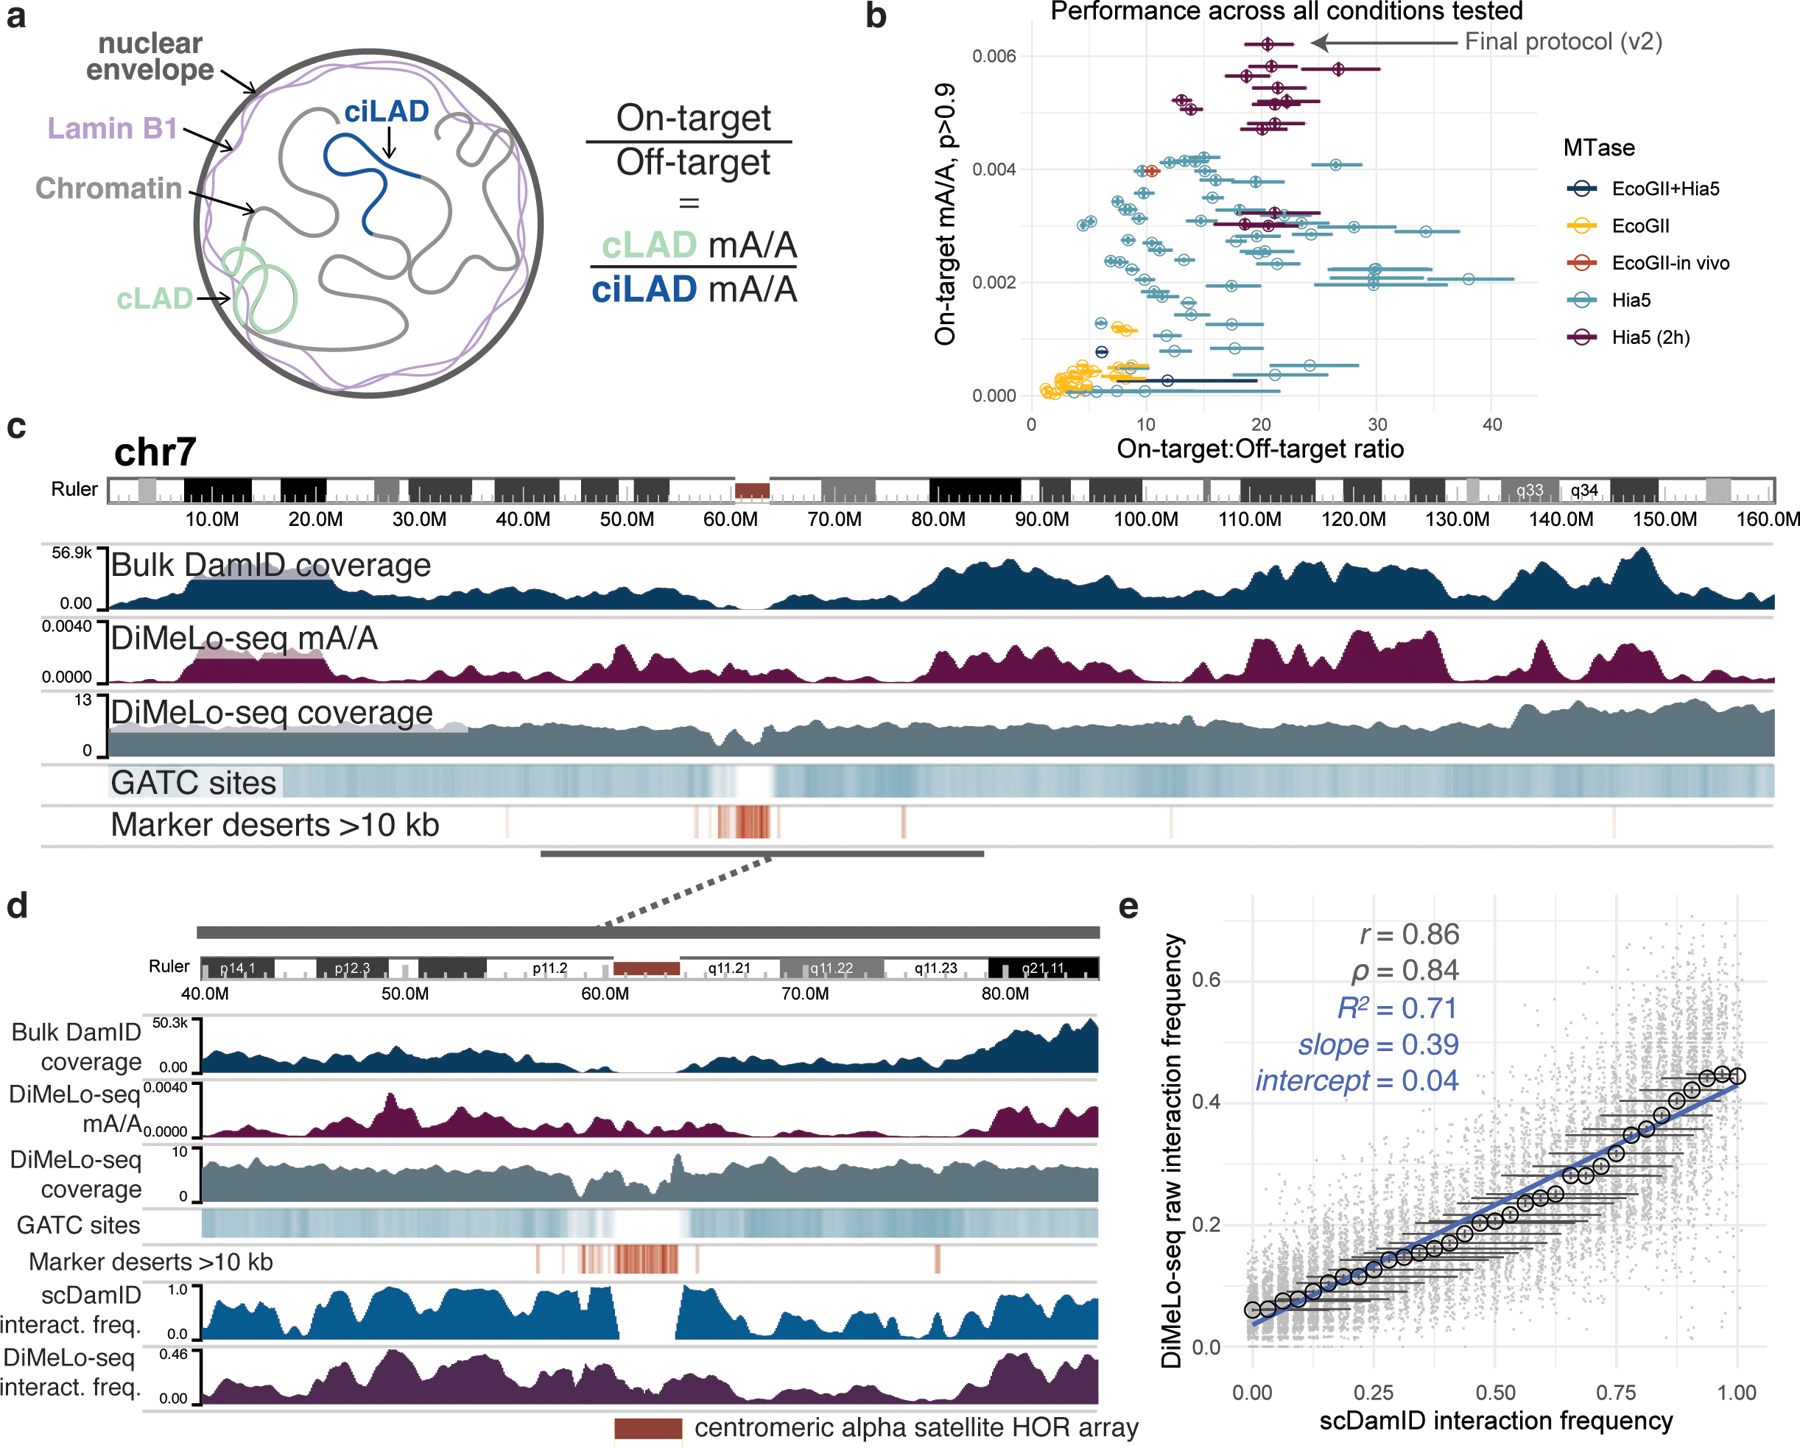
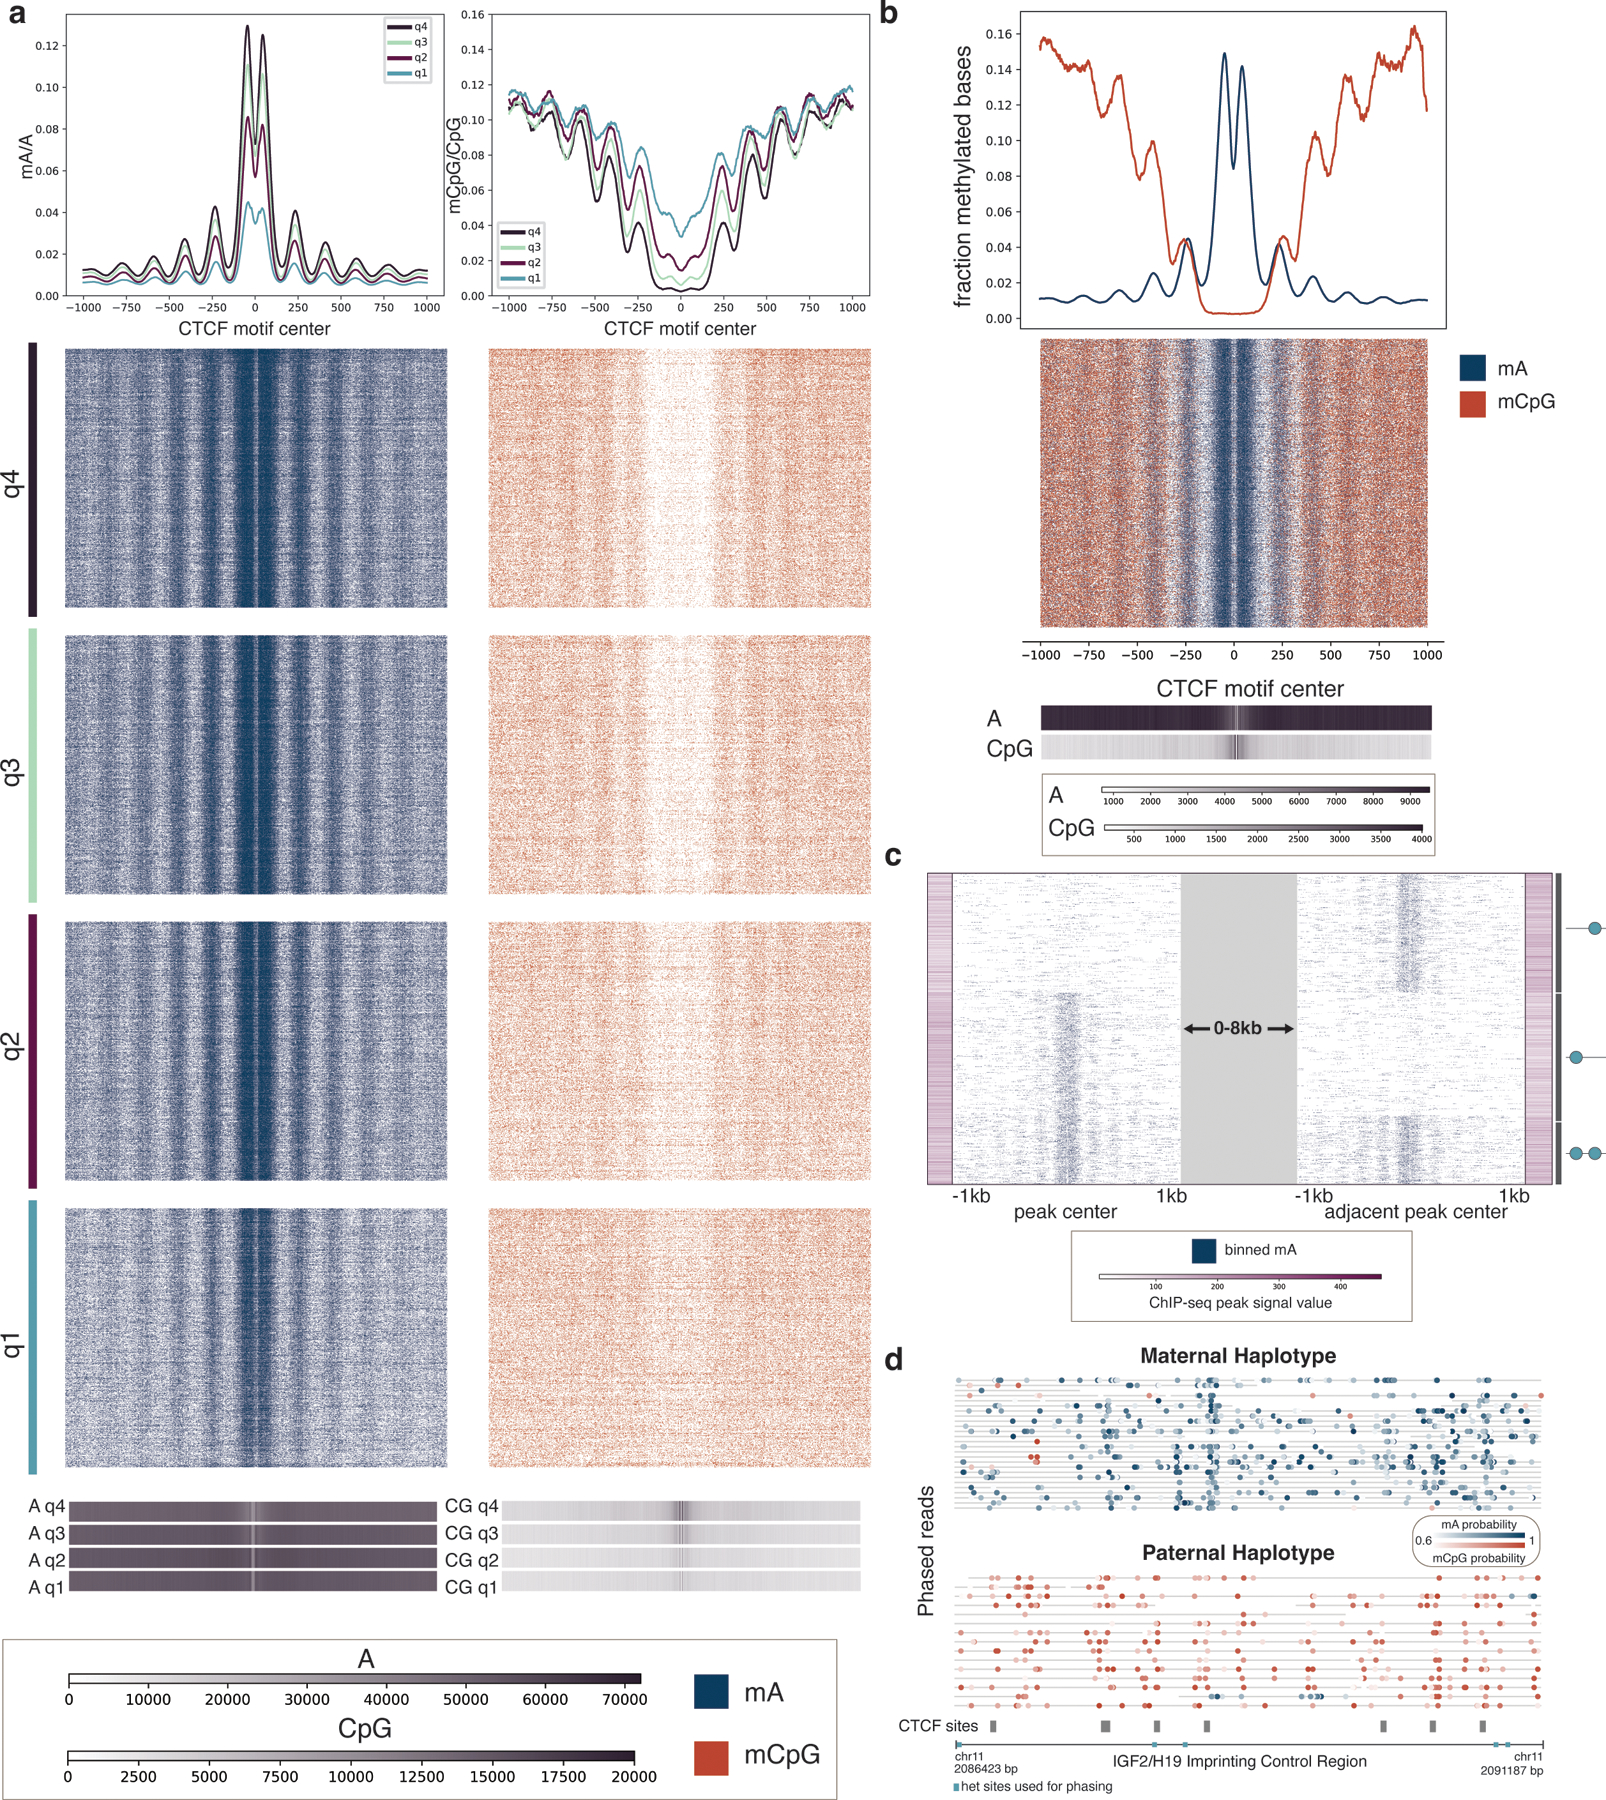
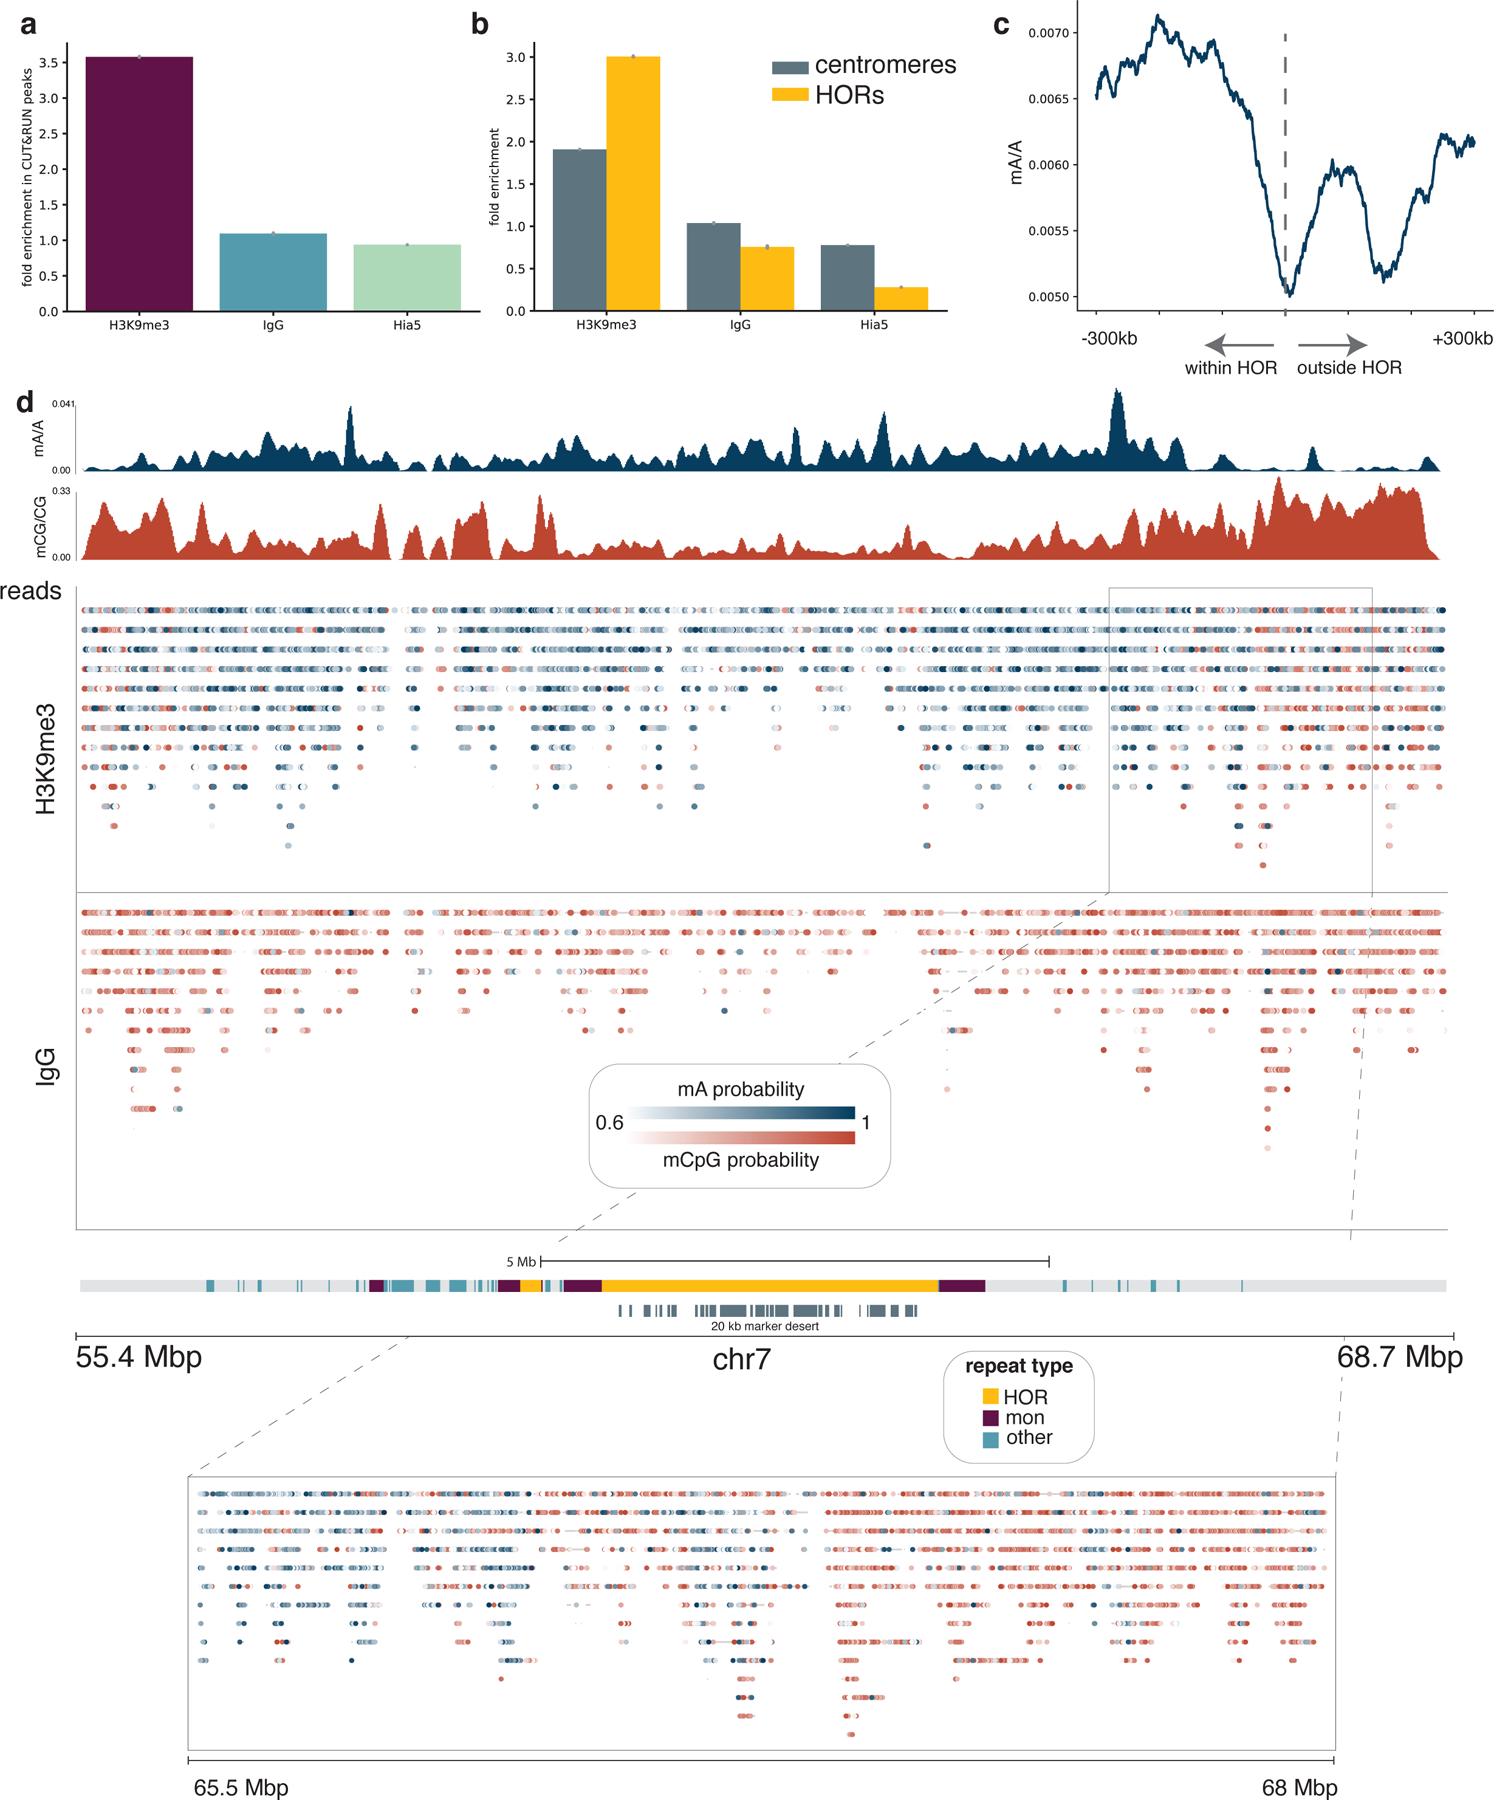
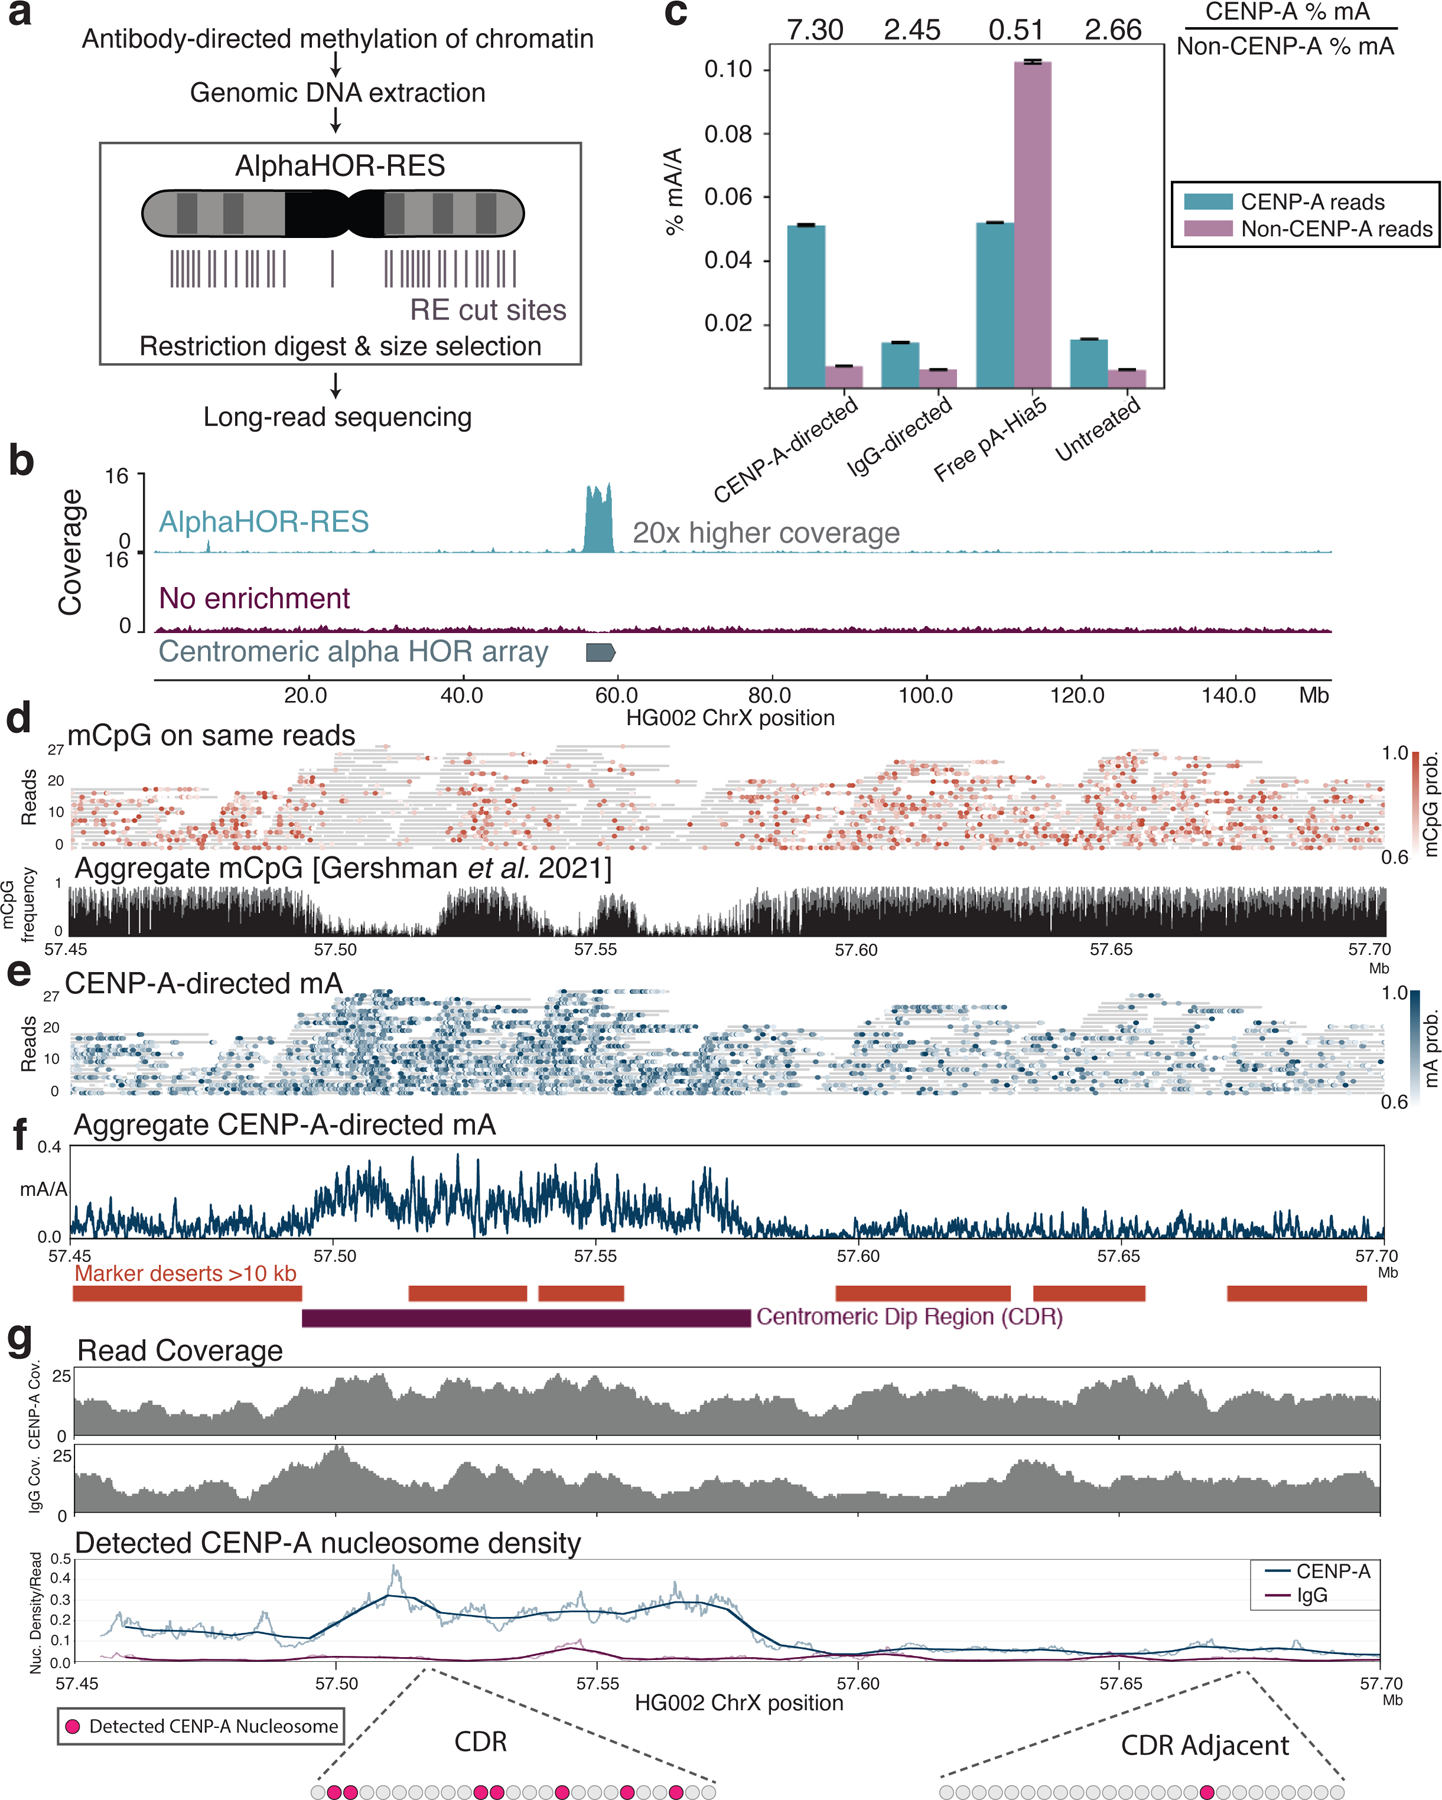
Studies of genome regulation routinely use high-throughput DNA sequencing approaches to determine where specific proteins interact with DNA, and they rely on DNA amplification and short-read sequencing, limiting their quantitative application in complex genomic regions. To address these limitations, we developed directed methylation with long-read sequencing (DiMeLo-seq), which uses antibody-tethered enzymes to methylate DNA near a target protein's binding sites in situ. These exogenous methylation marks are then detected simultaneously with endogenous CpG methylation on unamplified DNA using long-read, single-molecule sequencing technologies. We optimized and benchmarked DiMeLo-seq by mapping chromatin-binding proteins and histone modifications across the human genome. Furthermore, we identified where centromere protein A localizes within highly repetitive regions that were unmappable with short sequencing reads, and we estimated the density of centromere protein A molecules along single chromatin fibers. DiMeLo-seq is a versatile method that provides multimodal, genome-wide information for investigating protein-DNA interactions.


Conflict of interest statement

Competing Interests Statement

NA, AM, OKS, KS, AFS, and AS are co-inventors on a patent application related to this work. The remaining authors declare no competing interests.

Figures

Extended Data Fig. 1
Extended Data Fig. 1. In vitro assessment of methylation of DNA and chromatin by pA-Hia5 and pAG-Hia5
a,b, Agarose gel electrophoresis image of DpnI digestion of (unmethylated) plasmid DNA following incubation with Hia5, pA-Hia5 (a), or pAG-Hia5 (b) (Supplementary Note 1). Representative images of at least 2 replicates. c, Schematic of 1×601 DNA sequence. Grey box indicates 601 sequence, Yellow hexagon indicates end with biotin. d, Native polyacrylamide gel electrophoresis of naked 1×601 DNA or chromatinized 1×601 DNA before and after BsiWI digestion and glycerol gradient fractionation. Representative image of at least 2 replicates. e, Histogram (filled bars, left axis) and cumulative distribution (line traces, right axis) of fraction of methylation (mA/A) on reads from CENP-A 1×601 chromatin methylated with free pA-Hia5, CENP-A-directed pA-Hia5, IgG-directed pA-Hia5, or untreated. Left y-axis is truncated at 20 for better visualization. f, Plot showing percentage false discovery rate plotted against binned minimum mA probability score (Supplementary Note 4). Dotted lines indicates threshold - 0.6, 5% FDR. g,h, Receiver Operator Characteristic (ROC) curves comparing fraction of methylated reads from 1×601 CENP-A chromatin after CENP-A-directed methylation (True Positive Rate) to IgG-directed methylation (g) or no treatment (h) (False Positive Rate). Areas under the curves (AUC) for the ROC curves range between 0.92 and 0.94 for (g), and between 0.92 and 0.95 for (h). i, Schematic of methylation of accessible DNA on 1×601 CENP-A chromatin co-incubated with free pA-Hia5 and SAM. j, Heatmap showing methylation on 5000 individual reads from CENP-A chromatin following incubation with free pA-Hia5. Blue indicates methylation above threshold (0.6). k, Line plot showing percentage of reads with methylation as a function of the minimum percentage of methylation on each read. (methylation threshold - 0.6). Dotted line corresponds to methylation on at least 20% of each read (used in figure 2d).
Extended Data Fig. 2
Extended Data Fig. 2. In vitro assessment of methylation of 18×601 array chromatin by pA-Hia5 and pAG-Hia5
a, Schematic showing the location of 601 sequences (grey boxes) and AvaI digestion sites (dashed line) in between 601 sequences on the 18×601 array. Yellow hexagons indicate biotinylation. b, Schematic of methylation of 18×601 chromatin reconstitution, incubation with free pA-Hia5 and SAM, and long-read sequencing of methylated DNA extracted from chromatin. c, Native polyacrylamide gel electrophoresis showing AvaI digested naked 18×601 array DNA or 18×601 chromatin array reconstituted with CENP-A or H3 (Supplementary Note 2). Representative gel image of at least 3 replicates. d, Representative immunofluorescence images of chromatin-coated beads following methylation using CENP-A-directed pA-Hia5. Scale bar - 3 microns. e, Violin plots of immunofluorescence signal on (denatured) chromatin-coated beads following antibody-directed methylation. Solid line - median, dashed line - quartiles. n > 90 beads/condition. (Supplementary Note 5) f, Histogram (filled bars, left axis) and cumulative distribution (line traces, right axis) of fraction of methylation (mA/A) on reads from CENP-A or H3 chromatin methylated with free pA-Hia5 or CENP-A-directed pA-Hia5. Left y-axis is truncated at 20 for better visualization. g,h, Heatmap showing methylation on 2000 individual reads from CENP-A chromatin methylation with free pA-Hia5, clustered over the entire 18×601 array (g) or a subset 4×601 region (Supplementary Note 4) along with cartoons depicting predicted nucleosome positions (red circles) (h). Insets below heatmaps show average mA/A on every base position of 18×601 array or 4×601 portion. (red dashed line indicates 601 dyad position). i, Violin plot of nucleosomes detected per read on reads from CENP-A or H3 18×601 chromatin array methylated with free pA-Hia5, or CENP-A-directed pA-Hia5. Solid line - median, dashed lines - quartiles. n = 3000 reads. Statistical significance was calculated using Kruskal-Wallis test. *** - P-value < 0.0001 ns - P-value > 0.05. j, Histogram (filled bars, left axis) and cumulative distribution (line traces, right axis) of fraction of methylation (mA/A) on reads from CENP-A or H3 chromatin methylated with free pA-Hia5 or CENP-A-directed pA-Hia5. Left y-axis is truncated at 20 for better visualization. K,l, Same as g,h, but corresponding to H3 chromatin methylation with H3-directed pAG-Hia5.
Extended Data Fig. 3
Extended Data Fig. 3. Assessment of mA calling and LMNB1 targeting
a, The proportion of all adenines called as methylated at each possible probability mA probability score using two different software packages on ONT reads from two GM12878 DNA samples: untreated genomic DNA and purified genomic DNA methylated by Hia5 in vitro. The untreated DNA provides a measure of the false positive rate (FPR) at each score, since it contains few or no methyl adenines. The Hia-5 treated DNA provides a lower bound on the true positive rate (TPR) at each threshold. b, Estimates of the proportion of As methylated in the Hia5-treated DNA sample at each false discovery rate (FDR) threshold (FDR=FPR/(TPR+FPR), determined from a). At least 80% of the adenines on the Hia5-treated DNA appear to be methylated. c-d, In the DiMeLo-seq workflow, following the primary antibody and pA/G-MTase binding and wash steps, a sample of nuclei can be taken for quality assessment by immunofluorescence. One can determine the locations and relative quantity of pA/G-MTase molecules using fluorophore-conjugated antibodies that bind to the pA/G-MTase but not to the primary antibody. In these representative images, the results for pAG-EcoGII are shown, comparing different antibodies, detergents, and samples with (d) and without (c) the use of an unconjugated secondary antibody to recruit more pA/G-MTase molecules to the target protein. Scale bars representing 10 microns are shown in the FITC channel images as white lines.
Extended Data Fig. 4
Extended Data Fig. 4. Demonstration of in vivo LMNB1-targeting and estimation of in situ sensitivity and specificity
a, A browser view of chr7 comparing in vivo EcoGII-LMNB1 DamID (second track, green) to conventional LMNB1 in vivo DamID (first track, blue), and to LMNB1-targeted in situ DiMeLo-seq (fourth track, dark red). b, For an in situ LMNB1-targeting experiment using the final v2 protocol (#120 in Supplementary Table 1), the distributions of guppy mA probability scores across all A bases (q>10) on all reads mapping to cLADs (gold, representing on-target methylation; n = 2.8M) or ciLADs (blue, representing off-target methylation; n = 2.1M). c, As in b, but showing the cumulative distributions for all mA calls above each probability score threshold, with the ratio between these plotted as a dotted line (using the right-hand y-axis). Vertical line indicates the stringent threshold of 0.9, at which cLADs have 20 times more mA as a proportion of all As (0.6%) than do ciLADs. If the threshold is reduced to 0.5, the fraction of As called as methylated increases to 2.5% but the cLAD:ciLAD ratio decreases to 15.6. d, On a per-read basis, for all reads with at least 500 A basecalls (q>10) and using a mA probability threshold of 0.9, the distribution of mA/A called on each read for cLADs (n = 812 reads) vs. ciLADs (n = 827 reads). e, Receiver-Operator Characteristic (ROC) curve showing, for different mA calling thresholds, the ability to classify individual reads from (d) as originating from cLADs or ciLADs using a simple linear threshold on mA/A. At a false positive rate of 6%, reads can be classified with a true positive rate of 59%, and this is similar for all mA thresholds used. The total Area Under the Curve (AUC) for the p>0.9 curve is 0.78. f, As in Fig. 3e, but for bulk conventional DamID raw coverage. The y axis is truncated to omit outliers for visualization (max = 300000), but these were not omitted for linear model and correlation computation. Error bars in x represent the proportion of 32 cells +/− 2 standard errors of the proportion. Error bars in y represent the mean of n = 94 to 663 genomic bins +/− 2 standard errors of the mean.
Extended Data Fig. 5
Extended Data Fig. 5. Analysis of CTCF targeting performance
a, Enrichment profiles with mA probability threshold of 0.75 at the top quartile of ChIP-seq peaks for the DiMeLo-seq protocol v1 compared to four optimization conditions (opt1: 2 hour activation, 0.05 mM spermidine at activation, replenish SAM; opt2: 2 hour activation, 0.05 mM spermidine at activation, replenish SAM, 500 nM pA-Hia5; opt3: 2 hour activation, 0.05 mM spermidine at activation, replenish SAM, pA-Hia5 binding at 4°C for 2 hours; opt4: 2 hour activation, no spermidine, 1 mM Ca++ and 0.5 mM Mg++ buffer) (Supplementary Note 11). b, Fold enrichment over background of mA/A in ChIP-seq peak regions. Error bars represent the 95% credible interval for each ratio of proportions determined by sampling proportions from posterior beta distributions computed with uninformative priors. c, mA/A in ATAC-seq peaks that do not overlap CTCF ChIP-seq peaks (grey) and mA/A in ATAC-seq peaks that do overlap CTCF ChIP-seq peaks (yellow). Error bars are computed as in (b) d, Methylation decay from the CTCF motif center for the top decile of ChIP-seq signal is fit with an exponential decay function. The positions of the peaks are indicated, with the spacing between peaks also noted. e, Methylation profiles at top quartile of ChIP-seq peaks when targeting the C-terminus or N-terminus of CTCF. The difference between antibody binding site produces significantly different profiles (Supplementary Note 11). f, Receiver-Operator Characteristic (ROC) curves from aggregate peak calling with DiMeLo-seq targeting CTCF at 5–25X coverage using ChIP-seq as ground truth. Inset shows Area Under the Curve (AUC) as a function of coverage. g, The distribution of differences between our single-molecule predicted peak center and the known CTCF motif are plotted for single molecules within top decile ChIP-seq peaks. h, ROC curve for binary classification of CTCF-targeted DiMeLo-seq reads to identify CTCF-bound molecules based on each read’s proportion of methylated adenines in peak regions (Supplementary Note 11). At a FPR of 5.7%, a TPR of 54% is achieved. i, Fraction of reads that have a CTCF binding event detected in the peak region for each decile of ChIP-seq peak strength for the CTCF-targeted sample and IgG control. Calculated using thresholds determined from analysis in (h). Error bars do not extend beyond the points themselves so are not shown. j, Number of motifs and reads displayed in Figure 4a.
Extended Data Fig. 6
Extended Data Fig. 6. Control mA and mCpG profiles at CTCF peaks
Profiles at CTCF ChIP-seq peaks for free pA-Hia5, IgG control, in vitro treated genomic DNA, and untreated genomic DNA. Quartiles indicate rank of ChIP-seq peak strength. All axes are the same scaling as in Figure 4a, except for mA/A of in vitro treated gDNA. With high mA levels achieved only with this in vitro methylated control, mC basecalling fails. However, if the Rerio model res_dna_r941_min_modbases_5mC_CpG_v001.cfg is used for calling mCpG separately from mA, the mCpG profile is restored, as seen in the inset for the in vitro treated gDNA sample. Importantly, as indicated by the y-axis scale in the inset, if mCpG is called separately from mA, the detected mCpG levels are higher.
Extended Data Fig. 7
Extended Data Fig. 7. Phased CTCF-targeted DiMeLo-seq reads
Phased reads across one region on chr6 and two regions on chrX illustrate haplotype-specific CTCF binding due to genetic and epigenetic differences between haplotypes. a, A region on chr6 within the human leukocyte antigen (HLA) locus which contains two CTCF binding sites and many heterozygous SNPs useful for phasing reads. Both CTCF binding sites overlap a het SNP within their binding motif. At the first CTCF site, the paternal SNP allele within the motif is associated with weak or no CTCF binding on the paternal haplotype, and the opposite is true at the second CTCF site. Thus, only one of these two neighboring sites tends to be bound on each haplotype, which is clearly visible on reads spanning both CTCF sites. Further, because CpG methylation patterns are similar between the two haplotypes, these binding differences likely owe to the genetic differences present in/near the CTCF binding motifs themselves. b-c, Because the GM12878 cell line has two X chromosomes and was clonally derived, one X homolog (the paternally inherited X homolog for this cell line) has undergone X inactivation and remains inactive in all cells. Shown here are one region with CTCF binding on the active X only (b) and one region with CTCF binding on the inactive X only (c). The haplotype-specific CTCF binding patterns in these chrX regions appear to be associated with haplotype-specific CpG methylation, as similarly seen for the imprinted H19 locus shown in Fig. 4d. d, Aggregate enrichment profiles from DiMeLo-seq reads across all CTCF sites on chrX are shown, as in Fig. 4b. Each row in the heatmaps below the aggregate plots represents a single molecule centered at the CTCF motif. Notable strips of CpG hypermethylated reads are visible on the active X, as observed previously ,.
Extended Data Fig. 8
Extended Data Fig. 8. Comparison of PacBio and Nanopore sequencing platforms for detecting mA from DiMeLo-seq
The same DNA from a DiMeLo-seq experiment targeting CTCF in GM12878 cells was sequenced on both PacBio and Nanopore. The same untreated GM12878 DNA was also sequenced on both platforms. Methylated base calls for reads spanning the top decile of CTCF ChIP-seq peaks are analyzed. a, PacBio data. (i) Fraction of adenines methylated +/− 100 bp (“peak region”) from CTCF motif center as a function of IPD ratio for the CTCF-targeted sample and the untreated control. (ii) Fraction of adenines methylated for CTCF-targeted sample in the peak region for various IPD ratio thresholds and number of pass thresholds (indicated in legend from 1 to 5). (iii) Fraction of adenines methylated in the peak region for CTCF-targeted sample over the fraction for the untreated control as a function of IPD ratio and number of passes (indicated in legend from 1 to 5). (iv) Fraction of adenines methylated in the peak region for CTCF-targeted sample versus the enrichment of CTCF-targeted methylation over the untreated control. b, Nanopore data. Same as in (a), but probability of methylation is the threshold that varies rather than IPD ratio and number of passes. c, For a given fraction of adenines methylated in the peak region, here 0.1 for illustration, the PacBio and Nanopore enrichment profiles are overlaid. The thresholds for each platform for 10% peak methylation are indicated and the number of passes threshold for PacBio is one.
Extended Data Fig. 9
Extended Data Fig. 9. H3K9me3 control analysis at HOR boundaries and in centromere 7
a, Density of methylated adenines for the H3K9me3-targeted sample and IgG and free pA-Hia5 controls in 100 kb sliding window across HOR boundaries 1p, 2pq, 6p, 9p, 13q, 14q, 15q, 16p, 17pq, 18pq, 20p, 21q, 22q. b, Centromere 7 single molecule browser tracks for H3K9me3-targeted sample, IgG control, and free pA-Hia5. The same molecules are shown in both plots, with mA calls indicated in the first, and mCpG calls indicated in the second. c, Coverage tracks in 10-kb bins to accompany mA/A and mCpG/CpG tracks from Figure 5d.
Extended Data Fig. 10
Extended Data Fig. 10. AlphaHOR-RES centromere enrichment and methylation within chromosome X and chromosome 3 HORs
a, Simulated cumulative distribution of the proportion of alpha-satellite DNA lost (black) and non-centromeric DNA kept (blue) after MscI and AseI digestion of the T2T chm13 genome at different size selection cutoffs. b, High (top) and low contrast (bottom) images of agarose gel run on total genomic DNA after Msc1 and Ase1 digestion. Sample recovered from above cut site (arrow). Representative image of at least 4 replicates. c, genomic DNA tapestation gel image of sample before digestion, after digestion, and after size selection. Representative image of at least 3 replicates. d, Coverage of the active HOR on each chromosome from the CHM13+HG002X+hg38Y reference genome from free floating pA-Hia5 DiMeLo-seq libraries with and without AlphaHOR-RES. e-g, Single molecule view with individual reads in gray and mA depicted as dots for the indicated conditions. Scale bar indicates the probability of adenine methylation (from Guppy) between 0.6 and 1. Regions with at least 10 kb without unique 51 bp k-mers shown in grey to illustrate difficult to map locations for short-read sequencing. e. ChrX CDR (57.45 – 57.7 Mb), f. chromosome 3 HOR between 91.91 and 91.97 Mb, g. chromosome 3 HOR between 95.94 and 96.00 Mb.
Figure 1.
Figure 1.. Genome-wide mapping of protein-DNA interactions with DiMeLo-seq
a, Schematic of the DiMeLo-seq workflow for mapping protein-DNA interactions b-f DiMeLo-seq can be used to map multiple interaction sites for a protein of interest on each chromatin fiber (b), estimate protein-DNA interaction frequencies (c), study the joint relationship between endogenous DNA methylation and protein binding (d), study genetic or epigenetic effects on protein binding between parental haplotypes (e), map protein-DNA interactions across repetitive regions (f).
Figure 2.
Figure 2.. Application of DiMeLo-seq in artificial chromatin.
a, Schematic of antibody-directed methylation of artificial chromatin. b. Heatmap of 5000 individual 1×601 reads from chromatin containing CENP-A mononucleosomes methylated with CENP-A-directed pA-Hia5 (red dashed line indicates 601 dyad position). c, Plots of A or T density (top) and average mA/A on base position of 1×601 containing DNA (bottom) (red dashed line indicates 601 dyad position). d, Plot of percentage of reads with methylation as a function of the distance from dyad axis. e, Schematic of directed methylation of 18×601 chromatin array. f,g, Heatmap of 2000 individual reads from CENP-A chromatin methylation with CENP-A-directed pA-Hia5, hierarchically clustered by jaccard distances of inferred nucleosome positions over the entire 18×601 array (f) or a subset 4×601 region (g) along with cartoons depicting predicted nucleosome positions (red circles). Insets (below) show average mA/A on every base position of 18×601 array or 4×601 portion (red dashed line indicates 601 dyad position).
Figure 3.
Figure 3.. Optimization of DiMeLo-seq targeting Lamin B1 in situ.
a, Schematic of interactions between LMNB1 and lamina-associated domains, and the use of mA levels in cLADs and ciLADs to estimate on-target and off-target mA. b, Scatterplot of each protocol condition tested the proportion (y-axis) of all A bases (basecalling q>10, n = min 1.4M, max 28M A bases per condition) called as methylated (stringent threshold p>0.9; abbreviated mA/A) across all reads in on-target (cLAD) regions and the ratio (x axis) of these mA levels compared to off-target (ciLAD) regions. Circles are colored by the methyltransferase condition used. Error bars provide a measure of uncertainty due to each condition’s sequencing coverage (described below). Complete data are in Supplementary Table 1. c, A browser image across all of chromosome 7 comparing in situ LMNB1-targeted DiMeLo-seq (protocol v1) to in vivo LMNB1-tethered DamID data (blue) . The coverage of each region by simulated DpnI digestion fragments (splitting reference at GATC sites) between 150 and 750 bp (sequenceable range) is indicated by a teal heatmap track (range 0 to 0.7). The presence of intervals longer than 10 kb between unique 51-mers in the reference, a measure of mappability, is indicated with an orange heatmap track. d, A zoom-in view of the centromere on chr7, with added tracks at the bottom illustrating LMNB1 interaction frequencies from single-cell DamID data , as well as from DiMeLo-seq data (protocol v1). e, For a quality-filtered set of 100 kb genomic bins (gray points, Supplementary Note 7, n = 11292 total bins), a comparison of LMNB1 interaction frequency estimates from DiMeLo-seq (protocol v1; black circles indicate mean across n = 94 to 663 genomic bins, computed for each genomic bin as the prop. of n = 61 to 335 overlapping reads with at least 1 mA call with p>0.9) versus scDamID (prop. of n = 32 cells with detected interactions in each genomic bin). A linear regression line computed across all bins is overlaid (blue). Error bars in (b) and (e) represent 95% credible intervals determined for each proportion, mean of proportions, or ratio of proportions by sampling from posterior beta distributions computed using uninformative priors.
Figure 4.
Figure 4.. Single-molecule CTCF binding and CpG methylation profiles
a, Single molecules spanning CTCF ChIP-seq peaks are shown across quartiles of ChIP-seq peak strength. Q4, quartile 4, are peaks with the strongest ChIP-seq peak signal, while Q1, quartile 1, are peaks with the weakest ChIP-seq peak signal. Blue show mA called with probability ≥ 0.75, while orange indicate mCpG called with probability ≥ 0.75. Aggregate curves for each quartile were created with a 50 bp rolling window. Base density across the 2 kb region for each quartile is indicated in the 1D heatmaps; the scale bar indicates the number of adenine bases and CG dinucleotides sequenced at each position relative to the motif center. b, Joint mA and mCpG calls on the same individual molecules spanning CTCF ChIP-seq peaks. Molecules displayed have at least one mA called and one mCpG called with probability ≥ 0.75. Aggregate curves were created with a 50 bp rolling window. Base density is indicated as in (a). c, CTCF site protein occupancy is measured on single molecules spanning two neighboring CTCF motifs within 2–10 kb of one another. CTCF motifs are selected from all ChIP-seq peaks, and molecules are shown that have a peak at at least one of the two motifs. Each row is a single molecule, and the molecules are anchored on the peaks that they span, with a variable distance between the peaks indicated by the grey block. ChIP-seq peak signal for each of the motif sites is indicated with the purple bars. The graphic on the side illustrates the CTCF binding pattern for each cluster. d, Phased reads across the IGF2/H19 Imprinting Control Region with CTCF sites indicated in grey. Blue dots represent mA calls and orange dots represent mCpG calls. Heterozygous sites used for phasing are indicated in turquoise.
Figure 5.
Figure 5.. Detecting H3K9me3 in centromeres
a, The proportion of adenines methylated within CUT&RUN peaks relative to the proportion of adenines methylated outside of CUT&RUN broad peak regions is reported for the H3K9me3-targeted sample as well as IgG and free pA-Hia5 controls. Error bars represent 95% credible intervals determined for each ratio by sampling from posterior beta distributions computed with uninformative priors. b, The fraction of adenines methylated within centromeres relative to non-centromeric regions, and similarly the fraction of adenines methylated within active HOR arrays relative to non-centromeric regions are displayed for the H3K9me3-targeted sample as well as the IgG and free pA-Hia5 controls. Error bars are defined as in (a). c, The decline in mA/A for the H3K9me3-targeted sample in a rolling 100 kb window from −300 kb within the HOR array to 300 kb outside of the HOR array. HOR array boundaries that transition quickly into non-repetitive sequences were considered: 1p, 2pq, 6p, 9p, 13q, 14q, 15q, 16p, 17pq, 18pq, 20p, 21q, 22q. d, Single molecules are displayed across the centromere of chromosome 7 for the H3K9me3-targeted sample and the IgG control. Reads mapping to the same position are displayed vertically, and modified bases are colored by the probability of methylation at that base for probabilities ≥ 0.6. Aggregate tracks show mA/A and mCpG/CpG in the H3K9me3-targeted sample in 10 kb bins. Grey bars below centromere annotation indicate regions with >20 kb marker deserts.
Figure 6.
Figure 6.. CENP-A-directed methylation within chromosome X centromeric higher order repeats
a, Schematic of DiMeLo-seq with AlphaHOR-RES centromere enrichment. b, Genome browser plot on HG002 chromosome X of read coverage from DiMeLo-seq libraries with centromere enrichment (top) or without (middle). Bottom track depicts the region of the alpha satellite array. c, Barplot of percentage mA/A (using a stringent Guppy probability threshold of 0.95) for reads from each library that contain or do not contain CENP-A enriched k-mers. Fold enrichment of methylation percentage on CENP-A reads over Non-CENP-A reads reported on top. Error bars represent 95% confidence intervals. d, View of a 250 kb region spanning the CDR within the active chrX HOR array. (top) Single-molecule view, with individual reads as gray lines and mCpG positions as orange dots shaded by Guppy’s methylation probability. (bottom) CpG methylation frequency from nanopore sequencing reported in . e, Single-molecule view of reads in (d). mA positions are depicted as blue dots shaded by Guppy’s methylation probability. f, Aggregate view of mA. mA/A plot indicates the fraction of reads with a Guppy methylation probability above 0.6 at each adenine position (averaged over a 250 bp rolling window for visualization). Marker deserts (regions of at least 10 kb without unique 51 bp k-mers) are shown in orange to illustrate difficult-to-map locations for short-read sequencing. g, For CENP-A or IgG control DiMeLo-seq, read coverage (top plots) and average fraction of nucleosomes detected as CENP-A (bottom plot) per read in sliding 5 kb windows (step size 1 bp), providing a measure of the density of CENP-A nucleosomes within single DNA molecules across the region. Thick lines indicate a 25 kb rolling average. Cartoon below shows representations of detected CENP-A nucleosomes within a 5 kb region corresponding to the CDR or CDR-adjacent region.

References

    1. van Steensel B & Henikoff S Identification of in vivo DNA targets of chromatin proteins using tethered dam methyltransferase. Nat. Biotechnol 18, 424–428 (2000). - PubMed
    1. Mikkelsen TS et al. Genome-wide maps of chromatin state in pluripotent and lineage-committed cells. Nature 448, 553–560 (2007). - PMC - PubMed
    1. Robertson G et al. Genome-wide profiles of STAT1 DNA association using chromatin immunoprecipitation and massively parallel sequencing. Nat. Methods 4, 651–657 (2007). - PubMed
    1. Johnson DS, Mortazavi A, Myers RM & Wold B Genome-wide mapping of in vivo protein-DNA interactions. Science 316, 1497–1502 (2007). - PubMed
    1. Barski A et al. High-resolution profiling of histone methylations in the human genome. Cell 129, 823–837 (2007). - PubMed

Publication types