. 2022 Jul;127(2):364-376.
doi: 10.1038/s41416-022-01800-y. Epub 2022 Apr 8.

Targeting NQO1/GPX4-mediated ferroptosis by plumbagin suppresses in vitro and in vivo glioma growth

Affiliations

Targeting NQO1/GPX4-mediated ferroptosis by plumbagin suppresses in vitro and in vivo glioma growth

Sheng Zhan et al. Br J Cancer. 2022 Jul.

Abstract

Background: Ferroptosis has attracted increasing interest in cancer therapy. Emerging evidences suggest that naturally occurring naphthoquinones exhibit potent anti-glioma effects via various mechanisms.

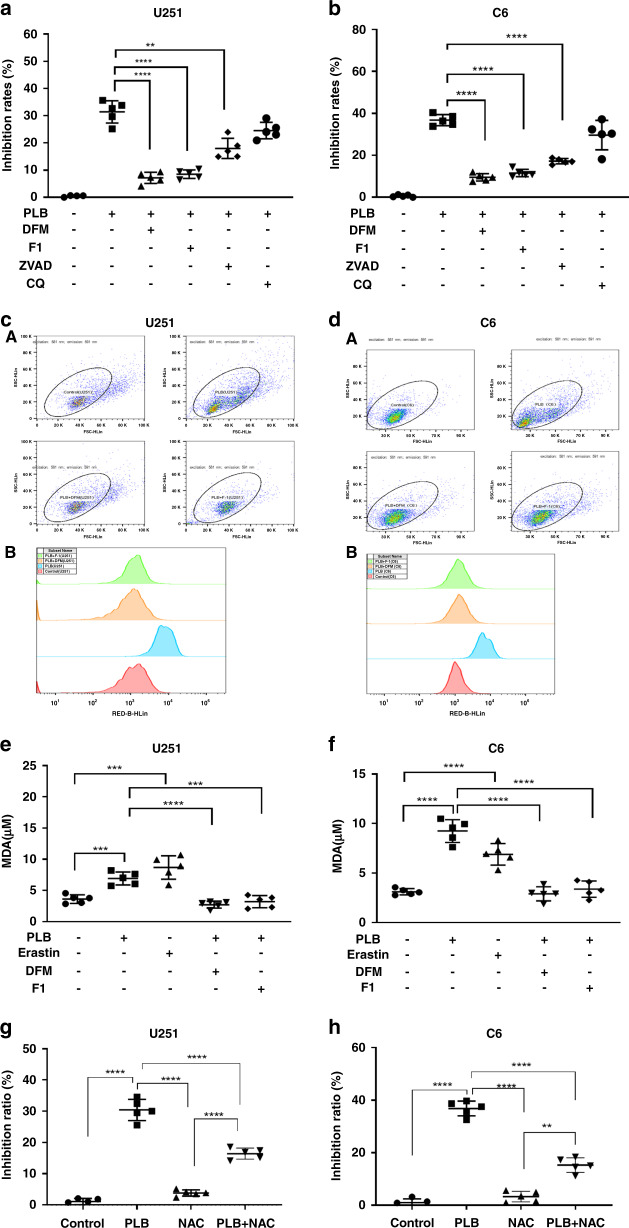
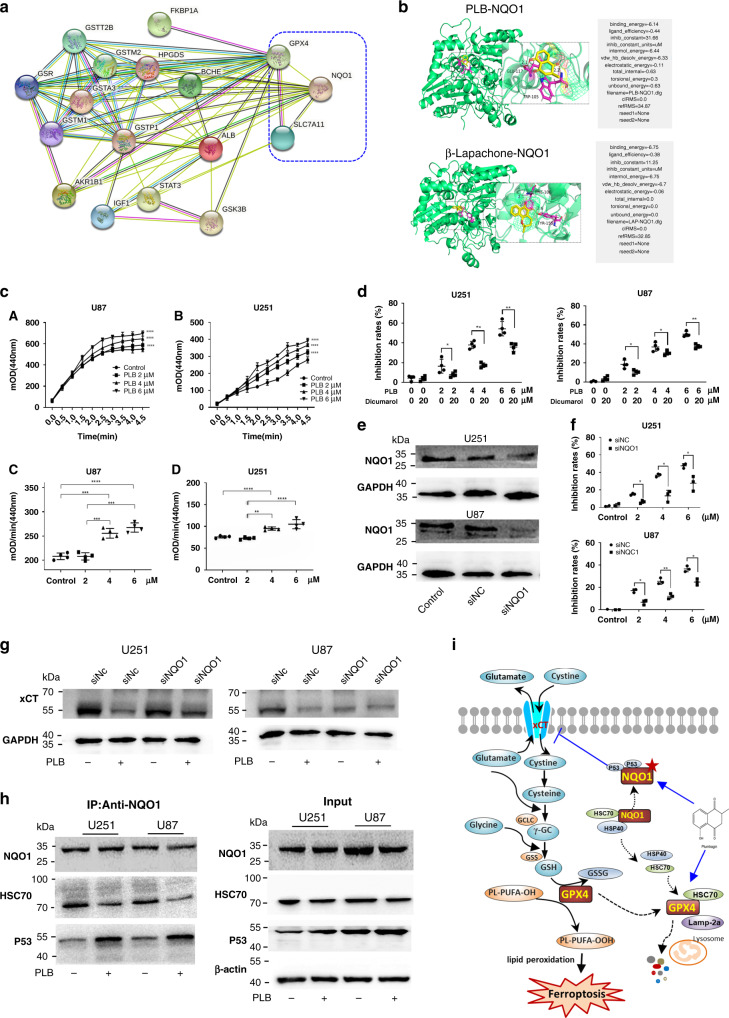
Methods: The anti-glioma effects of plumbagin were evaluated by in vitro and in vivo experiments. Anti-glioma mechanism of plumbagin was studied by proteomics, flow cytometry, MDA assay, western blot, and RT-PCR. Gene knockdown/overexpression, molecular docking, PharmMappper database, and coimmunoprecipitation were used to study the targets of plumbagin.

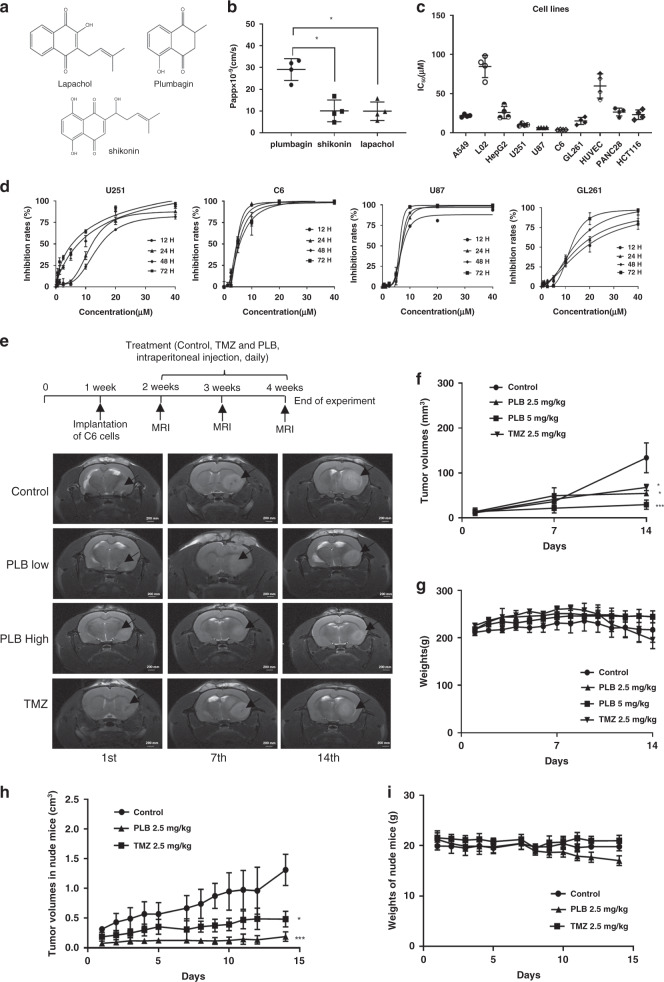
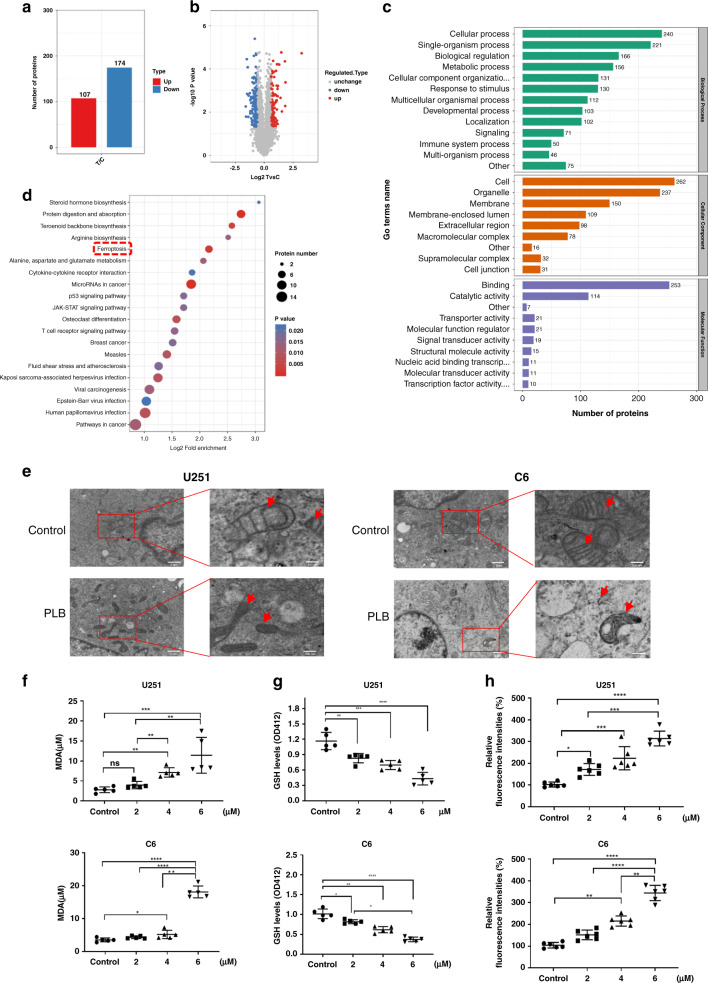
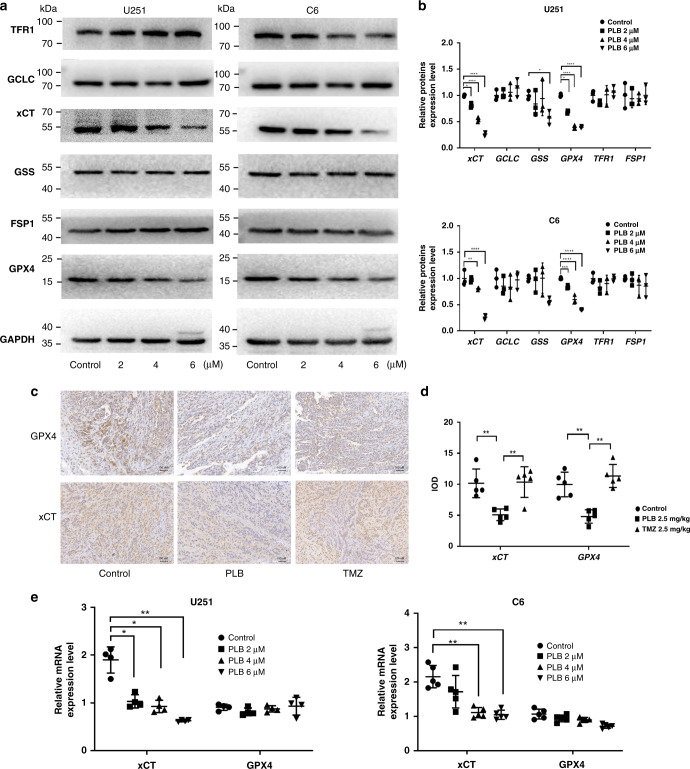
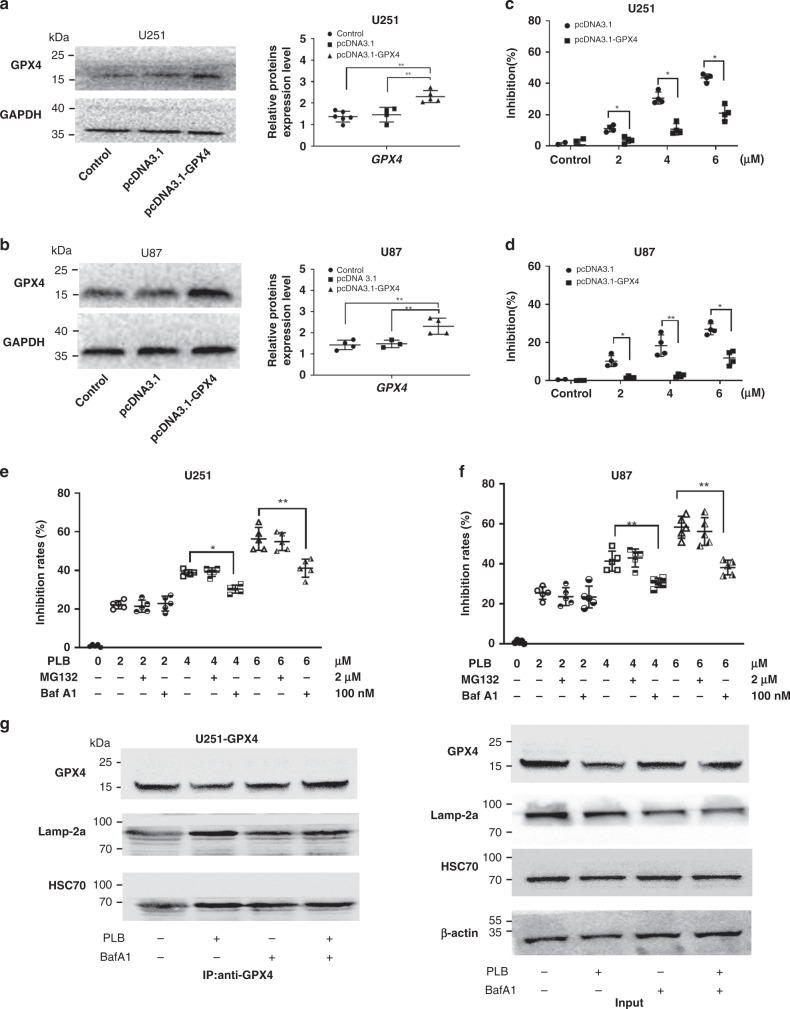
Results: Plumbagin showed higher blood-brain barrier penetration ability than that of lapachol and shikonin and elicited significant growth inhibitory effects in vitro and in vivo. Ferroptosis was the main mechanism of plumbagin-induced cell death. Mechanistically, plumbagin significantly downregulated the protein and mRNA levels of xCT and decreased GPX4 protein levels. NAD(P)H quinone dehydrogenase 1 (NQO1) was revealed as a plumbagin predictive target using PharmMappper database and molecular docking. Plumbagin enhanced NQO1 activity and decreased xCT expression, resulting in NQO1-dependent cell death. It also induced GPX4 degradation via the lysosome pathway and caused GPX4-dependent cell death.

Conclusions: Plumbagin inhibited in vitro and in vivo glioma growth via targeting NQO1/GPX4-mediated ferroptosis, which might be developed as a novel ferroptosis inducer or anti-glioma candidate.


Conflict of interest statement

The authors declare no competing interests.

Figures

Fig. 1
Fig. 1. PLB significantly inhibited glioma growth in vitro and in vivo.
a Chemical structures of PLB, lapachol, and shikonin; b calculated Papp × 10−9 of PLB, lapachol, and shikonin in the in vitro BBB cell model (n = 4, *P < 0.05). c IC50 of PLB in different cancer cells and normal cells via the MTS assay (n = 4). d Dose–response curves of PLB in U251, C6, U87, and GL261 glioma cells at 12, 24, 48, and 72 h (n = 3). e Schematic chart of rat orthotopic transplantation model and MRI images of C6 glioma in the brains of the rats indifferent groups on the 1st, 7th, and 14th days. f Tumour volumes of the rats in the control, TMZ, and PLB groups (n = 6, *P < 0.05, ***P < 0.005). g Body weights of the rats in the control, TMZ, and PLB groups (n = 6). h Tumour volumes of the nude mice in the control, TMZ, and PLB groups recorded during the experiment (n = 6, *P < 0.05, ***P < 0.005). i Body weights of the mice in the control, TMZ, and PLB groups recorded during the experiment (n = 6). The results were all expressed as mean ± S.D.
Fig. 2
Fig. 2. PLB induced ferroptosis in glioma cells.
a Label-free quantitative proteomic analysis of the number of differentially expressed proteins in the control and PLB-treated cells (n = 3). b Volcano plot of differentially expressed proteins. The threshold of the differential expression change was set at 1.5 times, and P < 0.05 was set as the significance threshold. c Differentially expressed proteins were classified into three main categories (cellular component, biological process and molecular function) via GO annotation. d Bubble diagram of KEGG enrichment results of differentially expressed proteins. e Transmission electronic microscopy images of U251 and C6 cells with or without 4 μM PLB treatment (n = 3). f Malondialdehyde (MDA) levels in U251 and C6 cells with or without 2, 4, and 6 μM PLB treatment (n = 5). g Intracellular GSH levels in U251 and C6 cells treated with 0, 2, 4, and 6 μM PLB (n = 5). h Relative fluorescence intensities of DCFH-DA in U251 and C6 cells treated with 0, 2, 4, and 6 μM PLB (n = 6). All results are expressed as mean ± S.D. *P < 0.05, **P < 0.01, ***P < 0.005, ****P < 0.001.
Fig. 3
Fig. 3. PLB induced ferroptosis-dependent cell death.
a, b Inhibitory effects of PLB on U251 and C6 cells in the presence of ferroptosis inhibitors (10 μM DFM and 1.25 μM F-1), apoptosis inhibitor (2 μM ZVAD), and autophagy inhibitor (10 μM CQ) via the MTS assay (n = 5). cA, dA Fluorescence intensities of C11-BODIPY581/591 in PLB treated U251 and C6 cells in the presence of ferroptosis inhibitors (10 μM DFM and 1.25 μM F-1) detected via flow cytometry. cB, dB Quantification of the fluorescence intensities detected with flow cytometry in cA, dA, respectively (n = 3). e, f MDA levels observed through the TBARS assay in U251 and C6 cells treated with 4 μM PLB in the presence of ferroptosis inhibitors (10 μM DFM and 1.25 μM F-1) (n = 5). g, h Inhibitory effects of PLB on U251 and C6 cells in the presence of NAC (10 μM) (n = 5). Results are expressed as mean value ± S.D. **P < 0.01, ***P < 0.005, and ****P < 0.001 versus the control group.
Fig. 4
Fig. 4. xCT and GPX4 expression levels decreased in PLB-induced ferroptosis.
a Representative western blot results of ferroptosis-related protein expression levels in U251 and C6 cells treated with PLB. b Quantitation of western blot results of ferroptosis-related proteins. GAPDH served as the loading control (n = 4). c Representative immunohistochemical staining results of xCT and GPX4 in xenograft glioma tissues in nude mice treated with PLB or TMZ. Scale bar, 100 μm. d Statistical analysis of immunohistochemical staining results of xCT and GPX4 (n = 5). e mRNA expression levels of xCT and GPX4 in U251 (n = 4) and C6 cells (n = 5) treated with PLB. The results are expressed as mean value ± S.D. *P < 0.05, **P < 0.01, ***P < 0.005, and ****P < 0.001 versus the control group.
Fig. 5
Fig. 5. PLB induced GPX4-dependent cell death by causing GPX4 degradation.
a, b Western blot and quantitation results of the GPX4 expression in GPX4 plasmid-transfected U87 (n = 4) and U251 cells (n = 5). c, d Inhibitory effects of PLB on GPX4 overexpressed and vector control U87 and U251 cells via the MTS assay (n = 4). e, f Cell viabilities of U251 and U87 cells treated with PLB in the presence of MG132 (2 μM) or Baf-A1 (100 nM) for 48 h (n = 5). g Coimmunoprecipitation results of GPX4 and HSC70 or Lamp-2a in GPX4-overexpressing U251 cells treated with 6 μM PLB in the presence of Baf-A1 (100 nM). Cell lysates were immunoprecipitated with anti-GPX4 antibody and subjected to western blot with the indicated antibodies. *P < 0.05 and **P < 0.01, versus the control group.
Fig. 6
Fig. 6. PLB induced ferroptosis by targeting NQO1.
a Functional protein association network of GPX4, xCT, and PLB-related predictive targets by using the STRING database 11.0 (http://string-db.org/). PLB-related predictive targets were identified from the PharmMapper database (http://www.lilab-ecust.cn/pharmmapper/). b Molecular docking result for the binding of PLB to NQO1. β-Lapachone was used as the positive control. cA, cB The OD dynamic change curve of U251 and U87 cells with or without PLB treatment (n = 4). cC, cD Quantitation of NQO1 activity in U251 and U87 cells with or without PLB treatment (n = 4). d Cell viabilities of U251 and U87 cells treated with PLB in the presence of dicumarol (20 μM) for 48 h (n = 4). e Western blot results of NQO1 expression in siNQO1- or siNC-transfected U87 and U251 cells (n = 4). f Inhibitory effects of PLB on siNQO1- or siNC-transfected U87 and U251 cells via the MTS assay (n = 3). g Western blot results of xCT expression levels in siNQO1- or siNC-transfected U87 and U251 cells with or without 6 μM PLB treatment (n = 3). h Coimmunoprecipitation results of NQO1 and p53 or HSC70 in U251 and U87 cells treated with or without 6 μM PLB (n = 3). i Schematic of PLB-induced ferroptosis in glioma cells. Results are expressed as mean ± S.D. *P < 0.05, **P < 0.01, ***P < 0.005, and ****P < 0.001.

References

    1. Herrlinger U, Tzaridis T, Mack F, Steinbach JP, Schlegel U, Sabel M, et al. Lomustine-temozolomide combination therapy versus standard temozolomide therapy in patients with newly diagnosed glioblastoma with methylated MGMT promoter (CeTeG/NOA-09): a randomised, open-label, phase 3 trial. Lancet. 2019;393:678–88. doi: 10.1016/S0140-6736(18)31791-4. - DOI - PubMed
    1. Hu Z, Mi Y, Qian H, Guo N, Yan A, Zhang Y, et al. A potential mechanism of temozolomide resistance in glioma–ferroptosis. Front Oncol. 2020;10:897. doi: 10.3389/fonc.2020.00897. - DOI - PMC - PubMed
    1. Yang WS, Kim KJ, Gaschler MM, Patel M, Shchepinov MS, Stockwell BR. Peroxidation of polyunsaturated fatty acids by lipoxygenases drives ferroptosis. Proc Natl Acad Sci USA. 2016;113:E4966–75. - PMC - PubMed
    1. Weiland A, Wang Y, Wu W, Lan X, Han X, Li Q, et al. Ferroptosis and its role in diverse brain diseases. Mol Neurobiol. 2019;56:4880–93. doi: 10.1007/s12035-018-1403-3. - DOI - PMC - PubMed
    1. Qu Y, Wang J, Ray PS, Guo H, Huang J, Shin-Sim M, et al. Thioredoxin-like 2 regulates human cancer cell growth and metastasis via redox homeostasis and NF-κB signaling. J Clin Investig. 2011;121:212–25. doi: 10.1172/JCI43144. - DOI - PMC - PubMed

Publication types

MeSH terms

Substances