. 2022 Apr 8;10(1):36.
doi: 10.1038/s41413-022-00206-z.

Specific inflammatory osteoclast precursors induced during chronic inflammation give rise to highly active osteoclasts associated with inflammatory bone loss

Affiliations

Specific inflammatory osteoclast precursors induced during chronic inflammation give rise to highly active osteoclasts associated with inflammatory bone loss

Yaron Meirow et al. Bone Res. .

Abstract

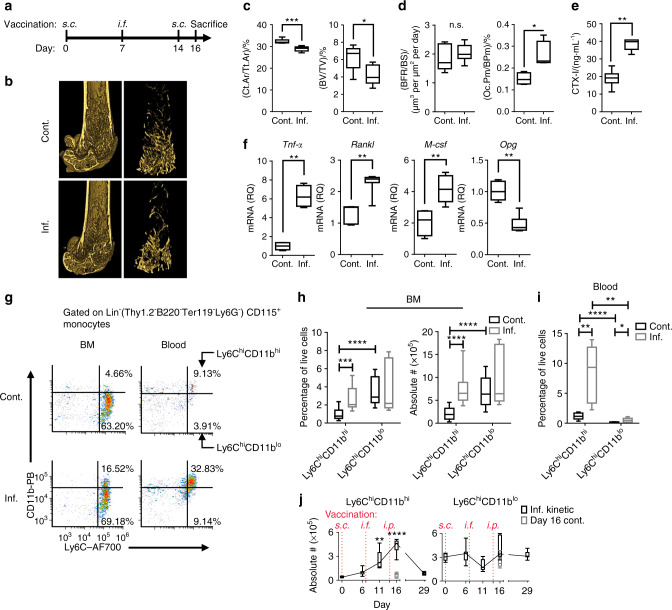
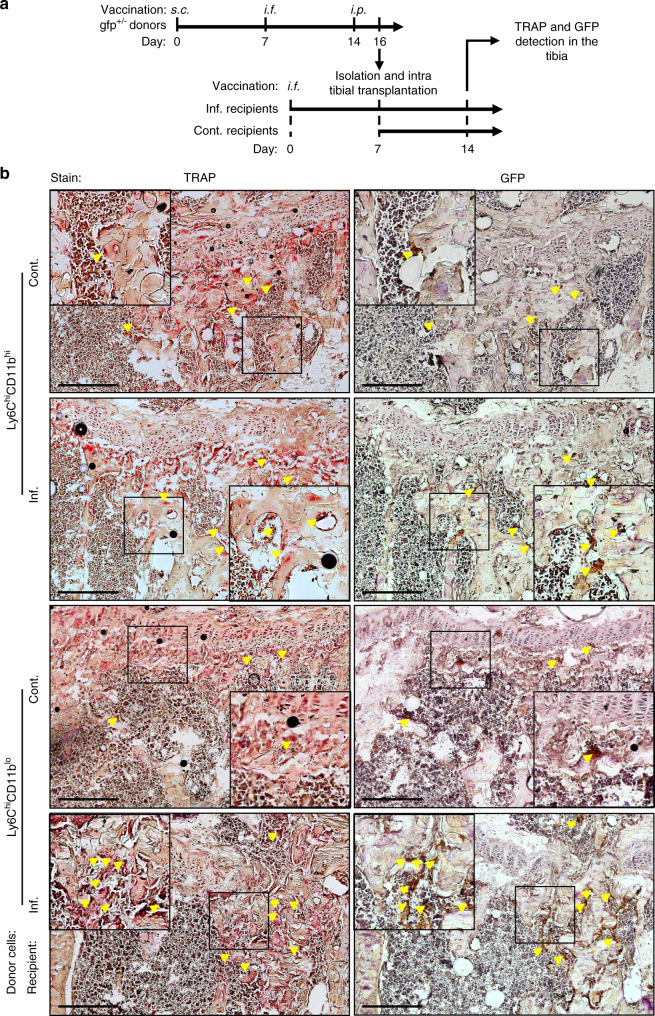
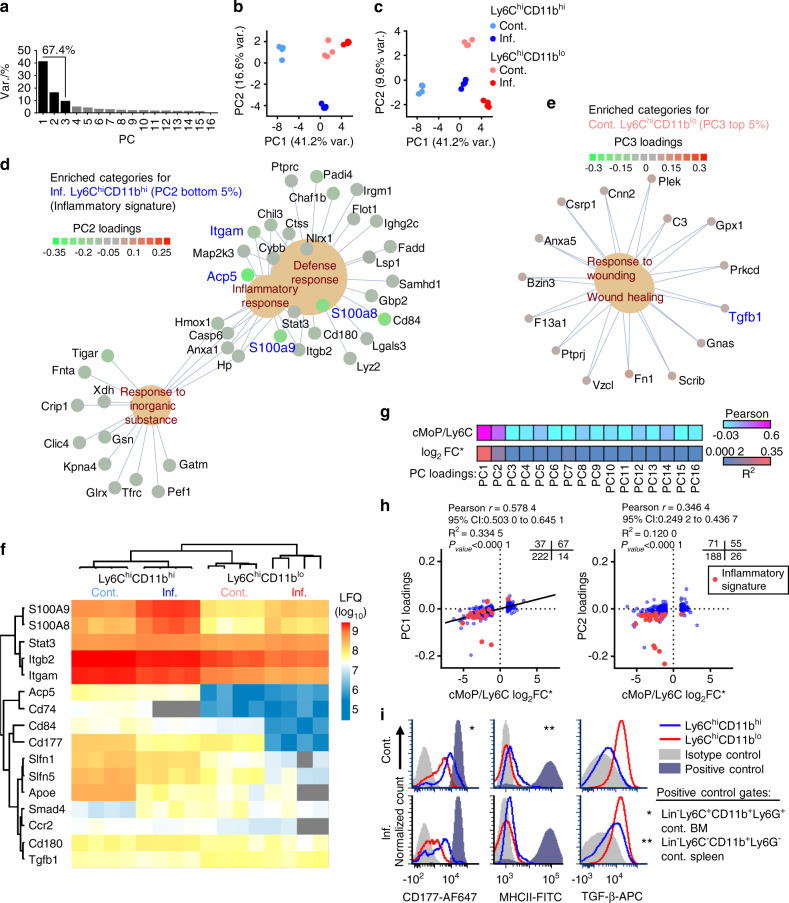
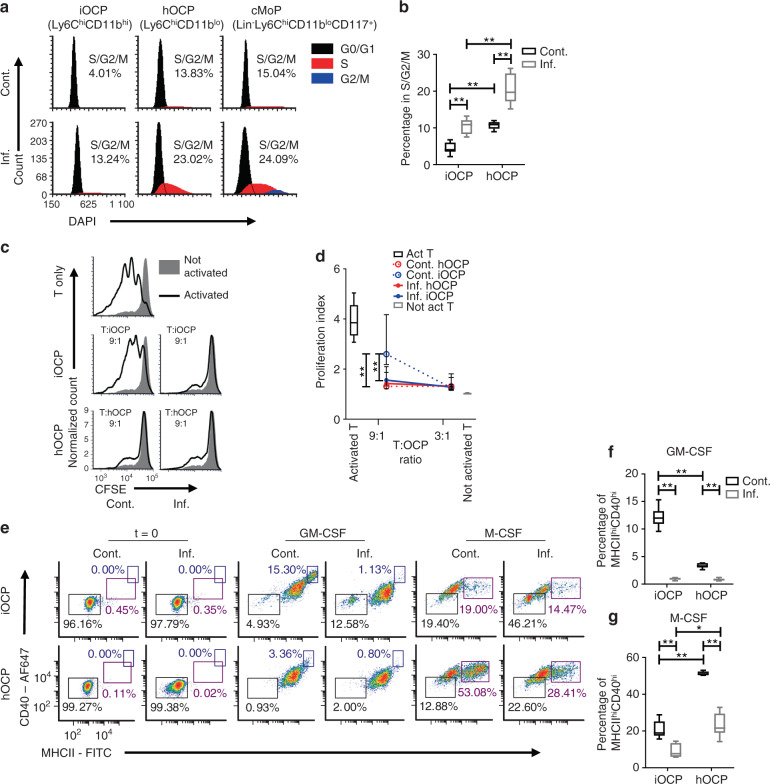
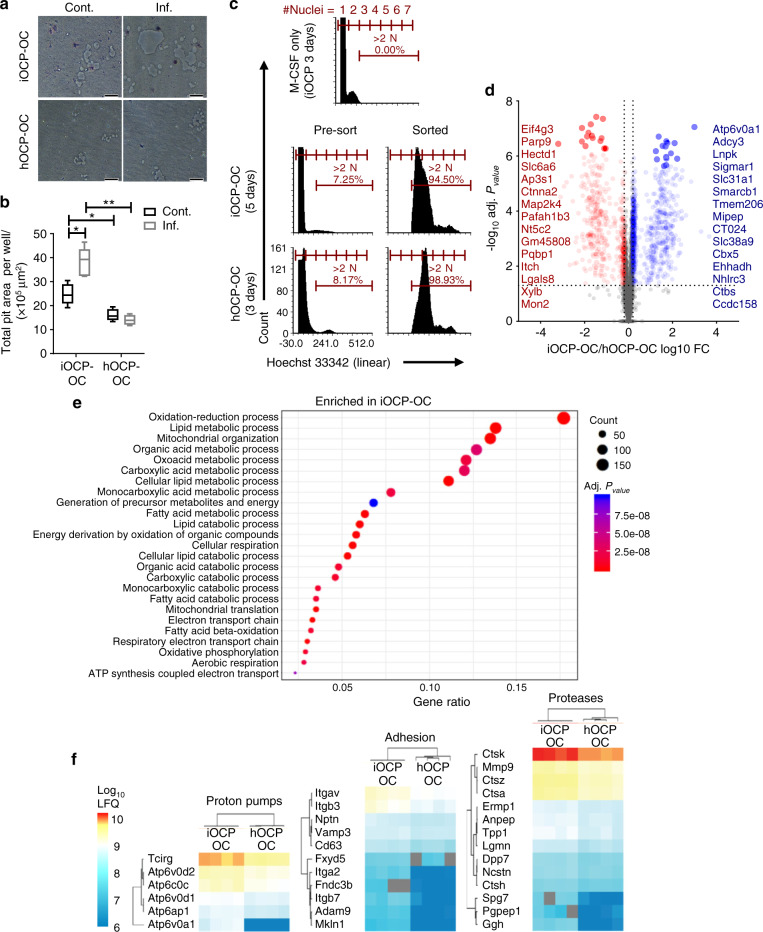
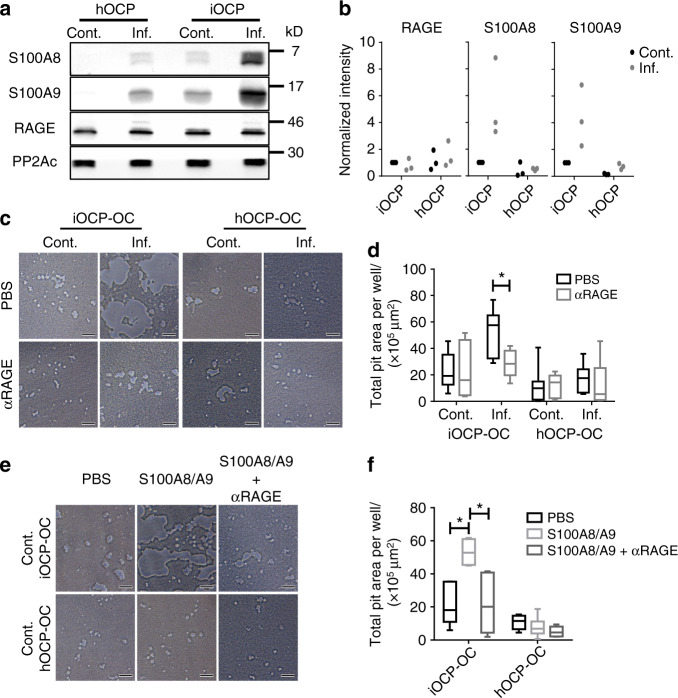
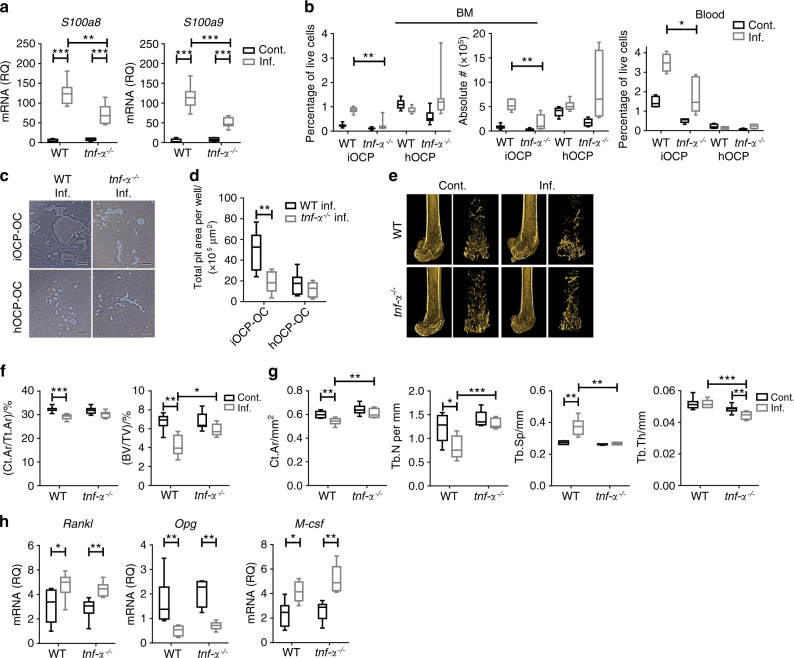
Elevated osteoclast (OC) activity is a major contributor to inflammatory bone loss (IBL) during chronic inflammatory diseases. However, the specific OC precursors (OCPs) responding to inflammatory cues and the underlying mechanisms leading to IBL are poorly understood. We identified two distinct OCP subsets: Ly6ChiCD11bhi inflammatory OCPs (iOCPs) induced during chronic inflammation, and homeostatic Ly6ChiCD11blo OCPs (hOCPs) which remained unchanged. Functional and proteomic characterization revealed that while iOCPs were rare and displayed low osteoclastogenic potential under normal conditions, they expanded during chronic inflammation and generated OCs with enhanced activity. In contrast, hOCPs were abundant and manifested high osteoclastogenic potential under normal conditions but generated OCs with low activity and were unresponsive to the inflammatory environment. Osteoclasts derived from iOCPs expressed higher levels of resorptive and metabolic proteins than those generated from hOCPs, highlighting that different osteoclast populations are formed by distinct precursors. We further identified the TNF-α and S100A8/A9 proteins as key regulators that control the iOCP response during chronic inflammation. Furthermore, we demonstrated that the response of iOCPs but not that of hOCPs was abrogated in tnf-α-/- mice, in correlation with attenuated IBL. Our findings suggest a central role for iOCPs in IBL induction. iOCPs can serve as potential biomarkers for IBL detection and possibly as new therapeutic targets to combat IBL in a wide range of inflammatory conditions.


Conflict of interest statement

The authors declare no competing interests.

Figures

Fig. 1
Fig. 1
Chronic inflammation augments OC activity and expands Ly6Chi monocyte populations. a Time course of the vaccination model (see the Methods section for details). b Representative 3D modeling from femoral microCT scans of control (cont.) and inflamed (inf.) mice. All microCT scans were performed on the right femur. c MicroCT evaluation of the cortical bone cross-sectional area fraction (Ct.Ar/Tt.Ar) and trabecular bone volume/total volume (BV/TV). d Histomorphometric indices: bone formation rate/bone surface (BFR/BS) and fraction of OCs occupying the cortical perimeter (Oc.Pm/BPm). The full microCT and histomorphometric results are shown in Table S1. e Serum collagen type 1 cross-linked C-telopeptide (CTX-I) levels. f Relative quantities (RQs) of Tnf-α, Rankl, M-csf and Opg transcripts in RNA extracted from the proximal half of the right tibia. af Control n = 7, inflamed n = 7; representative results for three independent experiments (Mann–Whitney test and Holm multiplicity correction). g Flow cytometric analysis of leukocytes isolated from the BM and blood of control and inflamed mice. The plots are gated on Lin-(Thy1.2-B220-Ter119-Ly6G-)CD115+ monocytes and depict the Ly6ChiCD11bhi and Ly6ChiCD11blo subsets. h Ly6ChiCD11bhi and Ly6ChiCD11blo cell frequencies and absolute numbers in the BM of control and inflamed mice [absolute number in BM extracted from 1 leg (femur + tibia)]. i Frequency in the blood. Representative results for three independent experiments are presented. Control n = 15, inflamed n = 15 (Mann–Whitney test and Holm multiplicity correction). j Kinetics of Ly6ChiCD11bhi and Ly6ChiCD11blo cell accumulation in the BM during the vaccination protocol. Inflamed n = 7 for each time point, Day 16 control n = 6 (Kruskal–Wallis and Dunn post-test all compared to Day 0). Line: median, box: 25th–75th percentile, whiskers: range. *P < 0.05, **P < 0.01, ***P < 0.00 1, ****P < 0.000 1. (s.c. – subcutaneous, i.f. – intrafootpad, i.p. – intraperitoneal)
Fig. 2
Fig. 2
Ly6ChiCD11bhi and Ly6ChiCD11blo cells give rise to OCs in vitro. a The isolation and sorting strategy for Ly6ChiCD11bhi and Ly6ChiCD11blo cells is presented, and the purity was ≥98% in all samples. b Sorted Ly6ChiCD11bhi or Ly6ChiCD11blo cells (104) from the BM of control and inflamed mice were cultured with osteoclast differentiation medium for 4 and 8 days. Multinucleated TRAP-stained OCs appeared in Ly6ChiCD11blo cultures after 4 days and in Ly6ChiCD11bhi cultures after 8 days (bar: 200 µm). c Area quantitation of OCs derived from Ly6ChiCD11blo cells after 4 days and from Ly6ChiCD11bhi cells after 8 days in culture. b, c Control n = 5, inflamed n = 5, for each cell population; representative results for 5 independent experiments (Mann–Whitney test). Line: median, box: 25th–75th percentile, whiskers: range. *P < 0.05, **P < 0.01
Fig. 3
Fig. 3
Ly6ChiCD11bhi and Ly6ChiCD11blo cells give rise to OCs in vivo. a Sorted Ly6ChiCD11bhi or Ly6ChiCD11blo cells (106) from the BM of inflamed gfp donor mice were injected into the right tibia of inf. WT recipient mice 7 days after a single i.f. vaccination (left foot pad) or into that of sex/age-matched cont. mice. Recipient mice were sacrificed 7 days after transplantation. b TRAP staining (left panel) and GFP immunohistochemistry (right panel) of 7-µm consecutive sections from the right tibia of the recipient mice. Black frames are digitally enlarged, and locations positive for both TRAP and GFP are marked by yellow arrows. Scale bar, 400 µm
Fig. 4
Fig. 4
Immune-inflammatory proteomic profile is observed in Ly6ChiCD11bhi cells but not Ly6ChiCD11blo cells. a A scree plot for the PCA is presented. b Projection plot for PC1 and PC2. c Projection plot for PC1 and PC3. d Gene concept network of proteins in enriched categories in the bottom 5% of PC2 loading scores (characteristic for inflamed Ly6ChiCD11bhi cells). e Proteins in enriched categories in the top 5% of PC3 loading scores (characteristic for control Ly6ChiCD11blo cells). The Benjamini–Hochberg FDR was set to 0.05 for all GO analyses (see detailed results in Fig. S4). f Heatmap of selected key proteins residing in either the PC1 or PC2 bottom 5% or PC3 top 5% of loading scores. g Pearson coefficient and R2 heatmap of PC loadings vs. the cMoP/Ly6C signature (log2FC) reported by Hettinger et al., 2013. h Scatterplot of PC1 and PC2 loadings vs. the cMoP/Ly6C signature (log2FC) (340 proteins detected in both datasets). Quadrant counts indicated (top right). i Cell surface expression of the markers CD177, MHCII and TGF-β in control and inflamed Ly6ChiCD11bhi and Ly6ChiCD11blo cells. Positive controls are indicated by asterisks
Fig. 5
Fig. 5
iOCPs and hOCPs are functionally distinct myeloid precursor populations. a Cell cycle staining of iOCPs (Ly6ChiCD11bhi) and hOCPs (Ly6ChiCD11blo) in the BM of control and inflamed mice. Lin-Ly6ChiCD11bloCD117+ cMoPs were used as a positive control, and iOCPs and hOCPs were identified from the CD117- gate. b The frequency of cells in the S/G2/M phase. n = 6 for each group, representative of two independent experiments. c Representative plots for the T-cell proliferation suppression assay at a 9:1 T cell:OCP ratio with iOCPs and hOCPs. d The proliferation indices at 3:1 and 9:1 T cell:OCP ratios are presented. n = 5 for each group, representative results for 2 independent experiments. e MHCII and CD40 expression of iOCPs and hOCPs sorted from the BM of control or inflamed mice after 3 days in culture with GM-CSF or M-CSF. f The fraction of MHCIIhiCD40hi differentiated cells in GM-CSF-containing cultures. g The frequency of MHCIIhiCD40hi differentiated cells in M-CSF-containing cultures. n = 6 for each group, representative results for 3 independent experiments. Line/circle: median, box: 25th-75th percentile, whiskers: range. *P < 0.05, **P < 0.01 (Mann–Whitney test and Holm multiplicity correction)
Fig. 6
Fig. 6
iOCP-derived OCs are more active and express more resorption-related proteins than hOCP-derived OCs. a Sorted iOCPs or hOCPs (5 × 104) from the BM of control and inflamed mice were cultured on Osteo assay surface plates in OC differentiation medium to generate OCs (iOCP-OCs and hOCP-OCs, respectively). The cells were cultured for 10 days until OC exhaustion (bar: 50 µm). b Total pit area per well represents the total resorption potential of a fixed number of precursors. n = 5 for each group, representative results for three independent experiments. Line: median, box: 25th–75th percentile, whiskers: range. *P < 0.05, **P < 0.01 (Mann–Whitney test and Holm multiplicity correction). c hOCPs and iOCPs sorted from the BM of inflamed mice were cultured for 3 and 5 days, respectively, with RANKL and recombinant M-CSF to generate iOCP-OCs and hOCP-OCs. The cultures were harvested, and mature OCs were sorted as cells with more than two nuclei identified by Hoechst 33342 staining. The threshold was set according to iOCPs cultured with only M-CSF for 3 days. d Top 15 differentially expressed proteins between iOCP-OCs and hOCP-OCs. e Enriched gene ontology biological process terms among significant iOCP-OC proteins. hOCP-OCs were enriched in only DNA replication (GO: 0006260). The Benjamini–Hochberg FDR was set to 0.05 for the GO analysis. f Expression heatmaps of OC activity-related proton pumps, adhesion molecules and proteases, which were significantly more highly expressed in iOCP-OCs. Four biological replicates were used (Limma, FDR = 0.05)
Fig. 7
Fig. 7
S100A8/A9 proteins augment differentiation and osteoclastic activity derived from iOCPs but not from hOCPs. a Expression of S100A8, S100A9 and RAGE in sorted control and inflamed BM iOCPs and hOCPs. The protein phosphatase 2A catalytic subunit (PP2Ac) is shown as a loading control. b Densitometry measurements of three biological repeats (no statistical analysis presented). c Sorted control and inflamed BM iOCPs and hOCPs (5 × 104) were cultured on the Osteo assay surface with or without anti-RAGE blocking antibodies (bar: 50 µm). d Pit area quantitation. e Sorted iOCPs and hOCPs (5 × 104) from the BM of control mice were cultured on the Osteo assay surface in combination with a recombinant S100A8/A9 heterodimer and anti-RAGE blocking antibodies as indicated (bar: 50 µm). f Pit area quantitation. cf Depict representative results for two independent experiments, n = 5 for each group. Line: median, box: 25th-75th percentile, whiskers: range. *P < 0.05 (Mann–Whitney test and Holm multiplicity correction)
Fig. 8
Fig. 8
TNF-α ablation abrogates IBL by targeting iOCPs but not the hOCP response during chronic inflammation. a Expression of S100a8 and S100a9 transcripts in the right tibia of control and inflamed WT and tnf-α−/−mice. b iOCP and hOCP frequencies and absolute numbers in the BM of control and inflamed WT and tnf-α−/− mice (left panel) and the fractions in the peripheral blood (right panel). c. Sorted iOCPs and hOCPs (5 × 104)- from the BM of inflamed WT and tnf-α−/− mice cultured on the Osteo assay surface (bar: 50 µm). d Quantitation of total pit area/well. e Representative 3D modeling from femoral microCT scans of control and inflamed WT and tnf-−/− mice. f Cortical cross-sectional area fraction (Ct.Ar/Tt.Ar) and trabecular BV/TV. g Morphometric indices; Ct.Ar, Tb.N, Tb.Sp and Tb.Th. h Expression of Rankl, Opg and M-csf in right tibiae. a, b and eh WT: control n = 7, inflamed n = 7; tnf-α−/−: control n = 8, inflamed n = 8; representative results for three independent experiments (Mann–Whitney test and Bonferroni multiplicity correction for a and fh, Holm multiplicity correction for b. c, d: n = 8 for each group, representative results for three independent experiments (Mann–Whitney test and Holm multiplicity correction). Line: median, box: 25th–75th percentile, whiskers: range. *P < 0.05, **P < 0.01, ***P < 0.001, ****P < 0.000 1

Similar articles

Cited by

References

    1. Liu YC, Lerner UH, Teng YT. Cytokine responses against periodontal infection: protective and destructive roles. Periodontology 2000. 2010;52:163–206. doi: 10.1111/j.1600-0757.2009.00321.x. - DOI - PubMed
    1. Fransson C, et al. Severity and pattern of peri-implantitis-associated bone loss. J. Clin. Periodontol. 2010;37:442–448. doi: 10.1111/j.1600-051X.2010.01537.x. - DOI - PubMed
    1. Cobelli N, Scharf B, Crisi GM, Hardin J, Santambrogio L. Mediators of the inflammatory response to joint replacement devices. Nat. Rev. Rheumatol. 2011;7:600–608. doi: 10.1038/nrrheum.2011.128. - DOI - PubMed
    1. Schett G, Gravallese E. Bone erosion in rheumatoid arthritis: mechanisms, diagnosis and treatment. Nat. Rev. Rheumatol. 2012;8:656–664. doi: 10.1038/nrrheum.2012.153. - DOI - PMC - PubMed
    1. Zhuang J, et al. Osteoclasts in multiple myeloma are derived from Gr-1+CD11b+myeloid-derived suppressor cells. PLoS One. 2012;7:e48871. doi: 10.1371/journal.pone.0048871. - DOI - PMC - PubMed