. 2022 Apr 8;8(1):176.
doi: 10.1038/s41420-022-00987-6.

MAT2A facilitates PDCD6 methylation and promotes cell growth under glucose deprivation in cervical cancer

Affiliations

MAT2A facilitates PDCD6 methylation and promotes cell growth under glucose deprivation in cervical cancer

Hui Luo et al. Cell Death Discov. .

Abstract

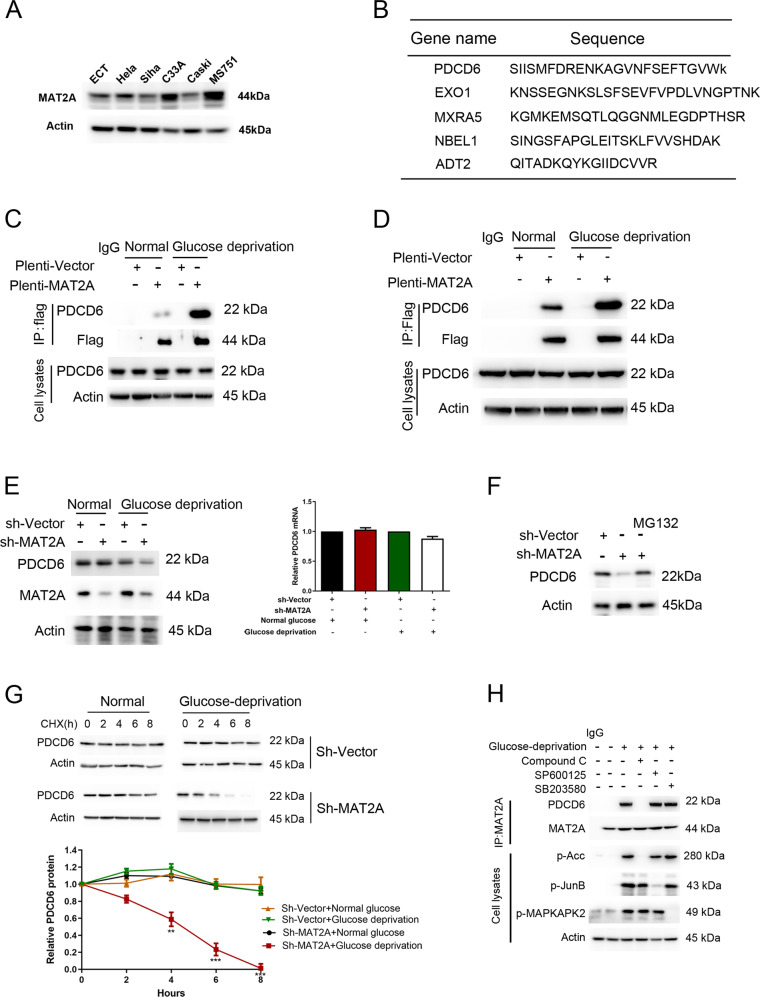
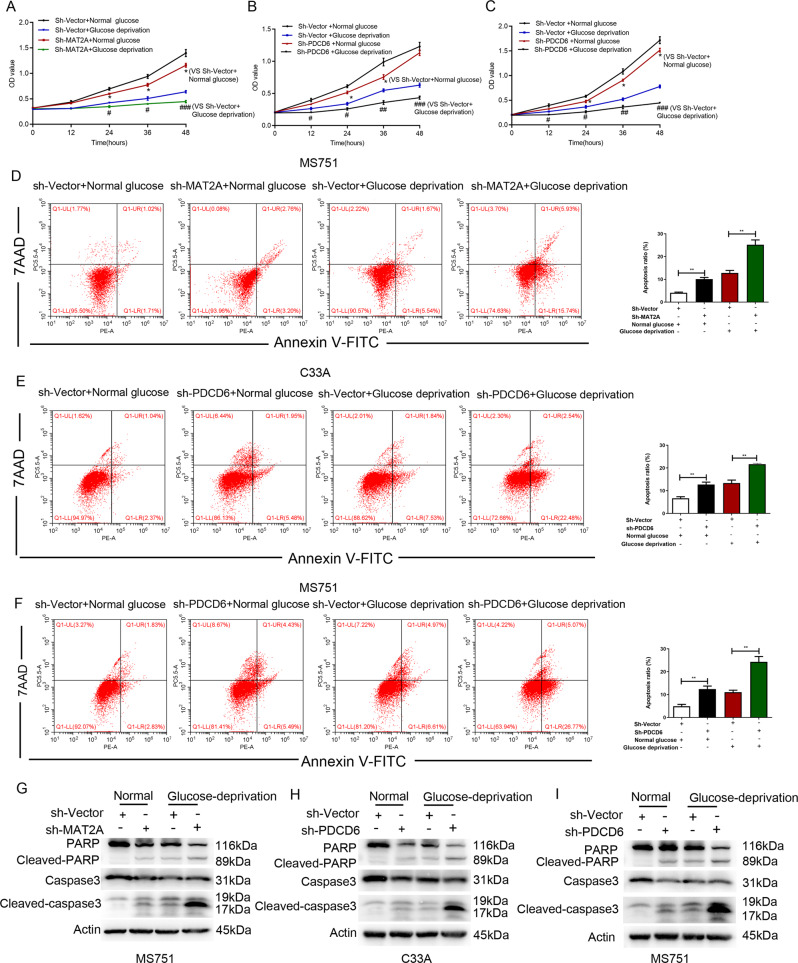
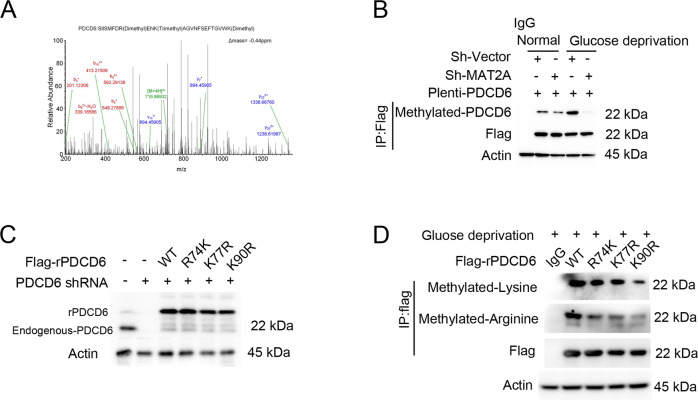
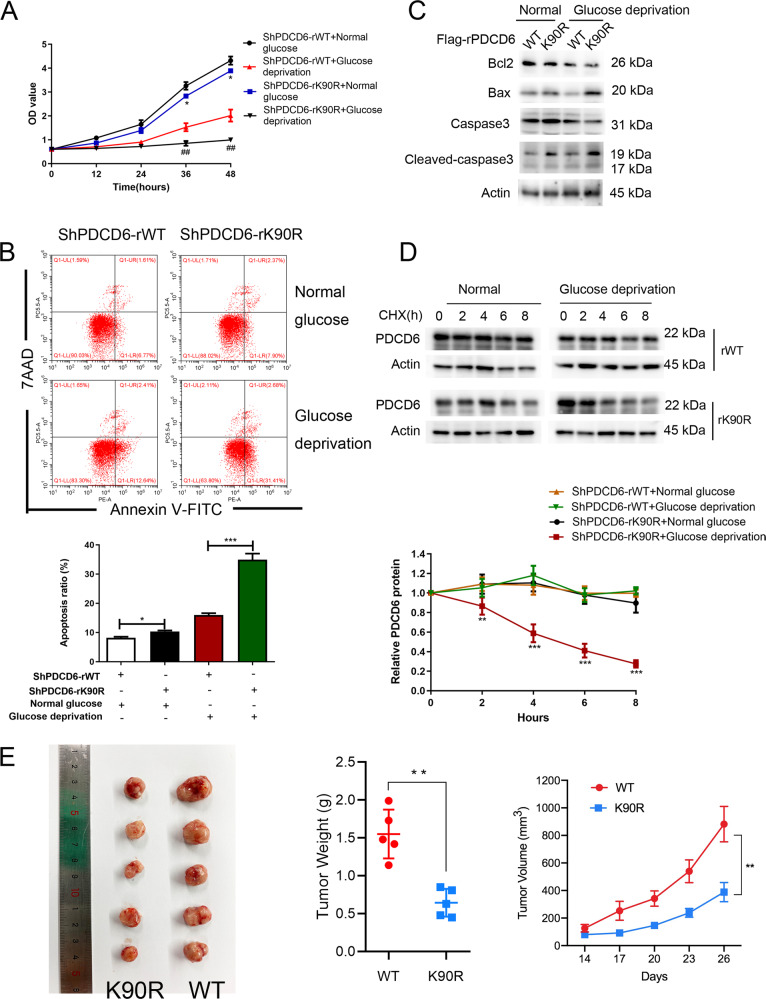
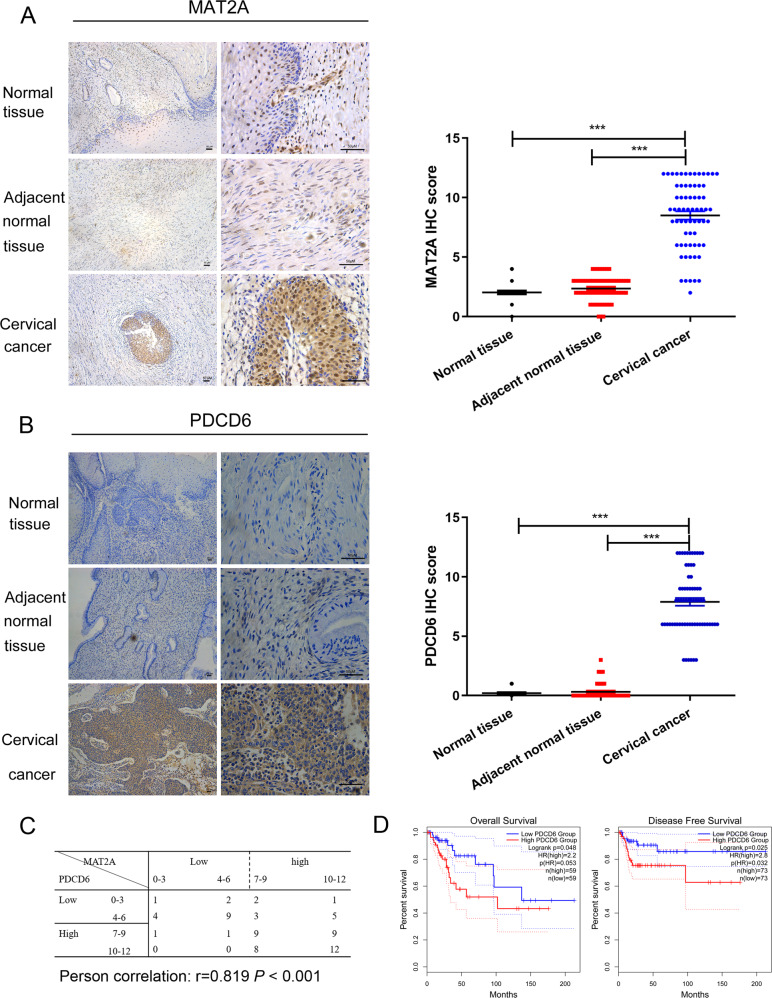
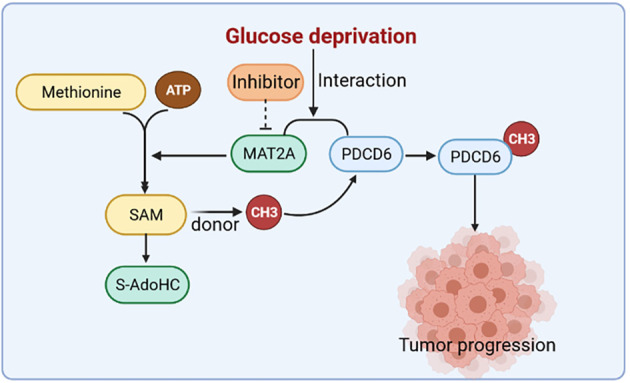
The underlying mechanisms of methionine adenosyltransferase 2 A (MAT2A)-mediated cervical cancer progression under nutrient stress are largely elusive. Therefore, our study aims to investigate molecular mechanism by which MAT2A-indcued cervical oncogenesis. The interaction between MAT2A and programmed cell death protein 6 (PDCD6) in cervical cancer cell lines was detected by immunoprecipitation, immunoblotting and mass spectrometric analysis. A panel of inhibitors that are linked to stress responsive kinases were utilized to detect related pathways by immunoblotting. Cell proliferation and apoptosis were investigated by CCK-8 and flow cytometry. Apoptosis related protein level of Bcl-2, Bax and Caspase-3 was also analyzed in cells with PDCD6 K90 methylation mutation. The association between MAT2A and PDCD6 was detected by immunohistochemistry and clinicopathological characteristics were further analyzed. We found that the interaction between MAT2A and PDCD6 is mediated by AMPK activation and facilitates PDCD6 K90 methylation and further promotes protein stability of PDCD6. Physiologically, expression of PDCD6 K90R leads to increased apoptosis and thus suppresses growth of cervical cancer cells under glucose deprivation. Furthermore, the clinical analysis indicates that the MAT2A protein level is positively associated with the PDCD6 level, and the high level of PDCD6 significantly correlates with poor prognosis and advanced stages of cervical cancer patients. We conclude that MAT2A facilitates PDCD6 methylation to promote cervical cancer growth under glucose deprivation, suggesting the regulatory role of MAT2A in cellular response to nutrient stress and cervical cancer progression.


Conflict of interest statement

The authors declare no competing interests.

Figures

Fig. 1
Fig. 1. Glucose deficiency induces MAT2A-PDCD6 interaction.
A Protein levels of MAT2A were detected by immunoblotting in normal cervical epithelial cells and cervical cancer cell lines. B The mass spectrometry analysis was performed in Flag tagged-MAT2A cell. MAT2A-associated proteins were listed. C MS751 cells transfected with or without 3×flag-MAT2A were cultured for 12 h under normal or glucose deprivation. Cellular extracts were subjected to immunoprecipitation with an anti-PDCD6 antibody. D C33A cells transfected with or without 3×flag-MAT2A were cultured for 12 h under normal or glucose deprivation. Cellular extracts were subjected to immunoprecipitation with an anti-PDCD6 antibody. E MS751 cells transfected with or without MAT2A shRNA were cultured for 12 h under normal or glucose deprivation. Western blotting analysis was used to determine MAT2A protein and PDCD6 protein levels (Left panel). Relative mRNA expression of PDCD6 was analyzed using RT-PCR (Right panel). F MS751 cells transfected with or without MAT2A shRNA were cultured for 12 h. The MS751 cells with MAT2A shRNA were treated with 10 μM MG132 for 6 h. Cell lysates were analyzed by Western blotting. G MS751 cells with stable expressing wild-type MAT2A or sh-MAT2A were cultured in glucose deprivation condition for 12 h, and then CHX (10 μg/ml) treatment was applied for different time courses (0, 2, 4, 6, 8 h) before harvest. The below panel showcases relative protein amounts of different groups. Error bar mean ± s.d. of triplicate experiments. ***P < 0.001, **P < 0.01, *P < 0.05. H MS751 cells with expressing Flag-MAT2A were pretreated with Compound C (10 μM), SP600125 (20 μM) and SB203580 (10 μM) for 1 h before being cultured with glucose deprivation for 12 h. Cellular extracts were subjected to immunoprecipitation with an anti-MAT2A antibody. Cell lysates were directly subjected to Western blotting.
Fig. 2
Fig. 2. PDCD6 promotes proliferation and inhibits apoptosis of MS751 cells.
A The proliferation of MS751 cells with or without MAT2A depletion was examined by CCK8 assay under normal or glucose deprivation. Error bar mean ± s.d. *P < 0.05. ###P < 0.001, #P < 0.05. B The proliferation of C33A cells with or without PDCD6 depletion was examined by CCK8 assay under normal or glucose deprivation. Error bar mean ± s.d. *P < 0.05. ###P < 0.001, ##P < 0.01, #P < 0.05. C The proliferation of MS751 cells with or without PDCD6 depletion was examined by CCK8 assay under normal or glucose deprivation. Error bar mean ± s.d. *P < 0.05. ###P < 0.001, ##P < 0.01, #P < 0.05. D Cell apoptosis of MS751 cells with or without MAT2A depletion was analyzed by Annexin V assay followed by flow cytometry (Left panel). Quantitative results were shown in Right panel. Error bar mean ± s.d. ***P < 0.001, *P < 0.05. E, F Cell apoptosis of C33A cells (E) and MS751 cells (F) with or without PDCD6 depletion was analyzed by Annexin V assay followed by flow cytometry (Left panel). Quantitative results were shown in right panel. Error bar mean ± s.d. **P < 0.01. GI Cell apoptosis was analyzed by immunoblotting with the indicated antibodies under normal or glucose deprivation in MS751 cells with or without MAT2A depletion (G), C33A cells with or without PDCD6 depletion (H) and MS751 cells with or without PDCD6 depletion (I).
Fig. 3
Fig. 3. PDCD6 is methylation at lysine 90 and increases the protein stability.
A MS751 cells with expressing 3×flag-MAT2A were cultured for 12 h under glucose deprivation. Immunoprecipitation was performed using Flag antibody, and the extracts were analyzed by mass spectrometry. The results of a mass spectrometric analysis revealed that 3 amino acids, R74, K77 and K90, of PDCD6 were methylated. B MS751 cells transfected with shMAT2A or 3×flag-PDCD6 were cultured for 12 h under normal or glucose deprivation. Cellular extracts were subjected to immunoprecipitation with an anti-methylated PDCD6 antibody. C MS751 cells were transfected a vector for control shRNA or PDCD6 shRNA and reconstituted with expression of WT rPDCD6, rPDCD6 R74K, rPDCD6 K77R or rPDCD6 K90R. Cell lysates were directly subjected to immunoblotting with the indicated antibodies. D MS751 cells were transfected with a vector for control shRNA or PDCD6 shRNA and reconstituted with expression of WT rPDCD6, rPDCD6 R74K, rPDCD6 K77R or rPDCD6 K90R. Cellular extracts were subjected to immunoprecipitation with an anti-arginine or lysine methylation antibody.
Fig. 4
Fig. 4. PDCD6 K90 mutation promotes tumor apoptosis in vitro and in vivo.
A The proliferation of MS751 cells with WT rPDCD6 or rPDCD6 K90R mutation was examined by CCK8 assay under normal or glucose deprivation. *P < 0.05, ##P < 0.01. B Cell apoptosis of MS751 cells with WT rPDCD6 or rPDCD6 K90R mutation was analyzed by Annexin V assay followed by flow cytometry (Top panel). Quantitative results were shown in bottom panel. Error bar mean ± s.d. ***P < 0.001, *P < 0.05. C MS751 cells with WT rPDCD6 or rPDCD6 K90R mutation were analyzed with immunoblotting with the indicated antibodies under normal or glucose deprivation. D MS751 cells with depleted PDCD6 and reconstituted expression of WT rPDCD6 or rPDCD6 K90R were treated with CHX (10 μg/ml) for 8 h under glucose deprivation. The below panel showed relative protein amounts of different groups. Error bar mean ± s.d. of triplicate experiments. ***P < 0.001, **P < 0.01. E K90R mutation inhibits xenograft tumor growth. Subcutaneous xenograft experiment was performed in nude mice using MS751 rPDCD6 WT and rPDCD6 K90R stable cell lines. Diameters of tumors were measured and tumor volumes were calculated. **P < 0.01.
Fig. 5
Fig. 5. MAT2A and PDCD6 are highly expressed in cervical cancer tissues and are correlated with poor prognosis with cervical cancer patients.
A Immunohistochemical staining with MAT2A antibody was performed in 67 cervical cancer specimens and 67 normal cervical specimens. Representative photos of tumors versus the normal tissue and adjacent normal tissues were shown (magnification: ×100 and ×400, left panel). Comparative analysis of MAT2A expression among normal cervical tissue, adjacent normal tissue and cervical cancer specimen was shown (right panel).***P < 0.001. Scar bars: 50 μM. B Immunohistochemical staining with PDCD6 antibody was performed in 67 cervical cancer specimens and 67 normal cervical specimens. Representative photos of tumors versus the normal tissue and adjacent normal tissue was shown (magnification: ×100 and ×400, left panel). Comparative analysis of PDCD6 expression among normal cervical tissue, adjacent normal tissue and cervical cancer specimen was shown (right panel). ***P < 0.001. Scar bars: 50 μM. C Semiquantitative scoring and correlation analysis indicating the correlation between MAT2A and PDCD6 (r = 0.819, P < 0.001). D Prognostic analysis of PDCD6 gene expression in cervical cancer patients (GEPIA2) was illustrated. Overall survival (OS) and disease-free survival (DFS) analysis were performed to show the survival status in the TCGA cohort via GEPIA2. Kaplan–Meier curves were plotted with P-values and HRs by log-rank tests and Cox regression models.
Fig. 6
Fig. 6. The schematic model showing the interaction between MAT2A and PDCD6 under glucose deprivation in cervical cancer cells.
MAT2A facilitates PDCD6 methylation to promote cervical cancer growth under glucose deprivation.

Similar articles

Cited by

References

    1. Sung H, Ferlay J, Siegel RL, Laversanne M, Soerjomataram I, Jemal A, et al. Global Cancer Statistics 2020: GLOBOCAN Estimates of Incidence and Mortality Worldwide for 36 Cancers in 185 Countries. CA Cancer J Clin. 2021;71:209–49. doi: 10.3322/caac.21660. - DOI - PubMed
    1. Shillitoe EJ. Papillomaviruses as targets for cancer gene therapy. Cancer Gene Ther. 2006;13:445–50. doi: 10.1038/sj.cgt.7700926. - DOI - PubMed
    1. Boroughs LK, DeBerardinis RJ. Metabolic pathways promoting cancer cell survival and growth. Nat Cell Biol. 2015;17:351–9. doi: 10.1038/ncb3124. - DOI - PMC - PubMed
    1. Kim J, DeBerardinis RJ. Mechanisms and implications of metabolic heterogeneity in cancer. Cell Metab. 2019;30:434–46. doi: 10.1016/j.cmet.2019.08.013. - DOI - PMC - PubMed
    1. Boukouris AE, Zervopoulos SD, Michelakis ED. Metabolic enzymes moonlighting in the nucleus: metabolic regulation of gene transcription. Trends Biochem Sci. 2016;41:712–30. doi: 10.1016/j.tibs.2016.05.013. - DOI - PubMed