. 2022 Apr 8;13(1):1928.
doi: 10.1038/s41467-022-29562-4.

Mechanical control of innate immune responses against viral infection revealed in a human lung alveolus chip

Affiliations

Mechanical control of innate immune responses against viral infection revealed in a human lung alveolus chip

Haiqing Bai et al. Nat Commun. .

Abstract

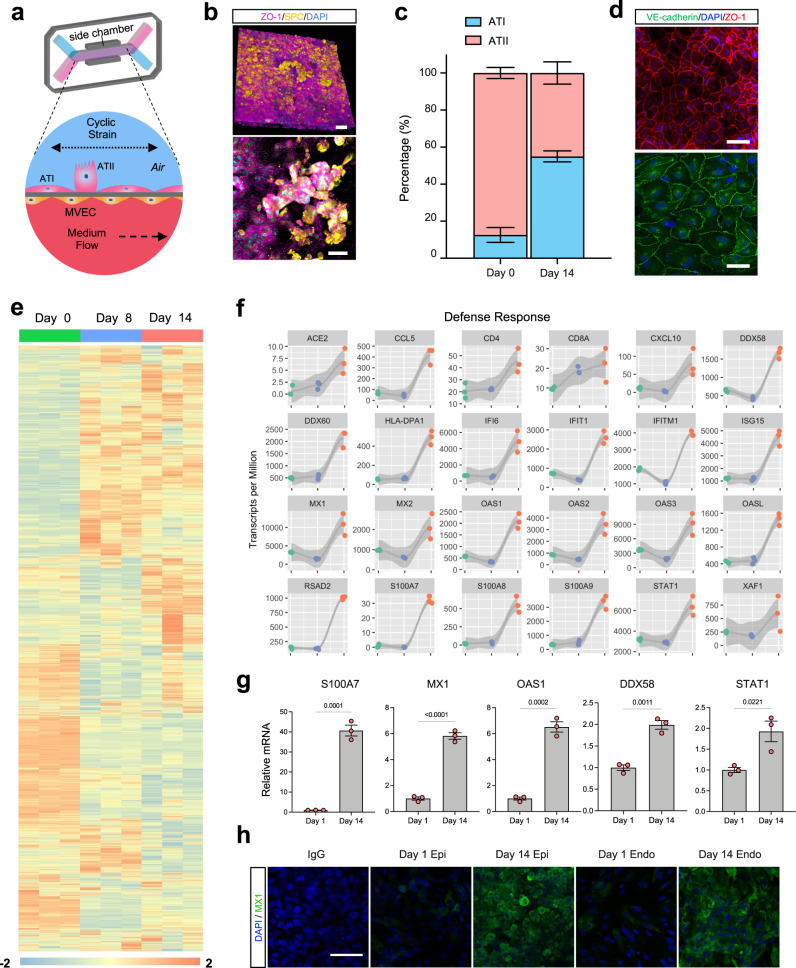
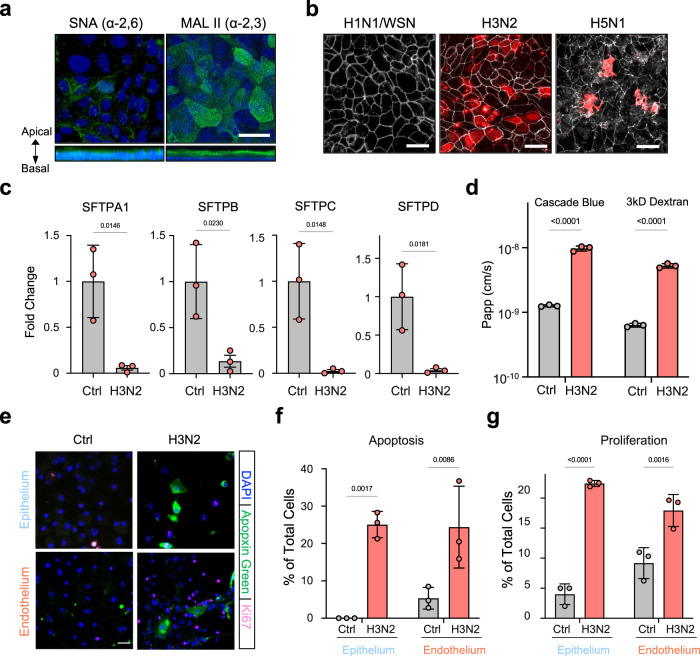
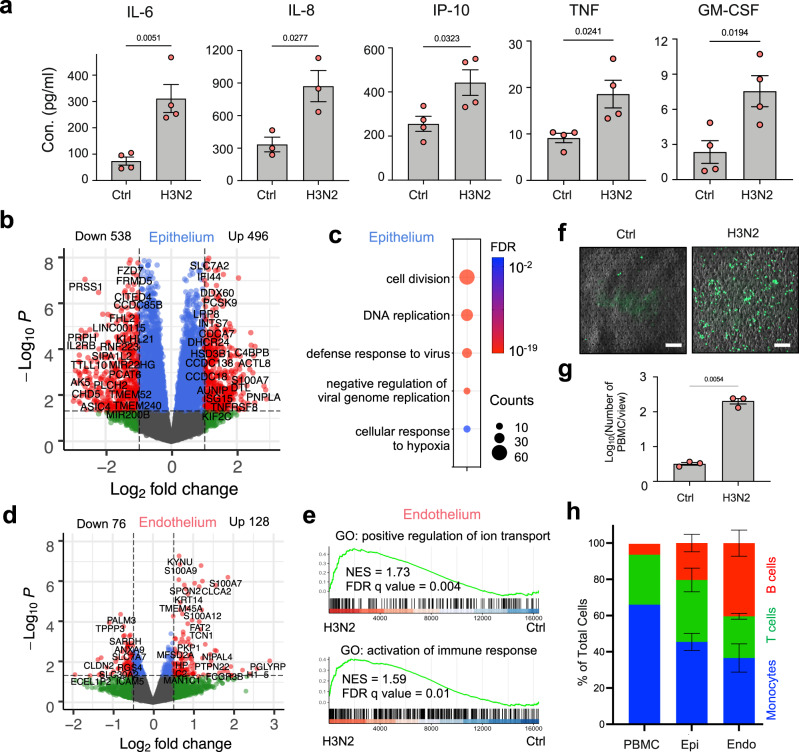
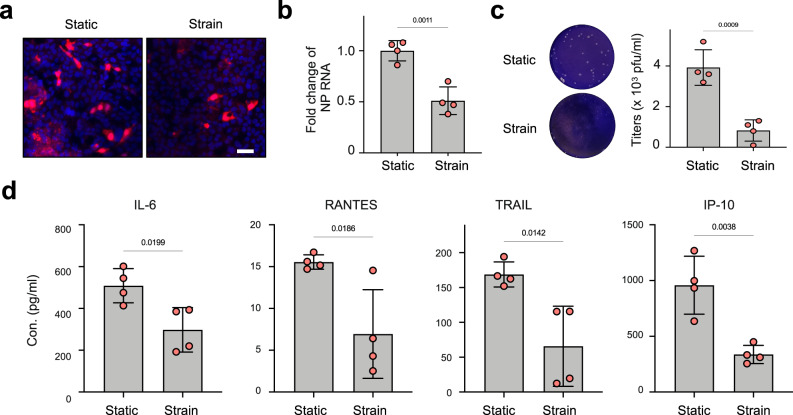
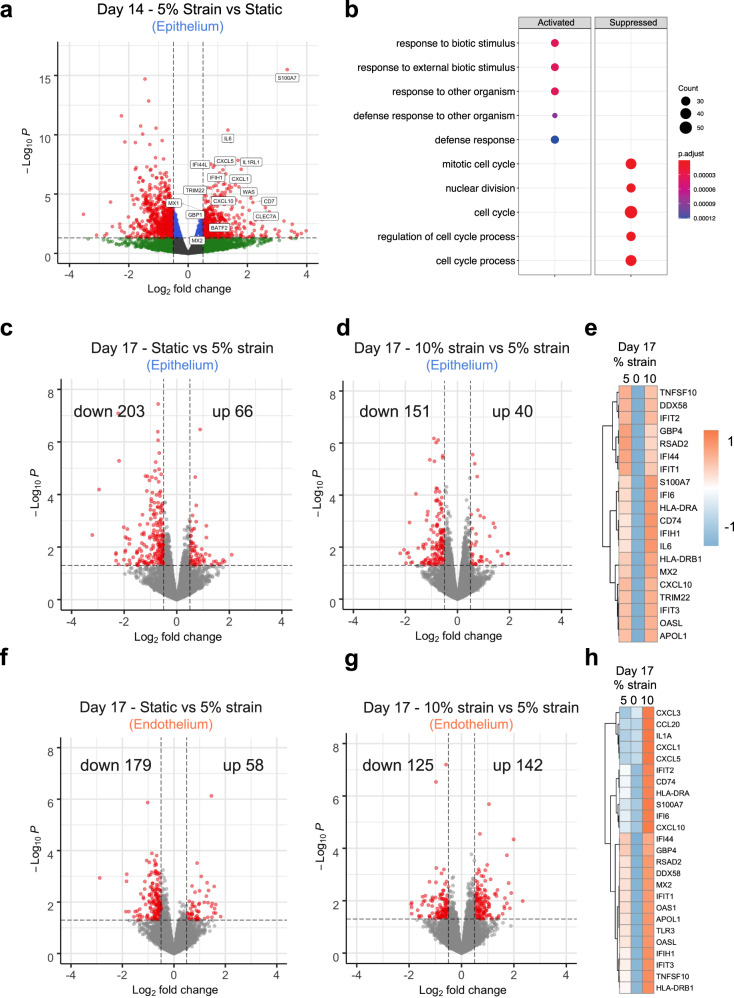
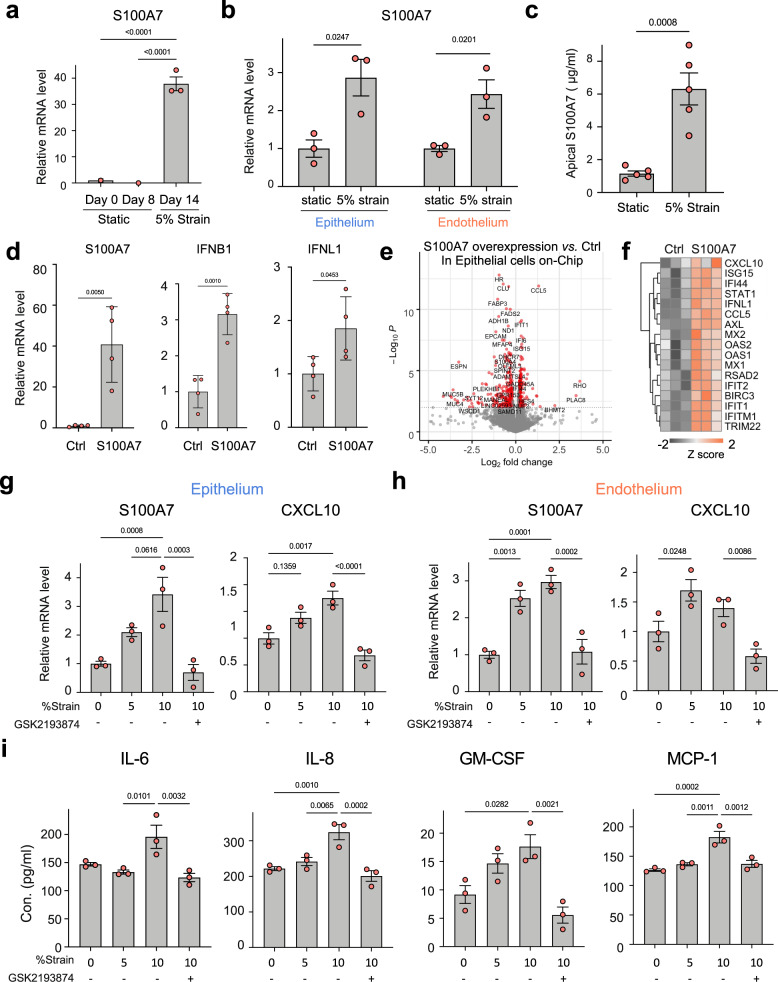
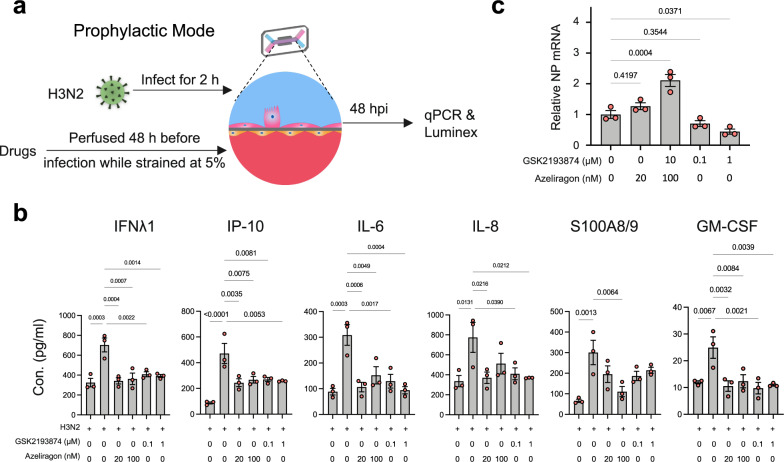
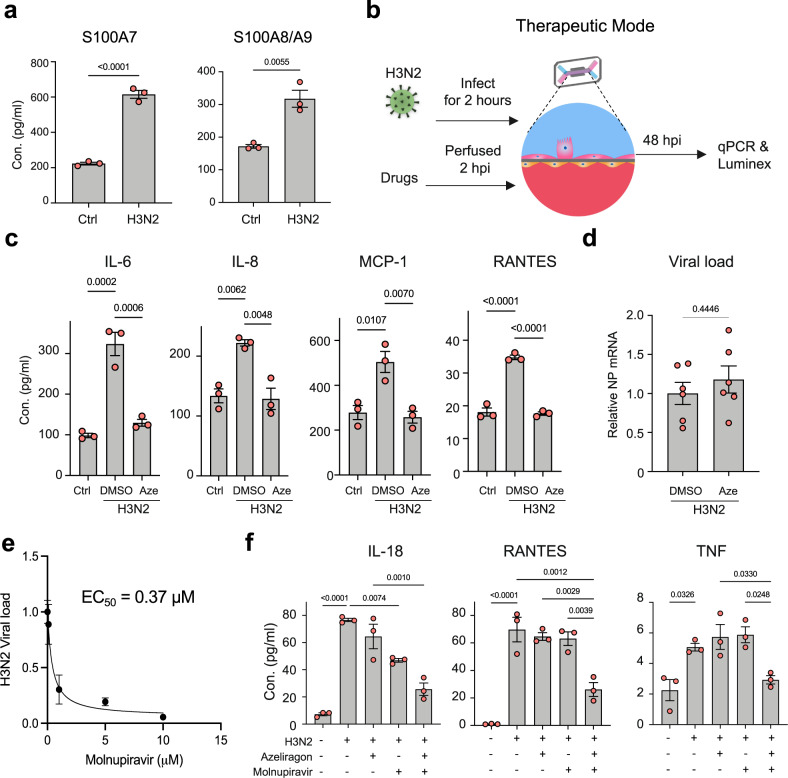
Mechanical breathing motions have a fundamental function in lung development and disease, but little is known about how they contribute to host innate immunity. Here we use a human lung alveolus chip that experiences cyclic breathing-like deformations to investigate whether physical forces influence innate immune responses to viral infection. Influenza H3N2 infection of mechanically active chips induces a cascade of host responses including increased lung permeability, apoptosis, cell regeneration, cytokines production, and recruitment of circulating immune cells. Comparison with static chips reveals that breathing motions suppress viral replication by activating protective innate immune responses in epithelial and endothelial cells, which are mediated in part through activation of the mechanosensitive ion channel TRPV4 and signaling via receptor for advanced glycation end products (RAGE). RAGE inhibitors suppress cytokines induction, while TRPV4 inhibition attenuates both inflammation and viral burden, in infected chips with breathing motions. Therefore, TRPV4 and RAGE may serve as new targets for therapeutic intervention in patients infected with influenza and other potential pandemic viruses that cause life-threatening lung inflammation.


Conflict of interest statement

D.E.I. is a founder, board member, SAB chair, and holds equity in Emulate Inc.; D.E.I., H.B. L.S., R.P., and A.J. are inventors on relevant patent applications hold by Harvard University (US 63/135,834 & US 63/187,498). The other authors declare no competing interests.

Figures

Fig. 1
Fig. 1. The Human alveolus chip.
a Schematic of human alveolus chip with primary alveolar epithelial type I (ATI) and type II (ATII) cells lining the upper surface of the porous ECM-coated membrane in the air channel with and pulmonary microvascular endothelial cells (MVEC) on the lower surface of the same membrane in the basal vascular channel that is continuously perfused with medium. The entire membrane and adherent alveolar-capillary interface are exposed to physiological cyclic strain by applying cyclic suction to neighboring hollow chambers (gray) within the flexible PDMS microfluidic device. b Two magnifications of immunofluorescence micrographs showing the distribution of ZO1-containing tight junctions and ATII cell marker surfactant protein C (SPC) in the epithelium of the alveolus chip (bar, 50 μm). c Graph showing the percentages of ATI and ATII cells at the time of plating and 14 days after culture on-chip. Data represent mean ± SD; n = 3 biological chip replicates. d Immunofluorescence micrographs showing alveolar epithelial cells (top) and endothelial cells (bottom) within the alveolus chip stained for ZO1 and VE-cadherin, respectively (scale bar, 50 μm). e Temporal gene expression profiles in the alveolar epithelial cells on-chip. f Smoothed regressions of time course showing expression of selected genes that are involved in host defense response in epithelial cells cultured for up to 2 weeks on-chip; n = 3 biological chip replicates. Gray zone indicates the 95% confidence interval for predictions from a linear model; green, day 0; blue, day 8; pink, day 14. g Graph showing the mRNA levels of key genes from f in the epithelial cells of alveolus chips at day 1 and day 14 after culture. Data represent mean ± SD, n = 3 biological chip replicates independent of the RNA-seq samples. Unpaired two-tailed t-test. h Immunofluorescence staining showing increased MX1 expression in both alveolar epithelial cells and microvascular endothelial cells on-chip at day 14 compared to day 1 of culture. Scale bar: 50 μm. Source data are provided as a Source Data file.
Fig. 2
Fig. 2. Cellular phenotyping after influenza A virus infection of the human alveolus chip.
a Top and side fluorescence views of the alveolar epithelium cultured on-chip and stained for α−2,3-linked sialic acid or α−2,6-linked sialic acid using Maackia Amurensis Lectin II (MAL II) and Sambucus nigra agglutinin (SNA), respectively (bar, 50 µm). b Top fluorescence views of the alveolar epithelium on-chip infected with three different influenza virus strains (WSN (H1N1), HK/68 (H3N2), or HK/97 (H5N1) at MOI = 1) and stained for viral nuclear protein (NP) in red and ZO-1 in white. Scale bar, 50 µm. c Graph showing decreased mRNA levels of surfactant genes by HK/68 (H3N2) virus infection at MOI = 1 compared with uninfected as control (Ctrl). d Graph showing increased lung permeability to cascade blue and 3 kD dextran by H3N2 infection on-chip. e Immunofluorescent images showing increased apoptosis as indicated by Apopxin Green staining and cell proliferation as indicated by Ki67 staining (bar, 50 µm). f, g Graph showing quantifications of cell apoptosis (f) and proliferation (g) at 24 h after H3N2 infection on-chip. For c, d, f, g, data represent mean ± SD.; n = 3 biological chip replicates; unpaired two-tailed t-test. Source data are provided as a Source Data file.
Fig. 3
Fig. 3. Systematic inflammation after influenza A virus infection of the human alveolus chip.
a Concentrations of the indicated cytokines at day 17 measured by Luminex assay in the effluent of the vascular channels of alveolus chips infected with HK/68 (H3N2) virus (MOI = 1) versus control untreated chips (Ctrl) at 48 hpi in the presence of 5% strain. Data represent mean ± SD; n = 4 biological chip replicates except for IL-8 (n = 3) from two independent experiments; unpaired two-tailed t-test. b Volcano plot of DEGs in epithelial cells from HK/68 (H3N2)-infected alveolus chips (MOI = 1) compared to control uninfected chips. P values were adjusted using Bonferroni correction for multiple comparisons. c Dot plot visualization of enriched biological processes in epithelial cells of HK/68 (H3N2) infected alveolus chips (MOI = 1). d Volcano plot of DEGs in endothelial cells from HK/68 (H3N2)-infected alveolus chips (MOI = 1) compared to control uninfected chips. P values were adjusted using Bonferroni correction for multiple comparisons. e Gene Set Enrichment Analysis (GSEA) plots showing the significant enrichment of two gene sets in endothelial cells from HK/68 (H3N2)-infected (MOI = 1) compared with control uninfected alveolus chips. f Fluorescence imaging for CellTracker Green-labeled PBMCs at the endothelial cell surface 2 hours after perfusion under static conditions through the vascular channel of uninfected control (Ctrl) versus HK/68 (H3N2)-infected alveolus chips at 24 hpi (MOI = 1). Scale bar: 100 µm. g Graph showing number of PBMCs recruited to the endothelium in response to infection by HK/68 (H3N2) (MOI = 1) and the baseline level of PBMCs in uninfected chips (Ctrl). Data represent mean ± SD. n = 3 biological chip replicates; unpaired two-tailed t-test. h Graph showing the relative percentages of monocytes, T cells, and B cells before being added to the chips or in the epithelial (epi) or endothelial cell channel (endo) 2 h after being added to endothelial channel of the chips. Data represent mean ± SD.; n = 3 biological chip replicates. Source data are provided as a Source Data file.
Fig. 4
Fig. 4. Cyclic mechanical strain inhibits viral infection in alveolus chip.
a Immunostaining of influenza virus NP (red) in alveolus chips that are cultured under static conditions (Static) or under 5% and 0.25 Hz cyclic mechanical strains (Strain) for 48 h and then infected with HK/68 (H3N2) (MOI = 1) for another 48 h (blue, DAPI-stained nuclei; scale bar, 50 µm). b Graph showing fold changes in RNA levels of influenza virus NP in the epithelium within alveolus chips from a as measured by qPCR. Data represent mean ± SD; n = 4 biological chip replicates; unpaired two-tailed t-test. c Images (left) and graph (right) showing plaque titers of virus in the apical washes of alveolus chips from a. Data represent mean ± SD; n = 4 biological chip replicates; unpaired two-tailed t-test. d Graphs showing cytokine production in the vascular effluents of alveolus chips from a at 48 hpi. Data represent mean ± SD; n = 4 biological chip replicates; unpaired two-tailed t-test. Source data are provided as a Source Data file.
Fig. 5
Fig. 5. Mechanical strain reversibly regulates innate immune response in alveolus chip in uninfected chips.
a Volcano plot of DEGs comparing epithelial cells from alveolus chips under static or 5% strain culture condition for 4 days. DEGs (Padj < 0.05) with a fold change >1.5 (or <−1.5) are indicated in red. The names of DEGs belonging to the innate immune pathway are labeled. b Dot plot showing the biological processes activated or suppressed by 5% strain vs. static culture condition in alveolus chips from a. c, d Volcano plots of DEGs showing the effects of switching 5% strain to static for 2 days on epithelial cells on-chip (c) and the effects of increasing 5% strain to 10% strain for 2 days on epithelial cells on-chip (d). e Heat map showing differentially expressed innate immune genes in epithelial cells under different magnitudes of mechanical strains. f, g Volcano plots of DEGs showing the effects of switching 5% strain to static for 2 days on endothelial cells on-chip (f) and the effects of increasing 5% strain to 10% strain for 2 days on endothelial cells on-chip (g). h Heat map showing differentially expressed innate immune genes in endothelial cells under different magnitudes of mechanical strains. P values were adjusted using Bonferroni correction for multiple comparisons in ad, f, and g.
Fig. 6
Fig. 6. Mechanical strain-induced S100A7 increases innate immunity.
a Graph showing the levels of S100A7 mRNA (transcripts per million) in the epithelial cells of alveolus chips at different time points of culture, measured by RNA-seq. Data represent mean ± SD; n = 3 biological chip replicates; one-way ANOVA with Bonferroni multiple comparisons test. b Graph showing the mRNA level of S100A7 in epithelial cells or in endothelial cells when cultured under 5% strain or under static conditions for 4 days (day 10–14) on-chip. Data are shown as mean ± SD; n = 3 biological chip replicates; unpaired two-tailed t-test. c Graph showing the protein levels of S100A7 in the apical washes of alveolus chips under strain or static condition, measure by ELISA. Data are shown as mean ± SEM; n = 5 biological chip replicates from 2 independent experiments; unpaired two-tailed t-test. d Graphs showing fold changes in mRNA levels of S100A7, IFNβ1, and IFNλ1 in epithelial cells of the alveolus chips that were transfected with human S100A7-expressing plasmid or the vector control (Con) for 48 h. Data are shown as mean ± SD; n = 4 biological chip replicates; unpaired two-tailed t-test. e Volcano plots of DEGs showing the effects of S100A7 overexpression on transcriptome in epithelial cells of the alveolus chips that were transfected with S100A7-expressing plasmid for 2 days with the empty plasmid as a control (Ctrl). P values were adjusted using Bonferroni correction for multiple comparisons. f Heat map showing that S100A7 upregulates the expression of many genes involved in innate immune response in epithelial cells of the alveolus chips. n = 3 biological chip replicates. Graphs showing the mRNA levels of S100A7 and CXCL10 in epithelial cells (g) and endothelial cells (h) and cytokine levels on chips cultured under static condition (0% strain), 5% strain, 10% strain, and 10% strain perfused with or without 1 µM TRPV4 inhibitor GSK2193874 for 48 h (i). Data in gi represent mean ± SEM; n = 3 biological chip replicates; one-way ANOVA with Bonferroni multiple comparisons correction. Source data are provided as a Source Data file.
Fig. 7
Fig. 7. RAGE mediates mechanical strain-induced activation of innate immunity during infection.
a Illustration of the experimental protocol involving prophylactic treatment with signaling inhibitors for 48 h prior to viral infection of the human alveolus chip. b Graphs showing cytokine levels on chips. c Graph showing mRNA levels of H3N2 NP in epithelial cells treated with azeliragon or GSK2193874 at indicated doses on-chip. Data in b, c represent mean ± SEM; n = 3 biological chip replicates; one-way ANOVA with Dunnett’s multiple comparisons correction. Source data are provided as a Source Data file.
Fig. 8
Fig. 8. RAGE inhibitor azeliragon suppresses viral host inflammation responses and produces synergistic effects with molnupiravir when administered 2 h after infection.
a Graph showing the protein levels of S100A7 (left) and S100A8/A9 (right) in the vascular effluents of the alveolus chips at 48 hpi with HK/68 (H3N2) virus (MOI = 1) in the presence of 5% strain. Data represent mean ± SD; n = 3 biological chip replicates; unpaired two-tailed t-test. b Illustration of drug study on the human alveolus chip. c Graphs showing the levels of cytokines in the vascular effluents of alveolus chips that were uninfected (Ctrl), or infected with HK/68 (H3N2) (MOI = 1) in the presence or absence of 100 nM Azeliragon (Aze). Data are shown as mean ± SD; n = 3 biological chip replicates; one-way ANOVA with Dunnett’s multiple comparisons test. d Graph showing that azeliragon (100 nM) had no effect on viral load when administered 2 h after infection. Data are shown as mean ± SEM; n = 6 biological chip replicates; unpaired two-tailed t-test. e Plot showing the effect of molnupiravir at different concentrations on H3N2 viral load determined on human Alveolus Transwell. Data are shown as mean ± SD; n = 2 biological replicates. EC50 (half maximal effective concentration) was determined by a variable slope fitting with four parameters. f Graphs showing that azeliragon (100 nM) and molnupiravir (500 nM) drug combo synergistically reduce the levels of cytokines in the vascular effluents of alveolus chips infected with H3N2 virus. Data are shown as mean ± SEM; n = 3 biological chip replicates; one-way ANOVA with Dunnett’s multiple comparisons test. Source data are provided as a Source Data file.

Similar articles

Cited by

References

    1. Hannezo E, Heisenberg CP. Mechanochemical feedback loops in development and disease. Cell. 2019;178:12–25. - PubMed
    1. Li J, et al. The strength of mechanical forces determines the differentiation of alveolar epithelial cells. Dev. Cell. 2018;44:297–312.e295. - PubMed
    1. Lopez-Alonso, I. et al. Preventing loss of mechanosensation by the nuclear membranes of alveolar cells reduces lung injury in mice during mechanical ventilation. Sci. Transl. Med.10.1126/scitranslmed.aam7598 (2018). - PubMed
    1. Huh D, et al. Reconstituting organ-level lung functions on a chip. Science. 2010;328:1662–1668. - PMC - PubMed
    1. Huh D, et al. A human disease model of drug toxicity-induced pulmonary edema in a lung-on-a-chip microdevice. Sci. Transl. Med. 2012;4:159ra147. - PMC - PubMed