. 2022 Apr 8;12(1):5907.
doi: 10.1038/s41598-022-09666-z.

Multi-week prediction of livestock chill conditions associated with the northwest Queensland floods of February 2019

Affiliations

Multi-week prediction of livestock chill conditions associated with the northwest Queensland floods of February 2019

Tim Cowan et al. Sci Rep. .

Abstract

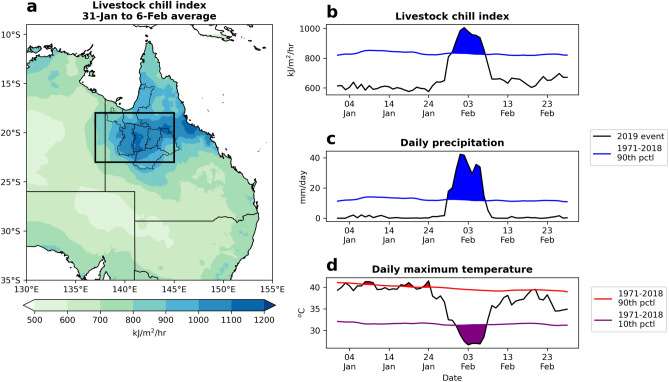
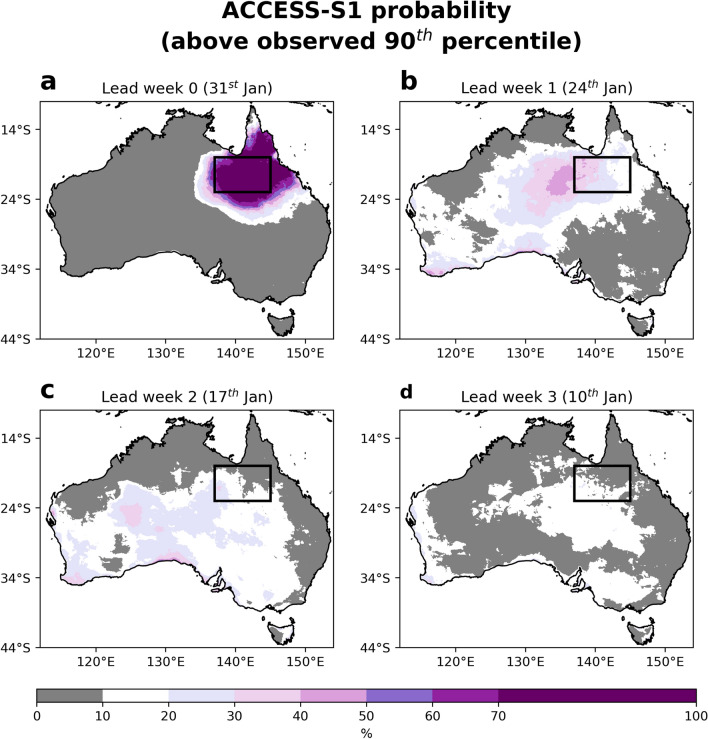
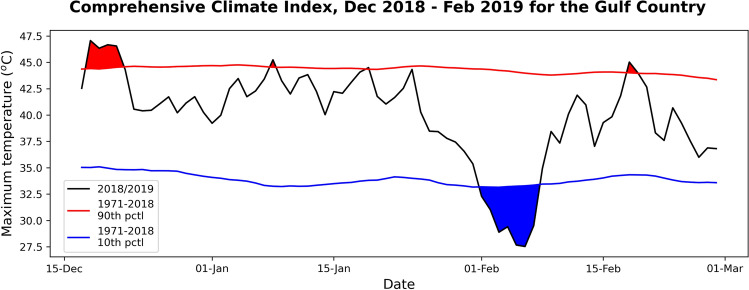
The compound extreme weather event that impacted northern Queensland in February 2019 featured record-breaking rainfall, persistent high wind gusts and relatively cold day-time temperatures. This caused livestock losses numbering around 500,000 in the northwest Queensland Gulf region. In this study, we examine the livestock chill conditions associated with this week-long compound weather event and its potential for prediction from eleven world-leading sub-seasonal to seasonal (S2S) forecast systems. The livestock chill index combines daily rainfall, wind and surface temperature data. Averaged over the event week, the potential heat loss of livestock was in the moderate to high category, with severe conditions on the day of peak rainfall (5 February). Using calibrated forecasts from the Bureau of Meteorology's S2S forecast system, ACCESS-S1, a 1-week lead prediction showed a 20-30% probability of extreme livestock chill conditions over the northwest Queensland Gulf region, however the highest probabilities were located to the west of where the greatest livestock impacts were observed. Of the remaining ten S2S systems, around half predicted a more than 20% chance of extreme conditions, more than twice the climatological probability. It appears that the prediction accuracy arose from the skilful forecasts of extreme rainfall, as opposed to cold day-time temperature and strong wind forecasts. Despite a clear association between the observed extreme weather conditions and an active Madden-Julian Oscillation (MJO) event stalling in the western Pacific, the majority of 1-week lead S2S forecasts showed little indication of a slow-down in the MJO. As the livestock chill index was developed for southern Australian sheep, it may not be the best metric to represent the effects of exposure on tropical cattle breeds. Hence, this study draws attention to the need for tailored diagnostics that better represent the cold effects of summer tropical cyclones and tropical depressions on northern Australian livestock.


Conflict of interest statement

The authors declare no competing interests.

Figures

Figure 1
Figure 1
Total livestock losses during the February 2019 floods. The map shows the total livestock losses in the Shires of northwest Queensland during the early February floods. Livestock include cattle, sheep, horses and goats. The Burke Shire (Bu) reported no livestock loss, whilst the McKinlay Shire (MK) reported the highest losses, with 130,000 + cattle deaths. Data from: https://www.beefcentral.com/news/final-tally-reached-for-northwest-qlds-february-2019-flood-losses/.
Figure 2
Figure 2
Average livestock chill conditions during the February 2019 floods. (a) Spatial pattern of the livestock chill index averaged over 31 January to 6 February 2019. (b) Area averaged livestock chill index (black line) over the Gulf region (rectangular region, 137–145° E, 18–23° S) from 1 January to 28 February, with a multi-year daily 90th percentile for 1971–2018 (blue line) and days above the 90th percentile (shading). (c,d) As in (b) but for  (c) daily precipitation and (d) daily maximum temperature, with the 90th (red line) and 10th (purple line) percentiles. The method for calculating the multi-year daily percentile is detailed in the Data and methods. The Gulf region represents the area with the highest livestock losses during the week-long event (Fig. 1).
Figure 3
Figure 3
Lead week 0–3 forecasts of the chance of extreme livestock chill conditions during the February 2019 floods from ACCESS-S1. Shown are the ACCESS-S1 forecasts of the livestock chill index being above the observed multi-year (1971–2018) daily 90th percentile, targeted to the week of 31 January– 6 February, for (a) lead week 0; 31 January, (b) lead week 1; 24 January, (c) lead week 2; 17 January and (d) lead week 3; 17 January. The Gulf region is shown by the black rectangle.
Figure 4
Figure 4
Lead week 1 forecast of the chances for extreme livestock chill conditions from ACCESS-S1 and ten S2S forecast systems. Shown are the model forecasts of livestock chill index being above their respective hindcast multi-year daily 90th percentile, targeted to the week of 31 January to 6 February 2019, for (a) ACCESS-S1, (b) CMA, (c) ECCC, (d) ECMWF, (e) HMCR, (f) ISAC-CNR, (g) JMA, (h) KMA, (i) Météo-France (CNRM), (j) NCEP and (k) UKMO. Each model's hindcast years are listed in the Table 1, and the ensemble forecast size is shown in the bottom left corner of the panels.
Figure 5
Figure 5
Time evolution of multi-member ensemble MJO predictions for nine S2S models, initialised on 24 January 2019 (lead week 1 forecast). Shown are the evolutions from late January (blue) through February (red) into March (green) for (a) CMA, (b) ECCC, (c) ECMWF, (d) HMCR, (e) ISAC-CNR, (f) JMA, (g) Météo-France (CNRM), (h) NCEP and (i) UKMO. Note, JMA is initialised on 23 January, hence its first date is 24 January. Despite not all the MJO forecasts extending to March, all cover the early February flood event. The observed MJO trajectory is shown in Suppl. Fig. 6g.
Figure 6
Figure 6
A comparison of daily MSLP anomalies averaged over the 2–6 February 2019 from reanalysis and lead week 1 forecasts from S2S multi-model experiment ensembles. Shown are the weighted multi-model ensemble average of lead week 1 forecasts of daily MSLP anomalies from six S2S models (ECCC, ECMWF, ISAC-CNR, JMA, Météo-France, NCEP) where individual member predictions showed (a) an active MJO pulse to stall for at least 17 days in phases 6 and 7; and (b) an active MJO pulse to stall for less than 13 days in phases 6 and 7. (c) NCEP reanalysis average for 2–6 February 2019 for the period 1981–2010. Each individual S2S forecast is referenced to its own hindcast climatology, with both the reanalysis and hindcast climatology smoothed using an 11-day running mean.
Figure 7
Figure 7
Comprehensive climate index over the inland Gulf region in late 2018/early 2019. Area-averaged comprehensive climate index (black line) over the Gulf region from late December 2018 to late February 2019, with a multi-year daily 10th and 90th percentile for 1971–2018 (blue and red lines, respectively) and days below/above the percentile (blue/red shading). The index has been calculated using maximum daily temperatures, daily maximum relative humidity, daily averaged wind speed, and daily-averaged solar radiation using the adjustment factors and equations listed in Mader et al..

References

    1. Cowan T, et al. Forecasting the extreme rainfall, low temperatures, and strong winds associated with the northern Queensland floods of February 2019. Weather Clim. Extrem. 2019;26:100232. doi: 10.1016/j.wace.2019.100232. - DOI
    1. Hall, T. J. Pasture recovery, land condition and some other observations after the monsoon flooding, chill event in north-west Queensland in Jan–Mar 2019. (2020).
    1. Gissing A, O’Brien J, Hussein S, Evans J, Mortlock T. Townsville 2019 flood: Insights from the field. Risk Front. Brief. Note. 2019;389:1–8.
    1. Deloitte. The social and economic cost of the North and Far North Queensland Monsoon Trough. (2019).
    1. Wellington, M. Development of indicative Temperature Humidity Index charts for northern Australia. (Meat & Livestock Australia Limited, 2019). 10.13140/RG.2.2.27406.59201

Publication types