. 2022 Apr 8;12(1):5926.
doi: 10.1038/s41598-022-09998-w.

Integrated analysis of expression profiles with meat quality traits in cattle

Affiliations

Integrated analysis of expression profiles with meat quality traits in cattle

Yunxiao Li et al. Sci Rep. .

Abstract

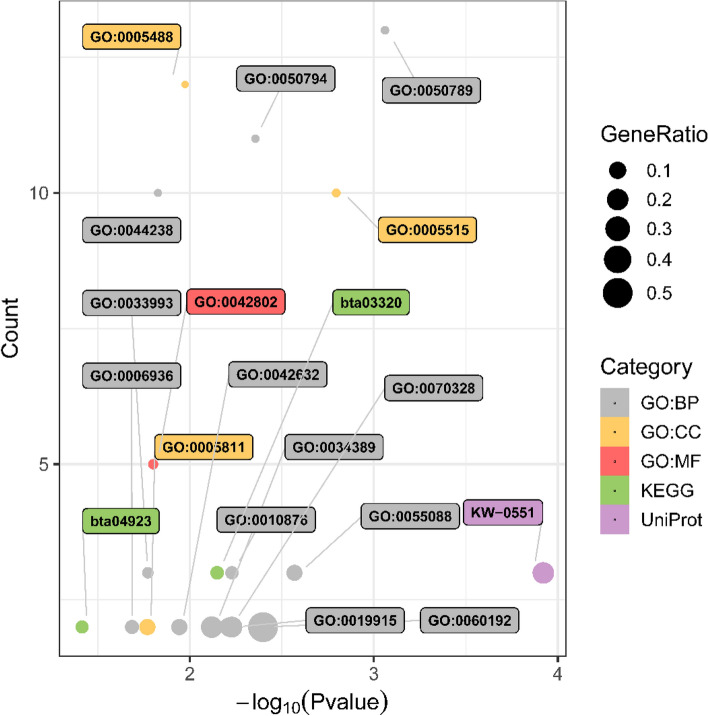
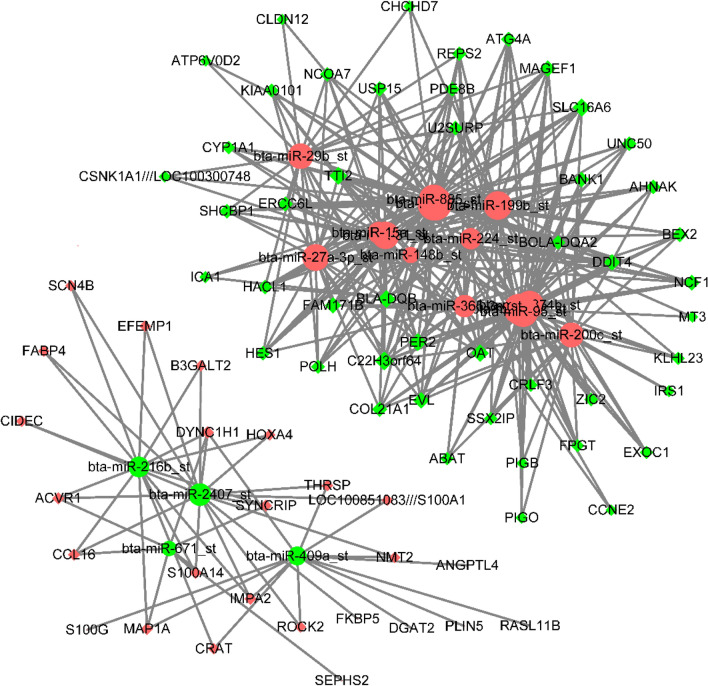
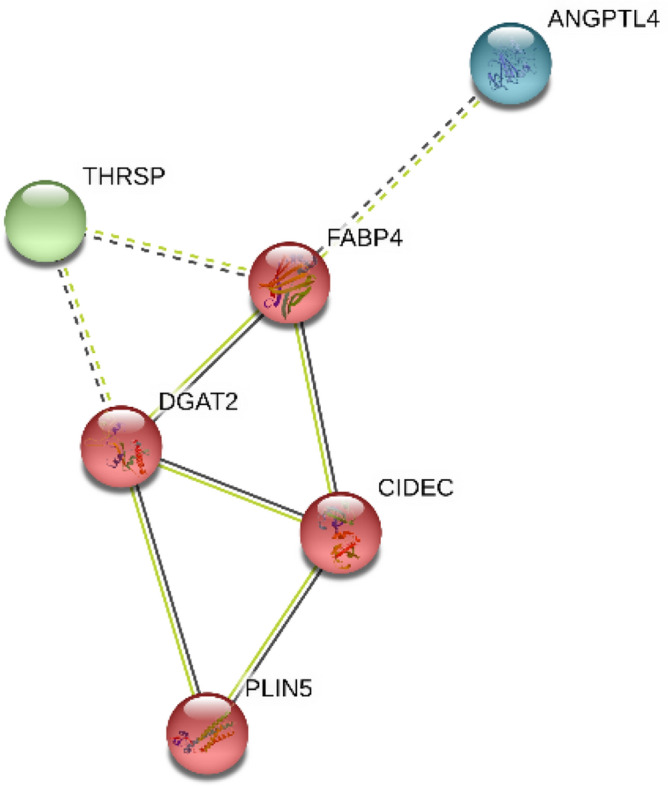
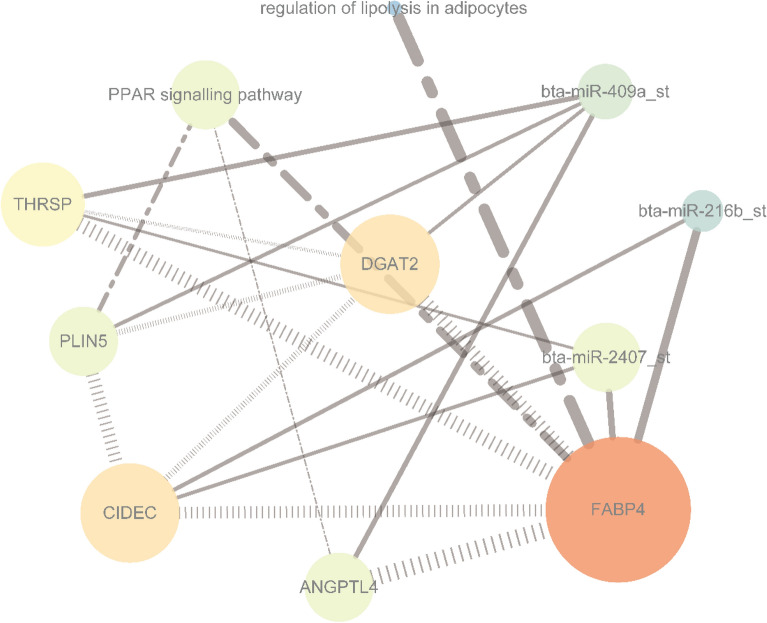
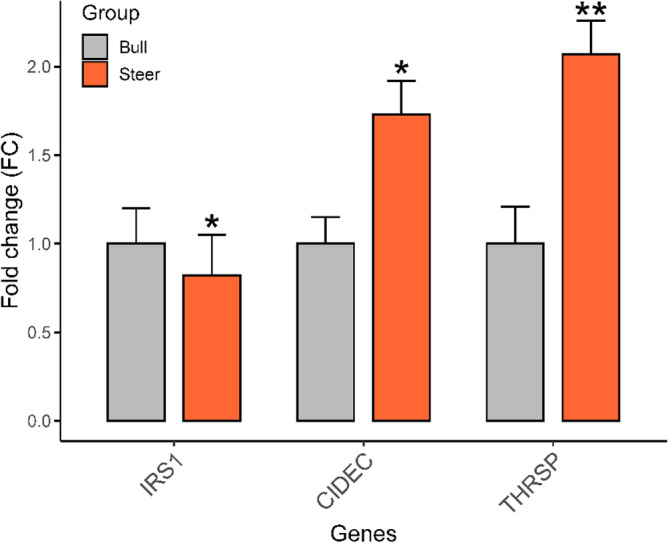
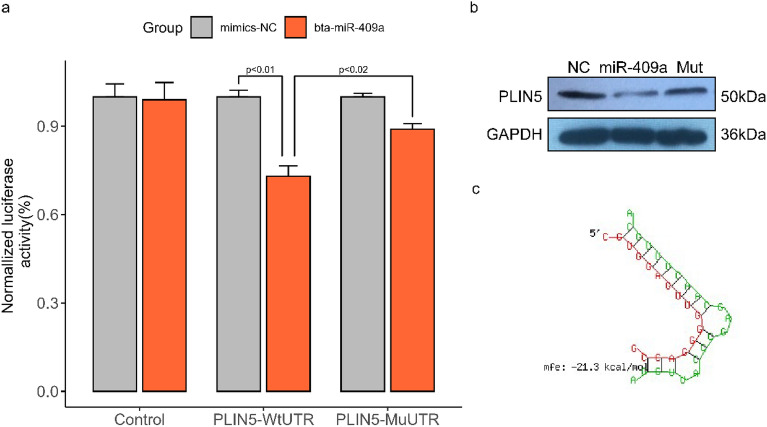
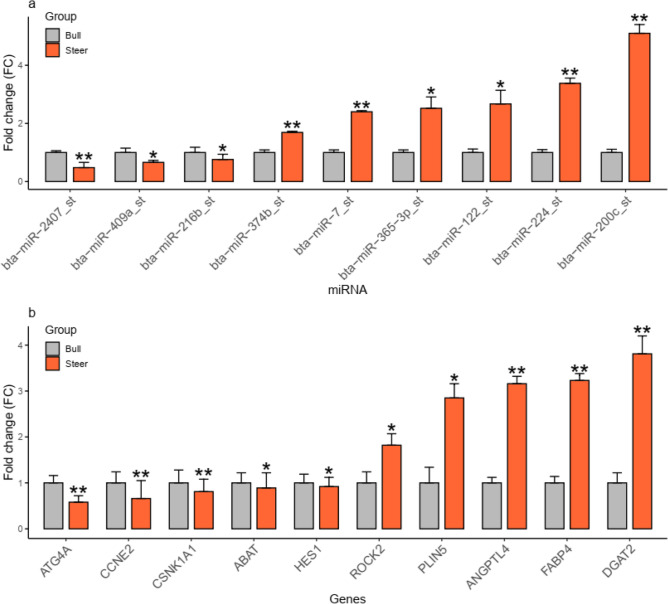
MicroRNAs (miRNAs) play a vital role in improving meat quality by binding to messenger RNAs (mRNAs). We performed an integrated analysis of miRNA and mRNA expression profiling between bulls and steers based on the differences in meat quality traits. Fat and fatty acids are the major phenotypic indices of meat quality traits to estimate between-group variance. In the present study, 90 differentially expressed mRNAs (DEGs) and 18 differentially expressed miRNAs (DEMs) were identified. Eighty-three potential DEG targets and 18 DEMs were used to structure a negative interaction network, and 75 matching target genes were shown in this network. Twenty-six target genes were designated as intersection genes, screened from 18 DEMs, and overlapped with the DEGs. Seventeen of these genes enriched to 19 terms involved in lipid metabolism. Subsequently, 13 DEGs and nine DEMs were validated using quantitative real-time PCR, and seven critical genes were selected to explore the influence of fat and fatty acids through hub genes and predict functional association. A dual-luciferase reporter and Western blot assays confirmed a predicted miRNA target (bta-miR-409a and PLIN5). These findings provide substantial evidence for molecular genetic controls and interaction among genes in cattle.


Conflict of interest statement

The authors declare no competing interests.

Figures

Figure 1
Figure 1
Significantly enriched GO, Pathway, and UniProt for intersection genes. P ≤ 0.05.
Figure 2
Figure 2
Interaction networks of miRNA and mRNA. Red and green indicate up- and down-regulation, respectively; round and diamond indicate regulated mRNA and miRNA, respectively; The significant round indicated that genes were regulated.
Figure 3
Figure 3
Co-expression analysis in bulls (a) and steers (b). Red indicates crucial nodes in the network, followed by orange and yellow; Green indicates a minimum contribution degree and low-value in the network; solid and dotted indicate pos- and neg-correlations, respectively.
Figure 4
Figure 4
Overall expression data of interacting genes in the organism.
Figure 5
Figure 5
Interaction network for six critical genes with corresponding DEMs. Round and square indicate up- and down-regulation, respectively; Diamond and dash-dot indicate they involved pathways and enriched genes in the pathways, respectively; Vertical slash indicates the functional association between genes; Solid indicates a regulated relationship between gene and miRNA; Orange indicates the most strong closeness centrality, followed by yellow, green, and blue; Size is influenced by radiality; Line thickness is influenced by edge betweenness.
Figure 6
Figure 6
Validation of three critical genes by qRT-PCR, *P < 0.05, **P < 0.01.
Figure 7
Figure 7
Validation of miRNA endogenous targets via dual-luciferase reporter and Western blot assay. (a) Showed the activity of PLIN5 and bta-miR-409a by binding assay. (b) Presented the validating of PLIN5 as a target of bta-miR-209a at the protein level using western blot. Three tracks were captured from the original full-length membrane image and were presented in the same order consistent with (a). (c) is nucleotide sequences of binding sites located in the 3′ UTR of PLIN5. The sample derives from the same experiment, and that blots were processed in parallel. The party of the full-length membrane image is presented in Supplementary Fig. S8.
Figure 8
Figure 8
Experimental verification by using qRT-PCR. (a) shows the validation of differentially expressed miRNAs, *P < 0.05, **P < 0.01; (b) presents the validation of intersection genes, *P < 0.05, **P < 0.01.

Similar articles

Cited by

References

    1. Gagaoua M, Bonnet M, Picard B. Protein array-based approach to evaluate biomarkers of beef tenderness and marbling in cows: understanding of the underlying mechanisms and prediction. Foods. 2020;9(9):1180. doi: 10.3390/foods9091180. - DOI - PMC - PubMed
    1. Pewan SB, et al. Genetics of omega-3 long-chain polyunsaturated fatty acid metabolism and meat eating quality in tattykeel australian white lambs. Genes (Basel) 2020;11(5):587. doi: 10.3390/genes11050587. - DOI - PMC - PubMed
    1. Ekine-Dzivenu C, et al. Phenotypic and genetic correlations of fatty acid composition in subcutaneous adipose tissue with carcass merit and meat tenderness traits in Canadian beef cattle. J. Anim. Sci. 2017;95:5184–5196. doi: 10.2527/jas2017.1966. - DOI - PMC - PubMed
    1. Feitosa FL, et al. Genetic correlation estimates between beef fatty acid profile with meat and carcass traits in Nellore cattle finished in feedlot. J. Appl. Genet. 2017;58:123–132. doi: 10.1007/s13353-016-0360-7. - DOI - PubMed
    1. Ros-Freixedes R, Reixach J, Bosch L, Tor M, Estany J. Genetic correlations of intramuscular fat content and fatty acid composition among muscles and with subcutaneous fat in Duroc pigs. J. Anim. Sci. 2014;92:5417–5425. doi: 10.2527/jas.2014-8202. - DOI - PubMed

Publication types