. 2022 Apr;604(7906):509-516.
doi: 10.1038/s41586-022-04556-w. Epub 2022 Apr 8.

Rare coding variants in ten genes confer substantial risk for schizophrenia

Tarjinder Singh  1   2   3 Timothy Poterba  4   5 David Curtis  6   7 Huda Akil  8 Mariam Al Eissa  9 Jack D Barchas  10 Nicholas Bass  9 Tim B Bigdeli  11 Gerome Breen  12 Evelyn J Bromet  13 Peter F Buckley  14 William E Bunney  15 Jonas Bybjerg-Grauholm  16   17 William F Byerley  18 Sinéad B Chapman  5 Wei J Chen  19 Claire Churchhouse  4   5 Nicholas Craddock  20 Caroline M Cusick  5 Lynn DeLisi  21 Sheila Dodge  22 Michael A Escamilla  23 Saana Eskelinen  24   25 Ayman H Fanous  26 Stephen V Faraone  27 Alessia Fiorentino  9 Laurent Francioli  4   28 Stacey B Gabriel  22 Diane Gage  5 Sarah A Gagliano Taliun  29   30 Andrea Ganna  4   31 Giulio Genovese  5 David C Glahn  32 Jakob Grove  16   33   34   35 Mei-Hua Hall  36 Eija Hämäläinen  31 Henrike O Heyne  4   5   31 Matti Holi  37 David M Hougaard  16   17 Daniel P Howrigan  4   5 Hailiang Huang  4   5 Hai-Gwo Hwu  38 René S Kahn  39   40 Hyun Min Kang  41 Konrad J Karczewski  4   5 George Kirov  42 James A Knowles  43 Francis S Lee  10 Douglas S Lehrer  44 Francesco Lescai  16   45 Dolores Malaspina  39 Stephen R Marder  39 Steven A McCarroll  5   46 Andrew M McIntosh  47 Helena Medeiros  26 Lili Milani  48 Christopher P Morley  27   49 Derek W Morris  50 Preben Bo Mortensen  51 Richard M Myers  52 Merete Nordentoft  16   53   54 Niamh L O'Brien  9 Ana Maria Olivares  5 Dost Ongur  36 Willem H Ouwehand  55 Duncan S Palmer  4   5 Tiina Paunio  56 Digby Quested  57 Mark H Rapaport  58 Elliott Rees  42 Brandi Rollins  15 F Kyle Satterstrom  4   5   59 Alan Schatzberg  60 Edward Scolnick  5 Laura J Scott  41 Sally I Sharp  9 Pamela Sklar  39 Jordan W Smoller  60   61 Janet L Sobell  62 Matthew Solomonson  28 Eli A Stahl  39 Christine R Stevens  5   28 Jaana Suvisaari  63 Grace Tiao  28 Stanley J Watson  8 Nicholas A Watts  28 Douglas H Blackwood  64 Anders D Børglum  16   33   34 Bruce M Cohen  36 Aiden P Corvin  65 Tõnu Esko  48 Nelson B Freimer  66 Stephen J Glatt  27 Christina M Hultman  67 Andrew McQuillin  9 Aarno Palotie  4   5   28   31   60 Carlos N Pato  11 Michele T Pato  11 Ann E Pulver  67 David St Clair  68 Ming T Tsuang  69 Marquis P Vawter  15 James T Walters  42 Thomas M Werge  16   54   70   71 Roel A Ophoff  72   73 Patrick F Sullivan  74   75 Michael J Owen  42 Michael Boehnke  41 Michael C O'Donovan  42 Benjamin M Neale #  76   77   78 Mark J Daly #  79   80   81   82
Affiliations

Rare coding variants in ten genes confer substantial risk for schizophrenia

Tarjinder Singh et al. Nature. 2022 Apr.

Abstract

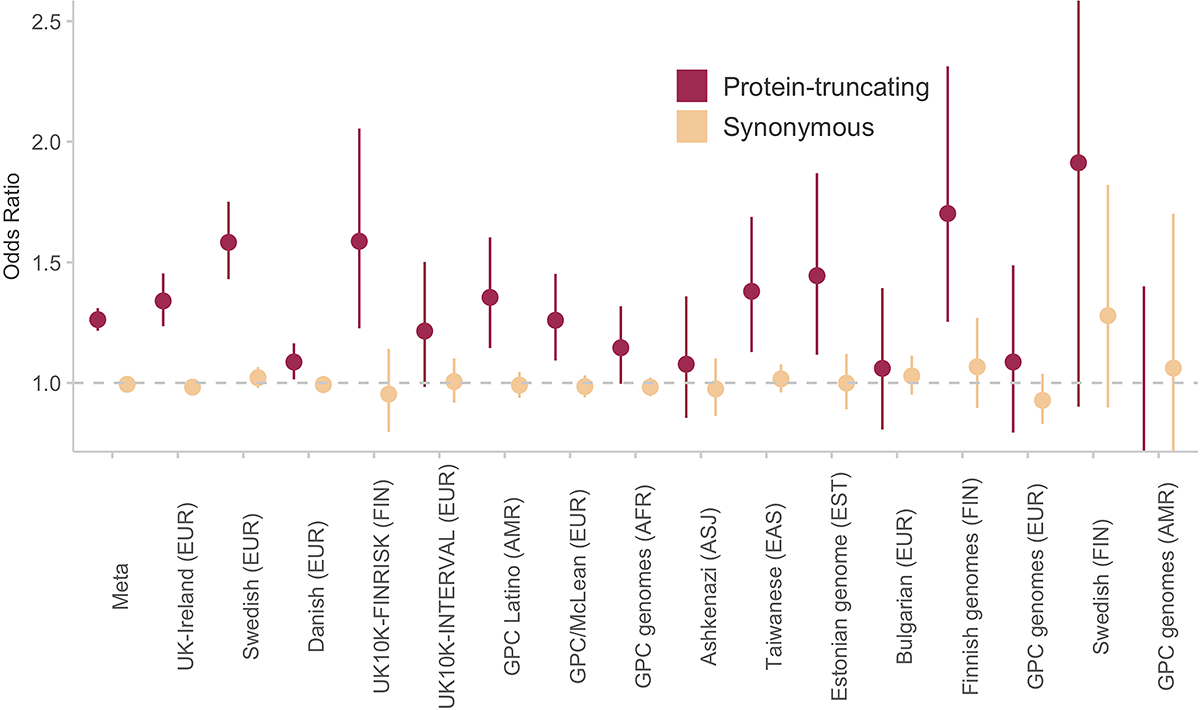
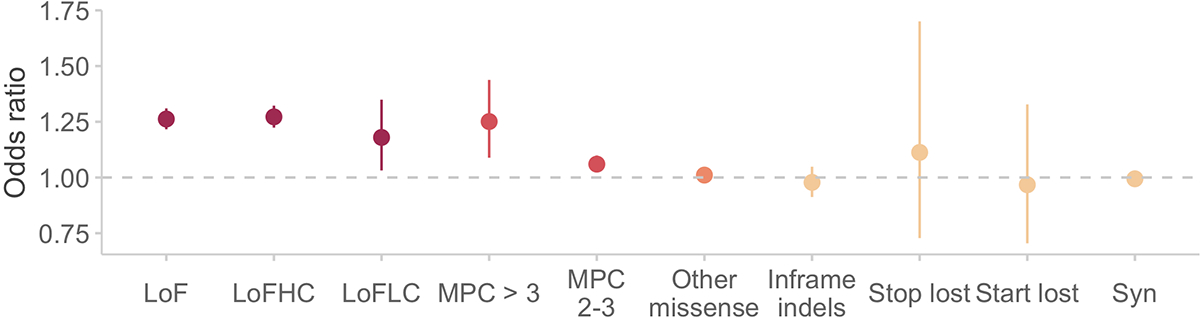
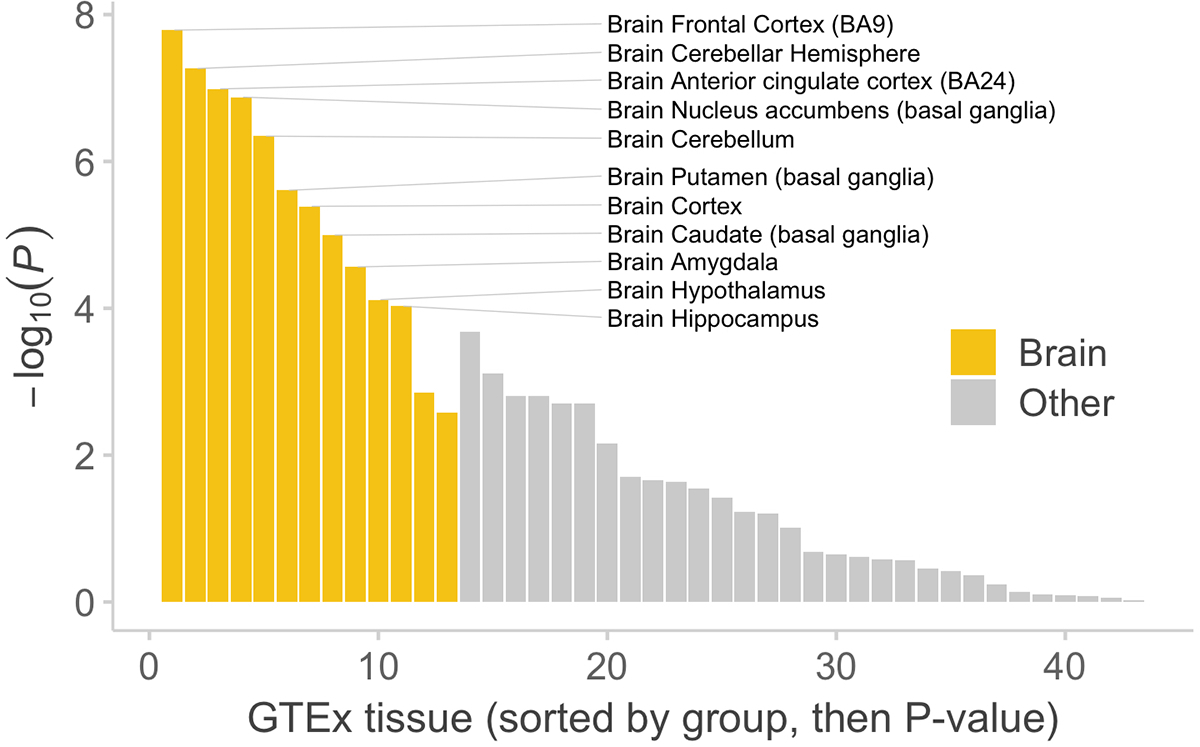
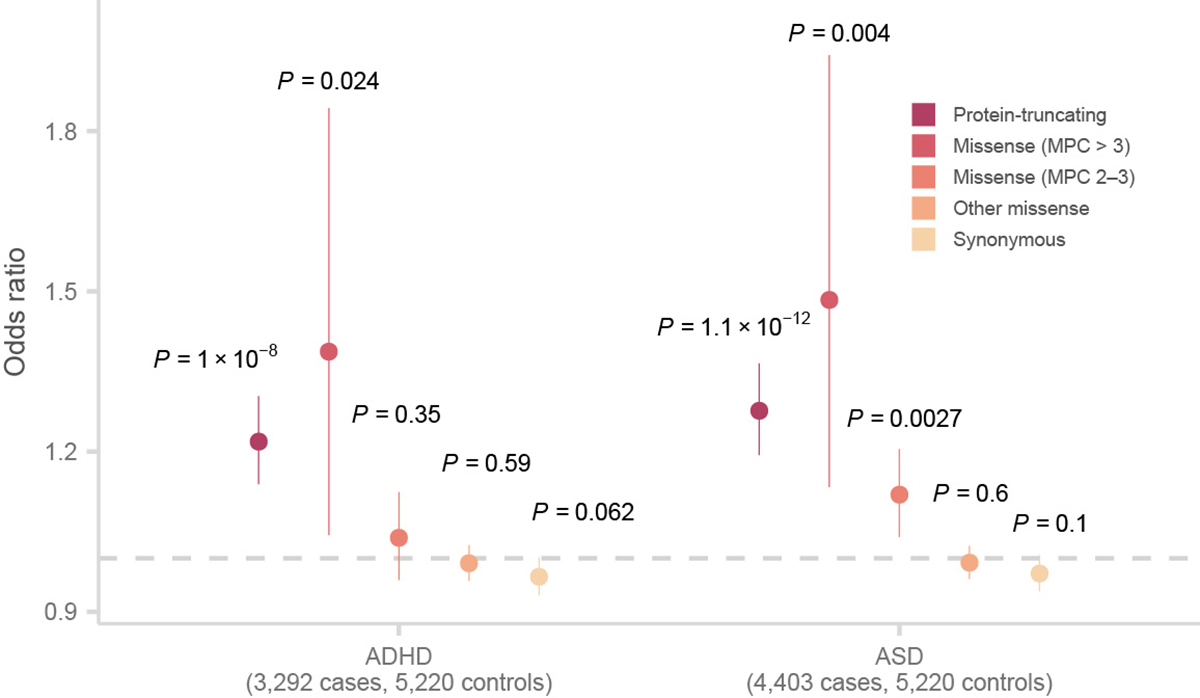
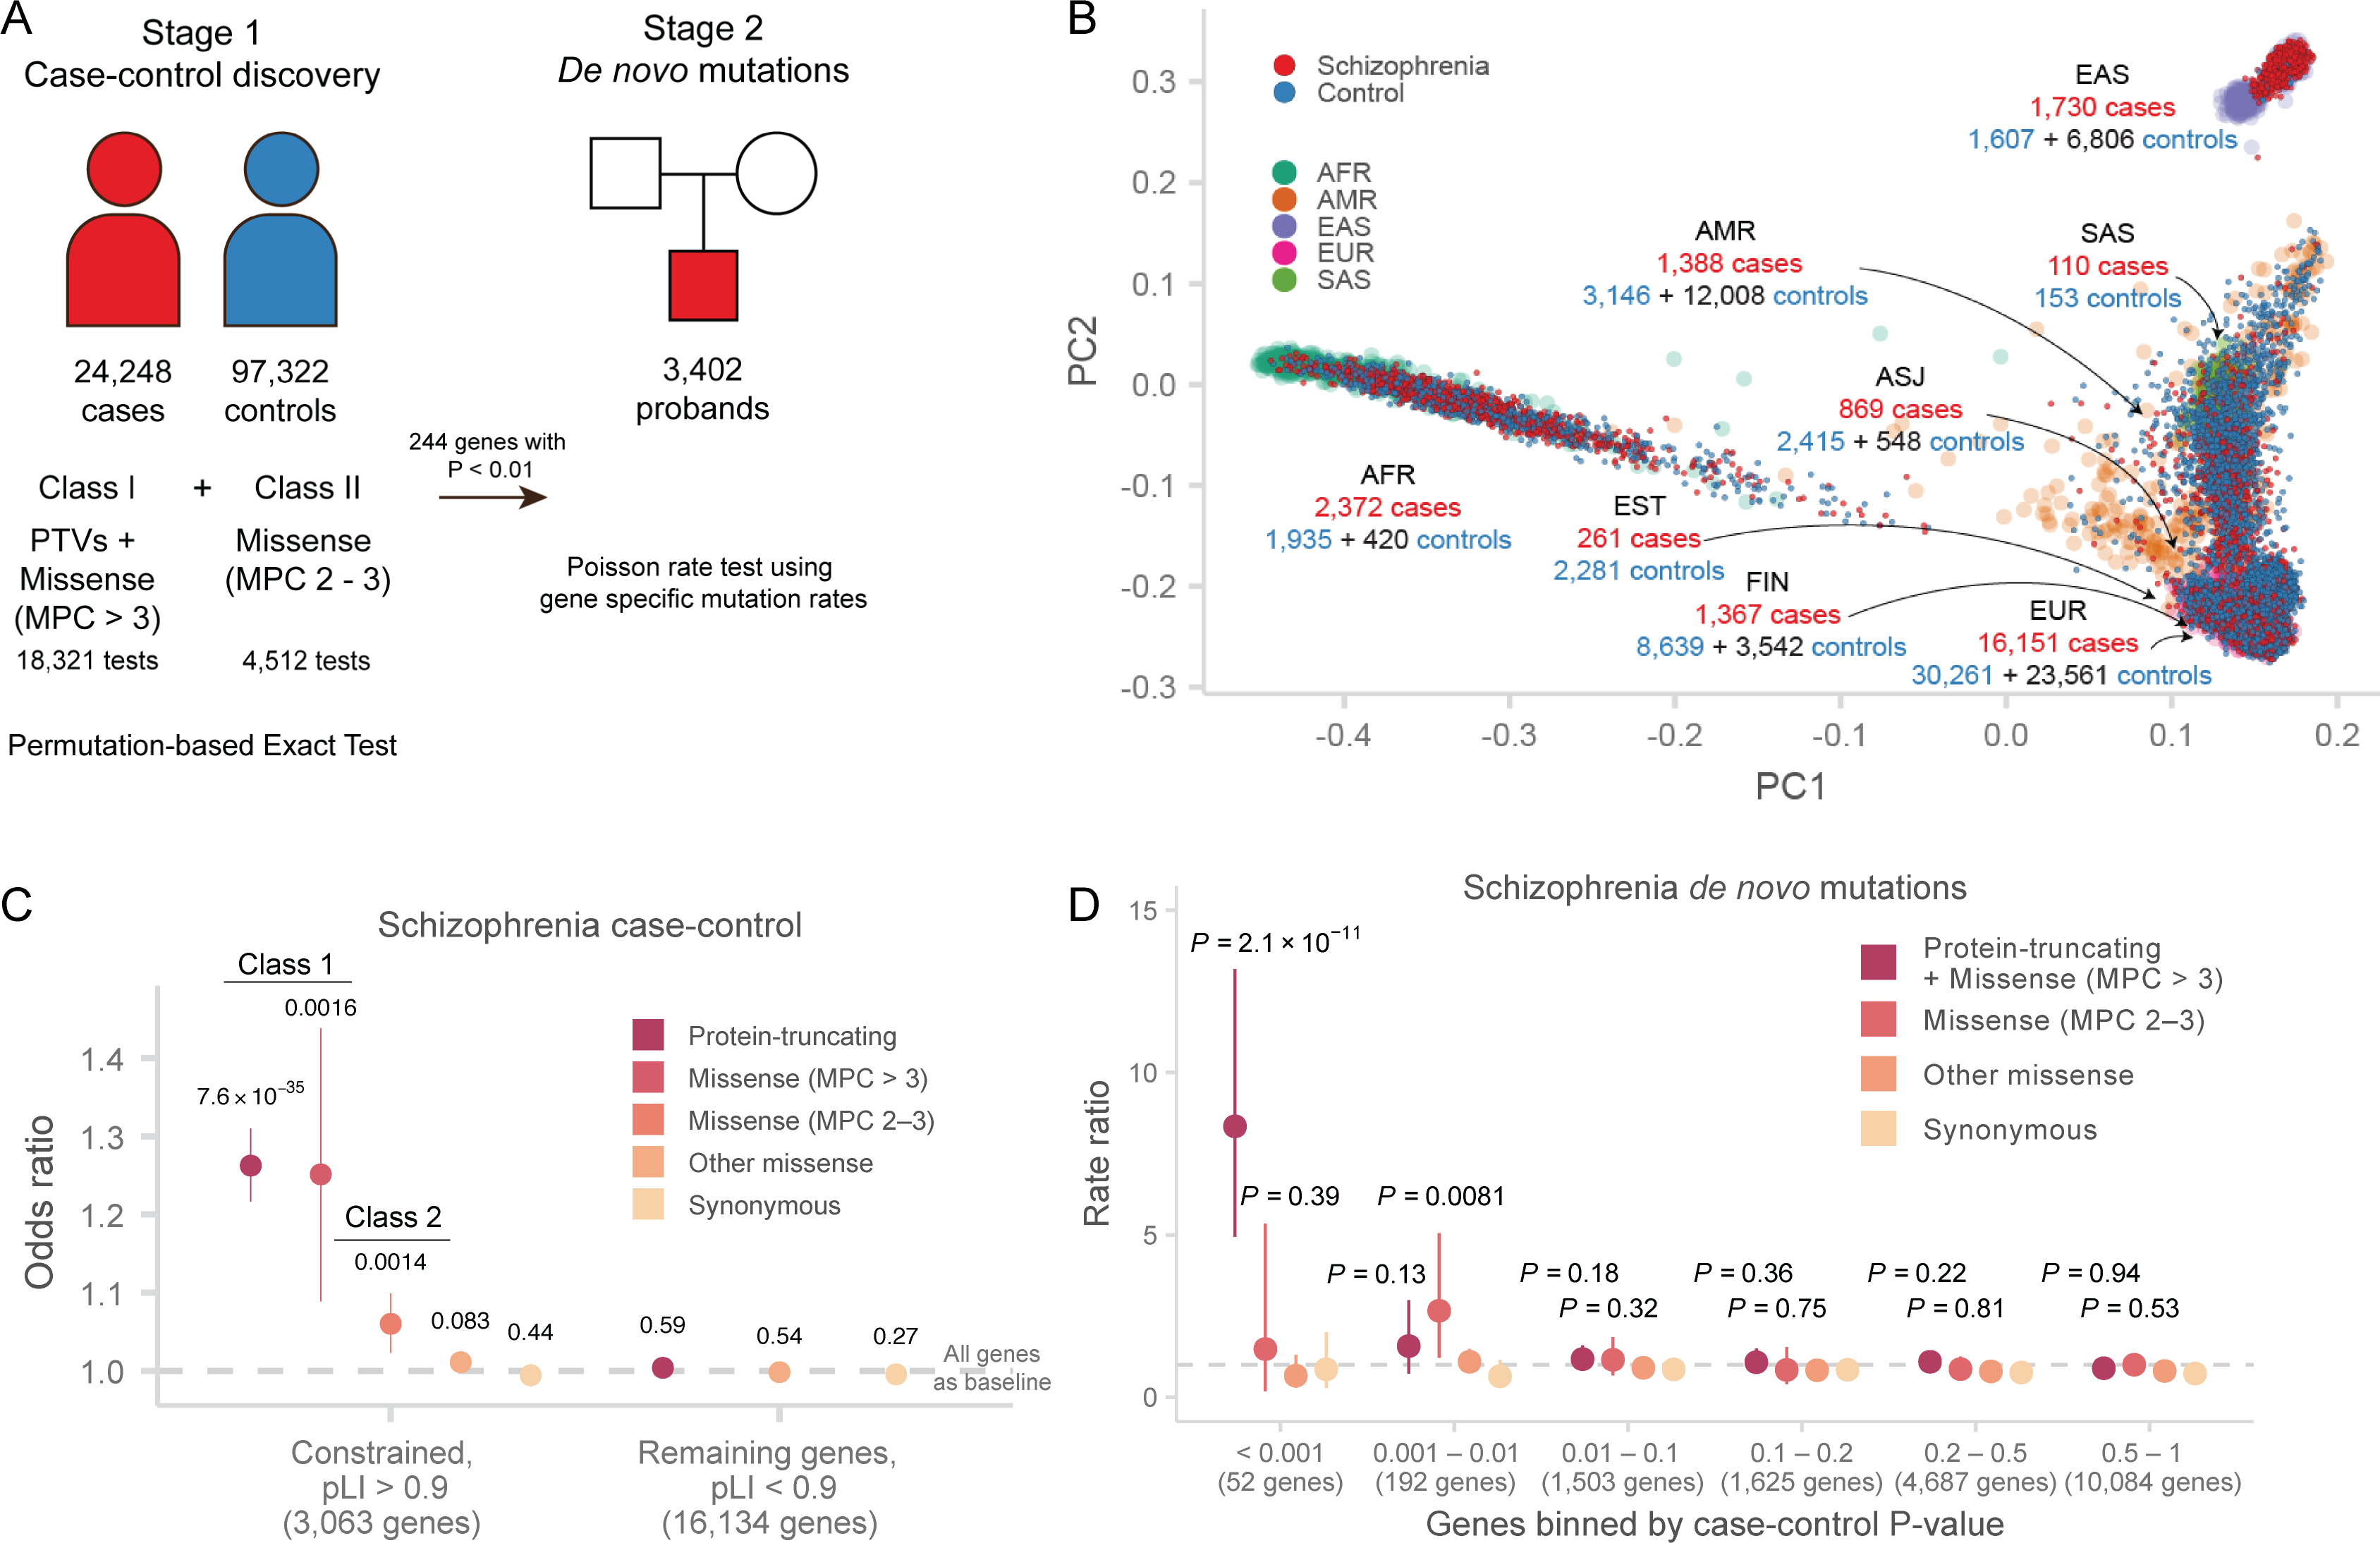
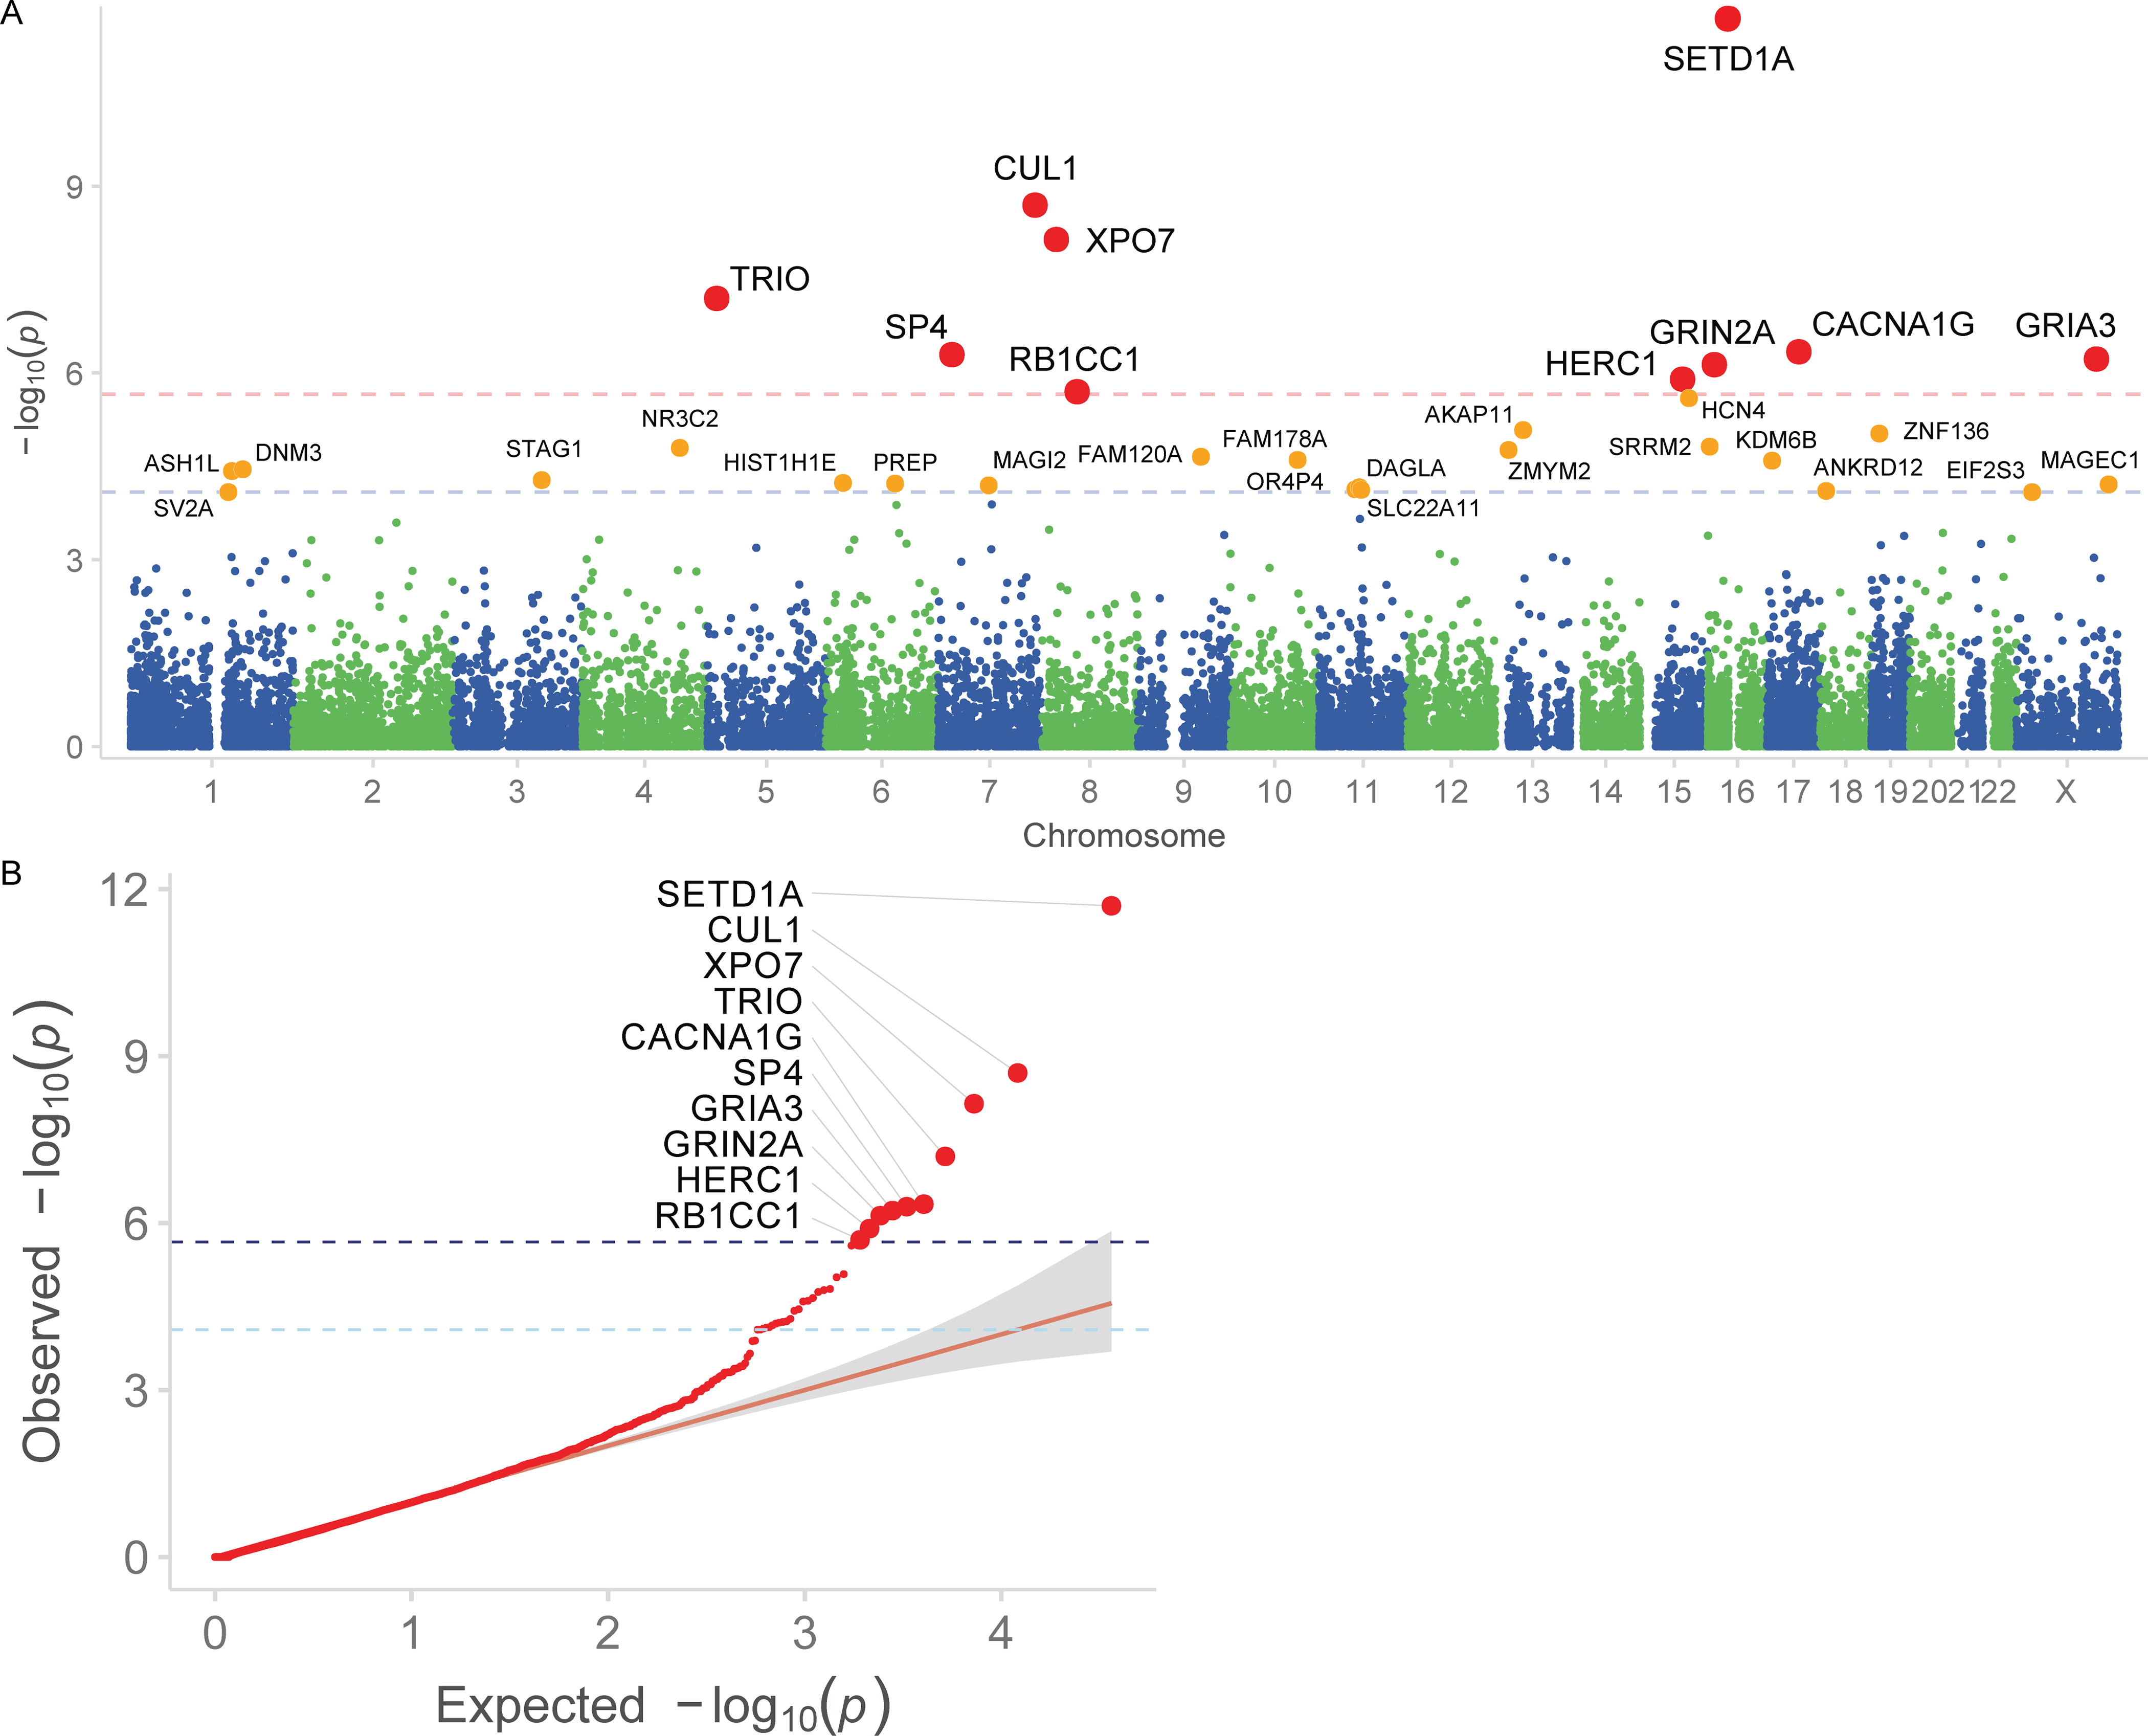
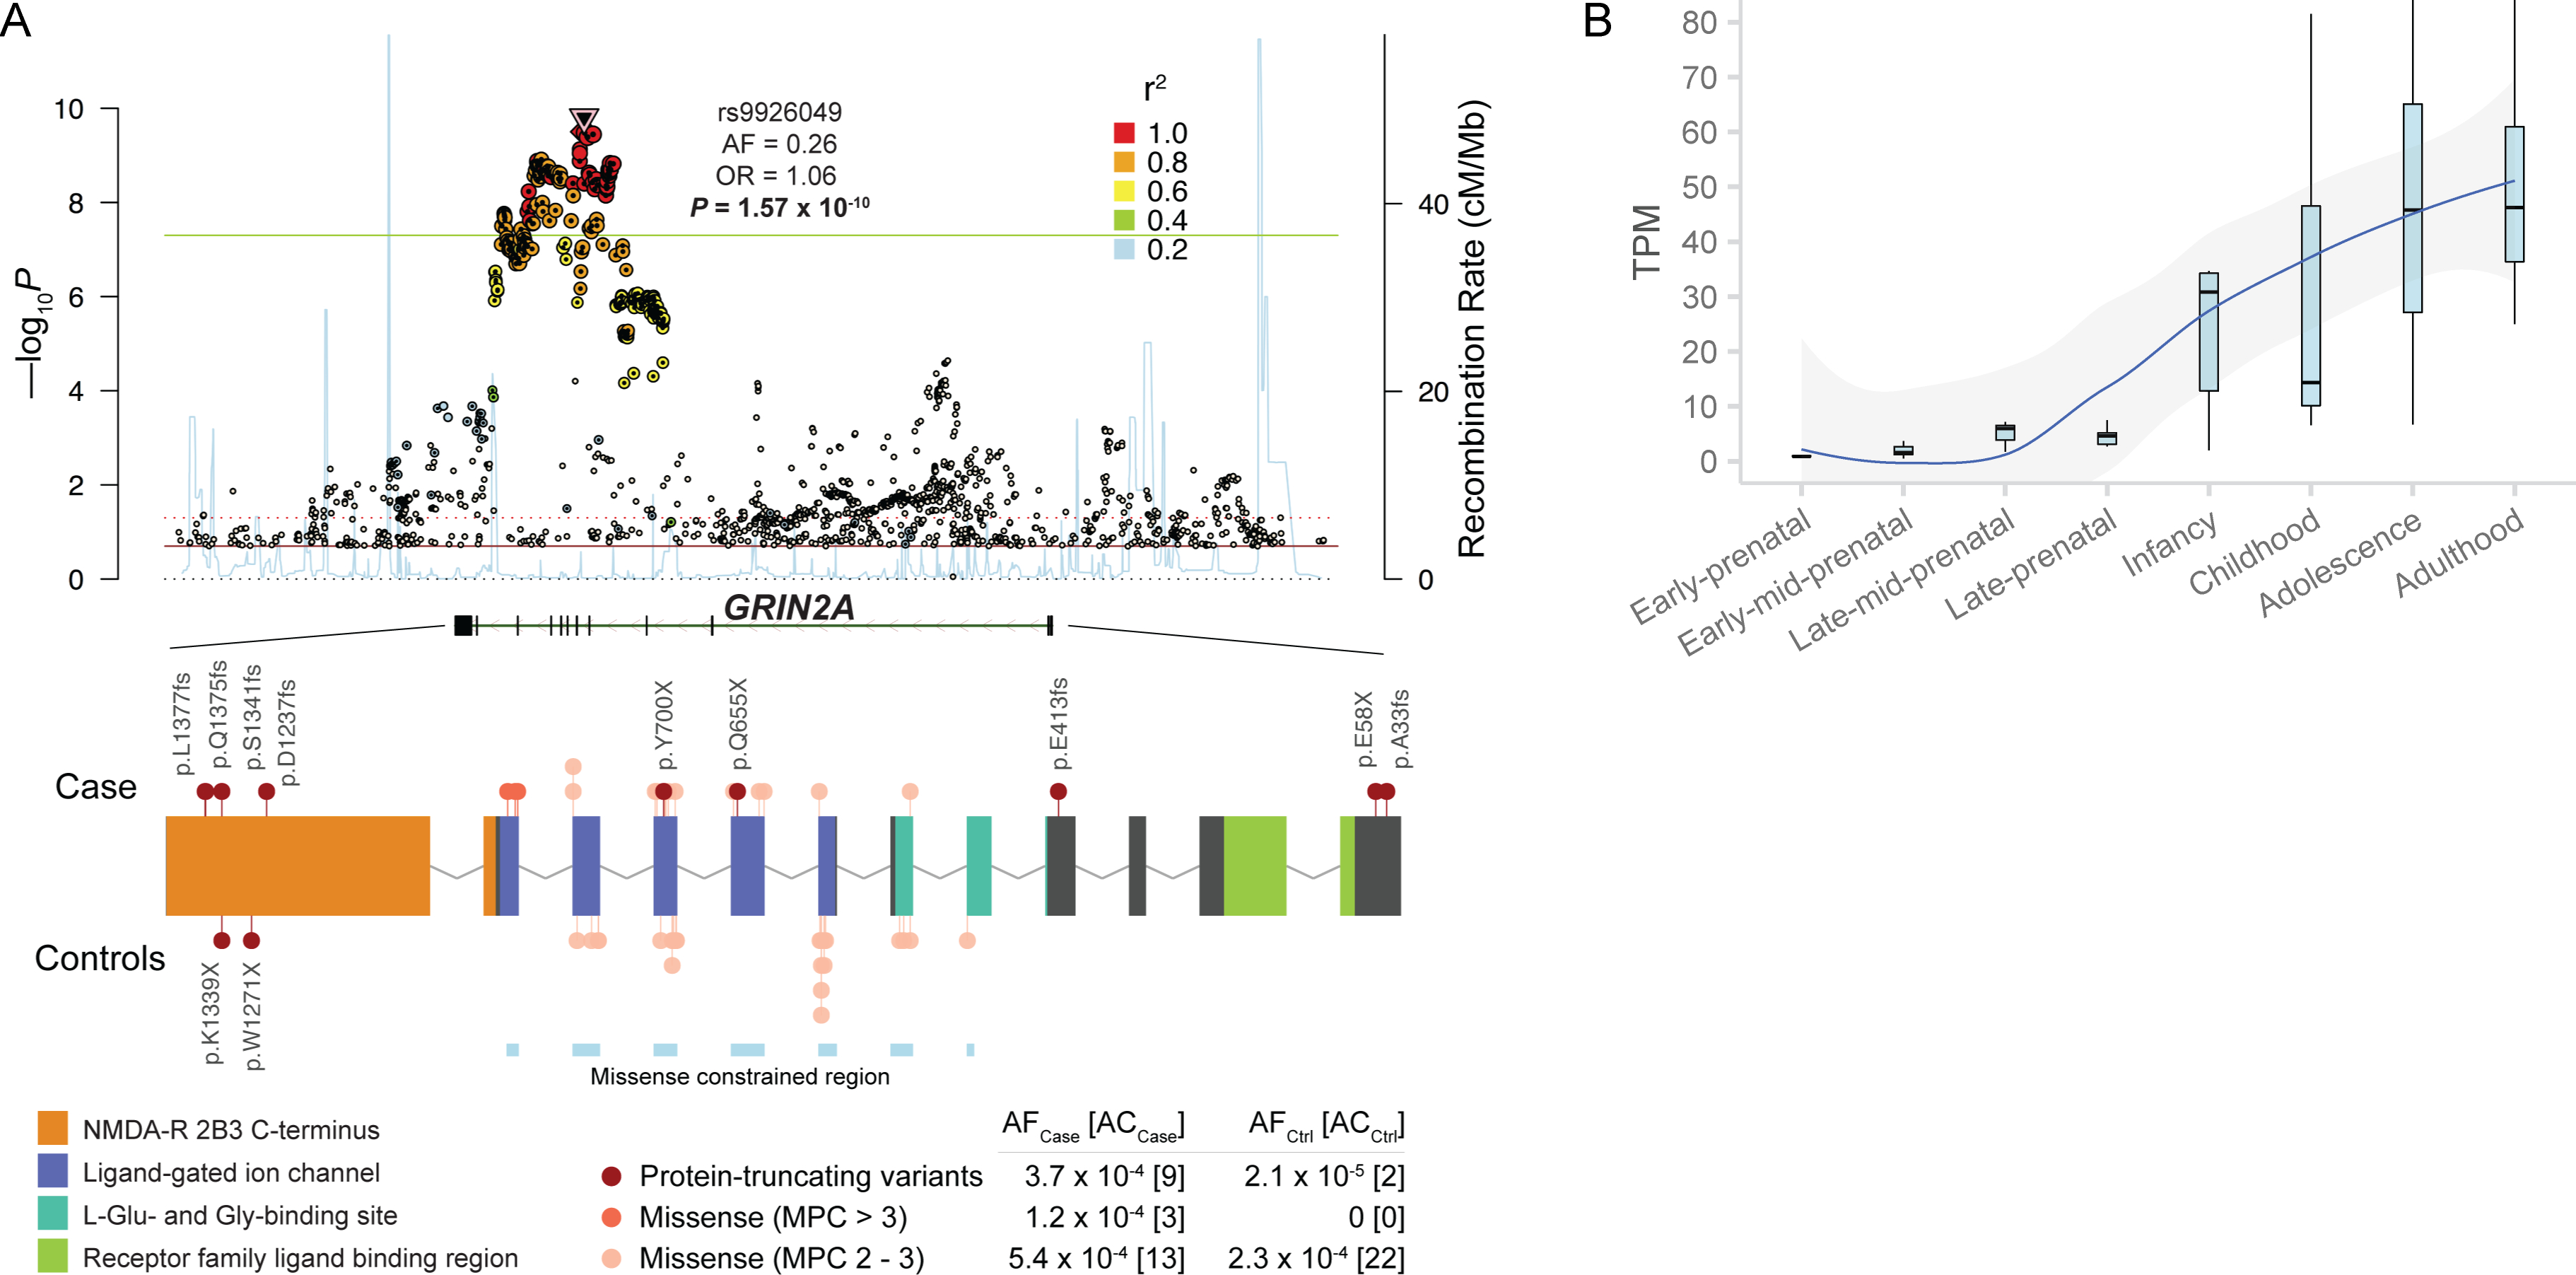
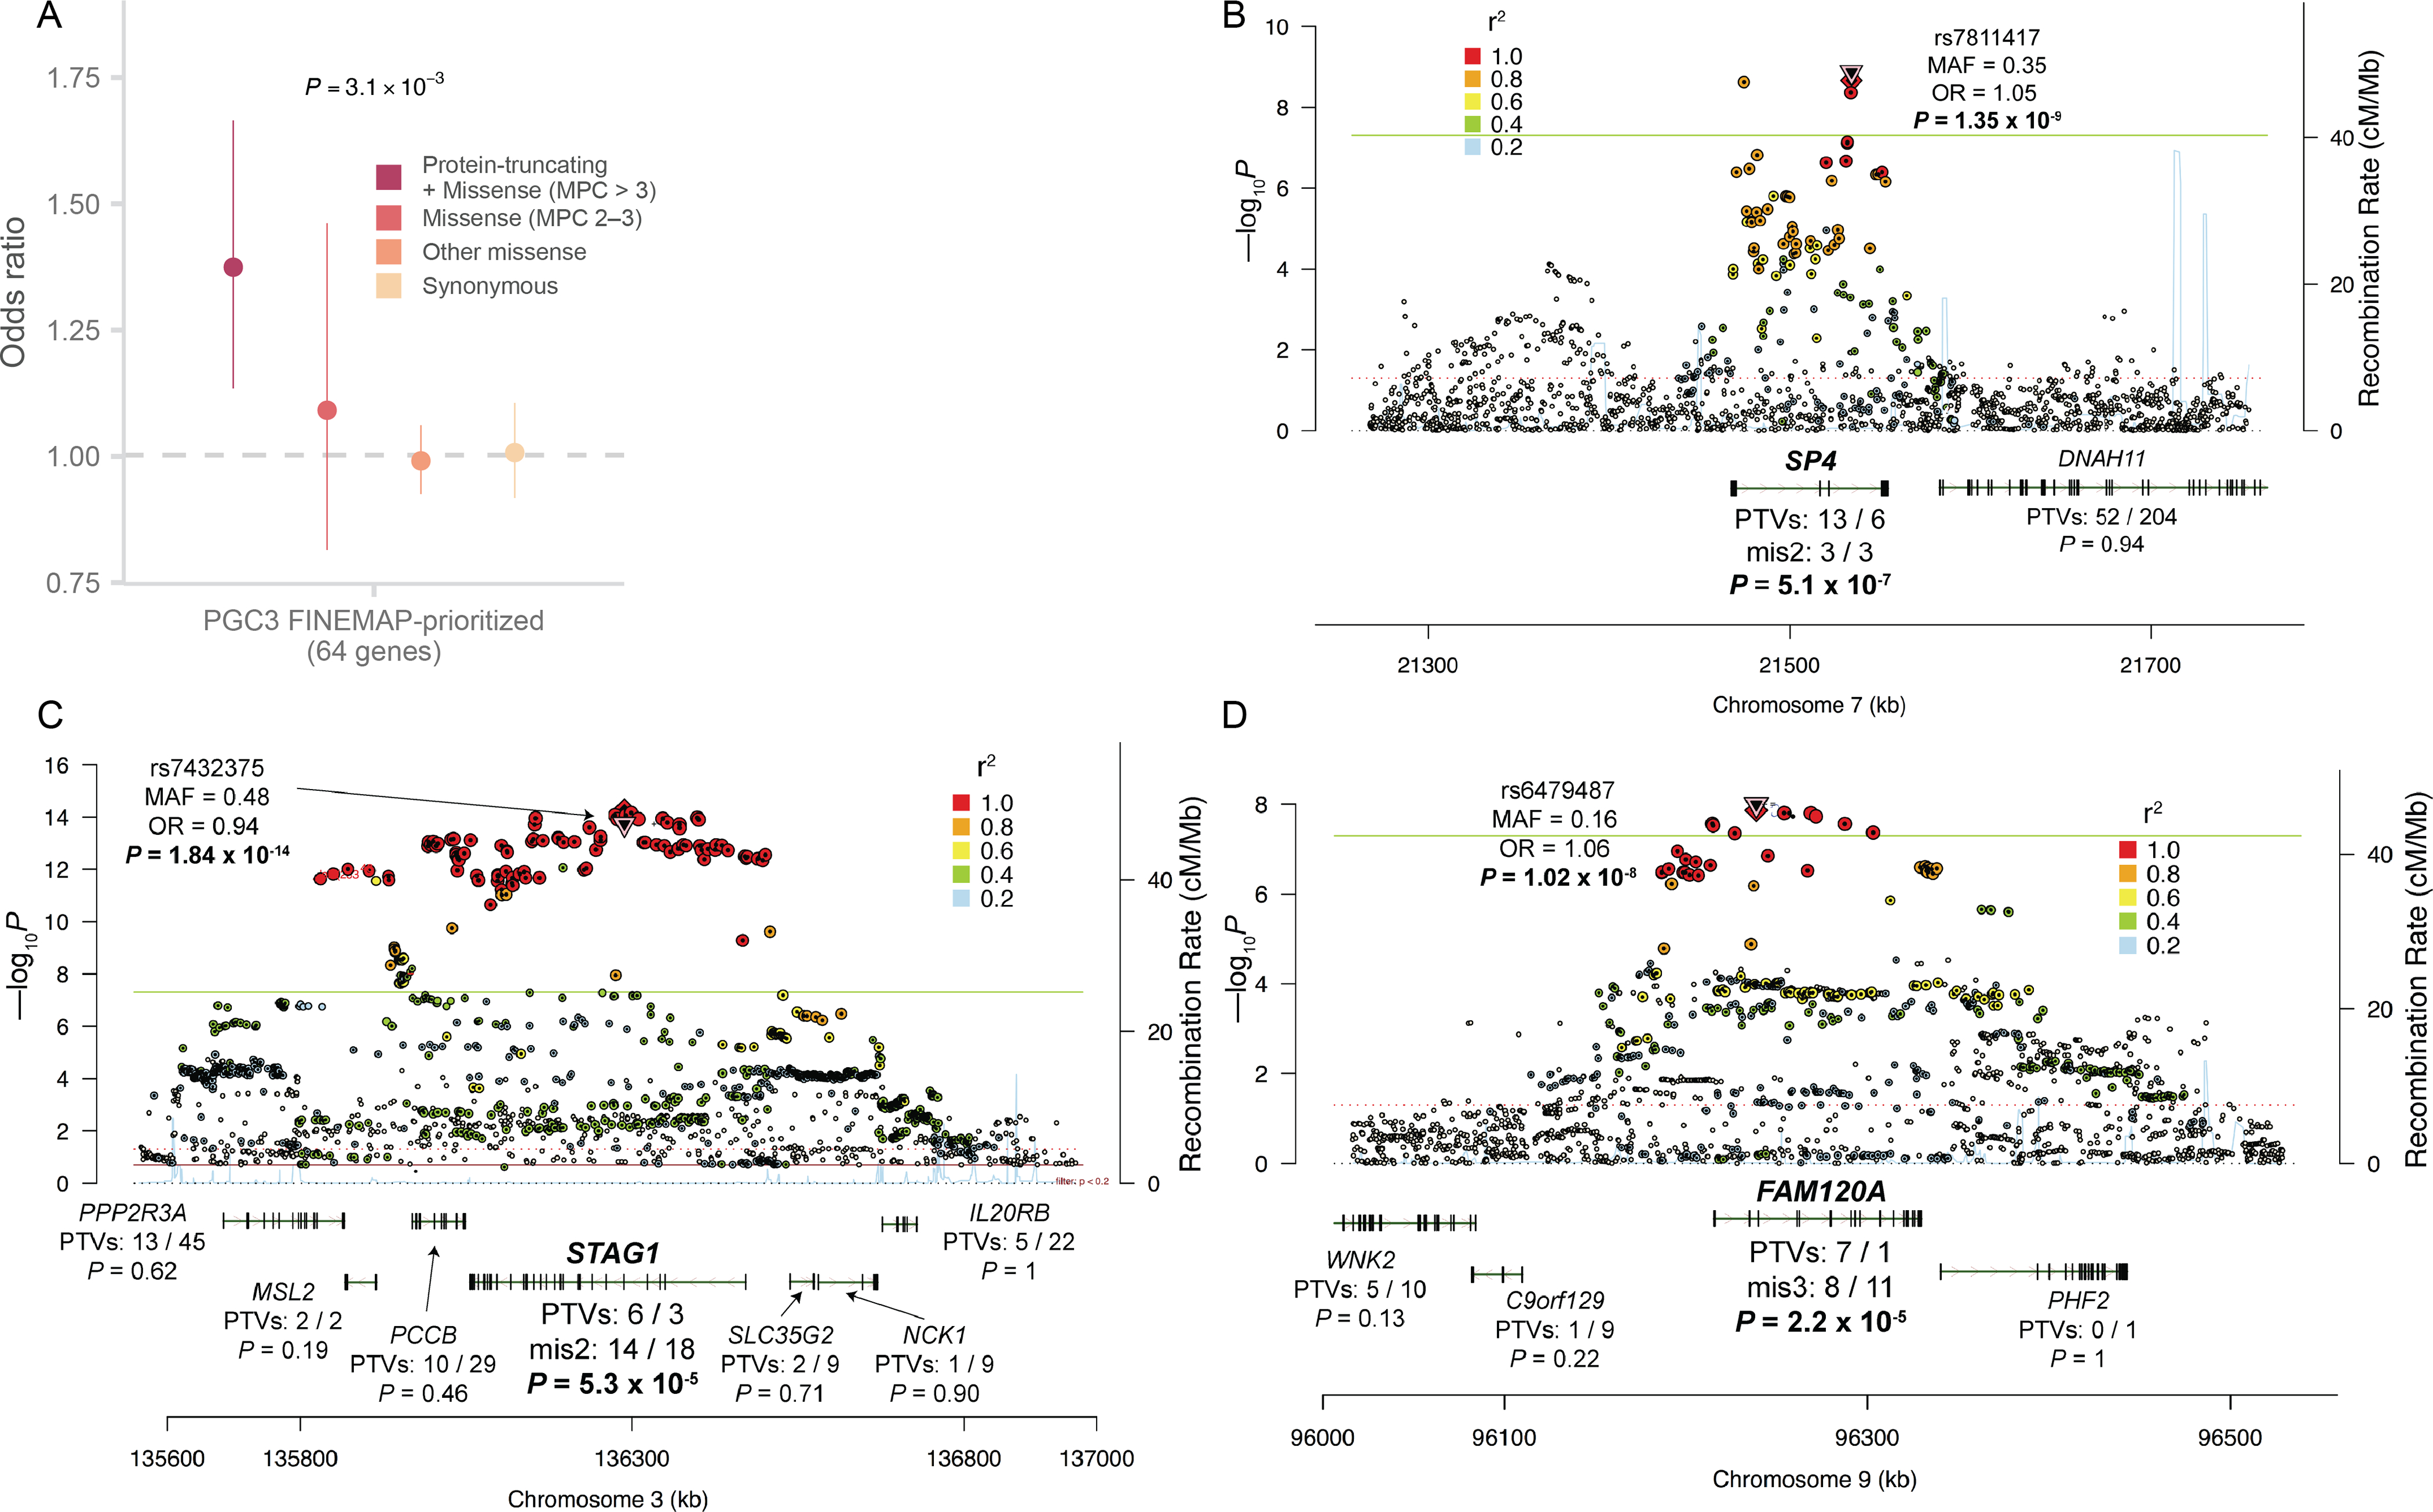
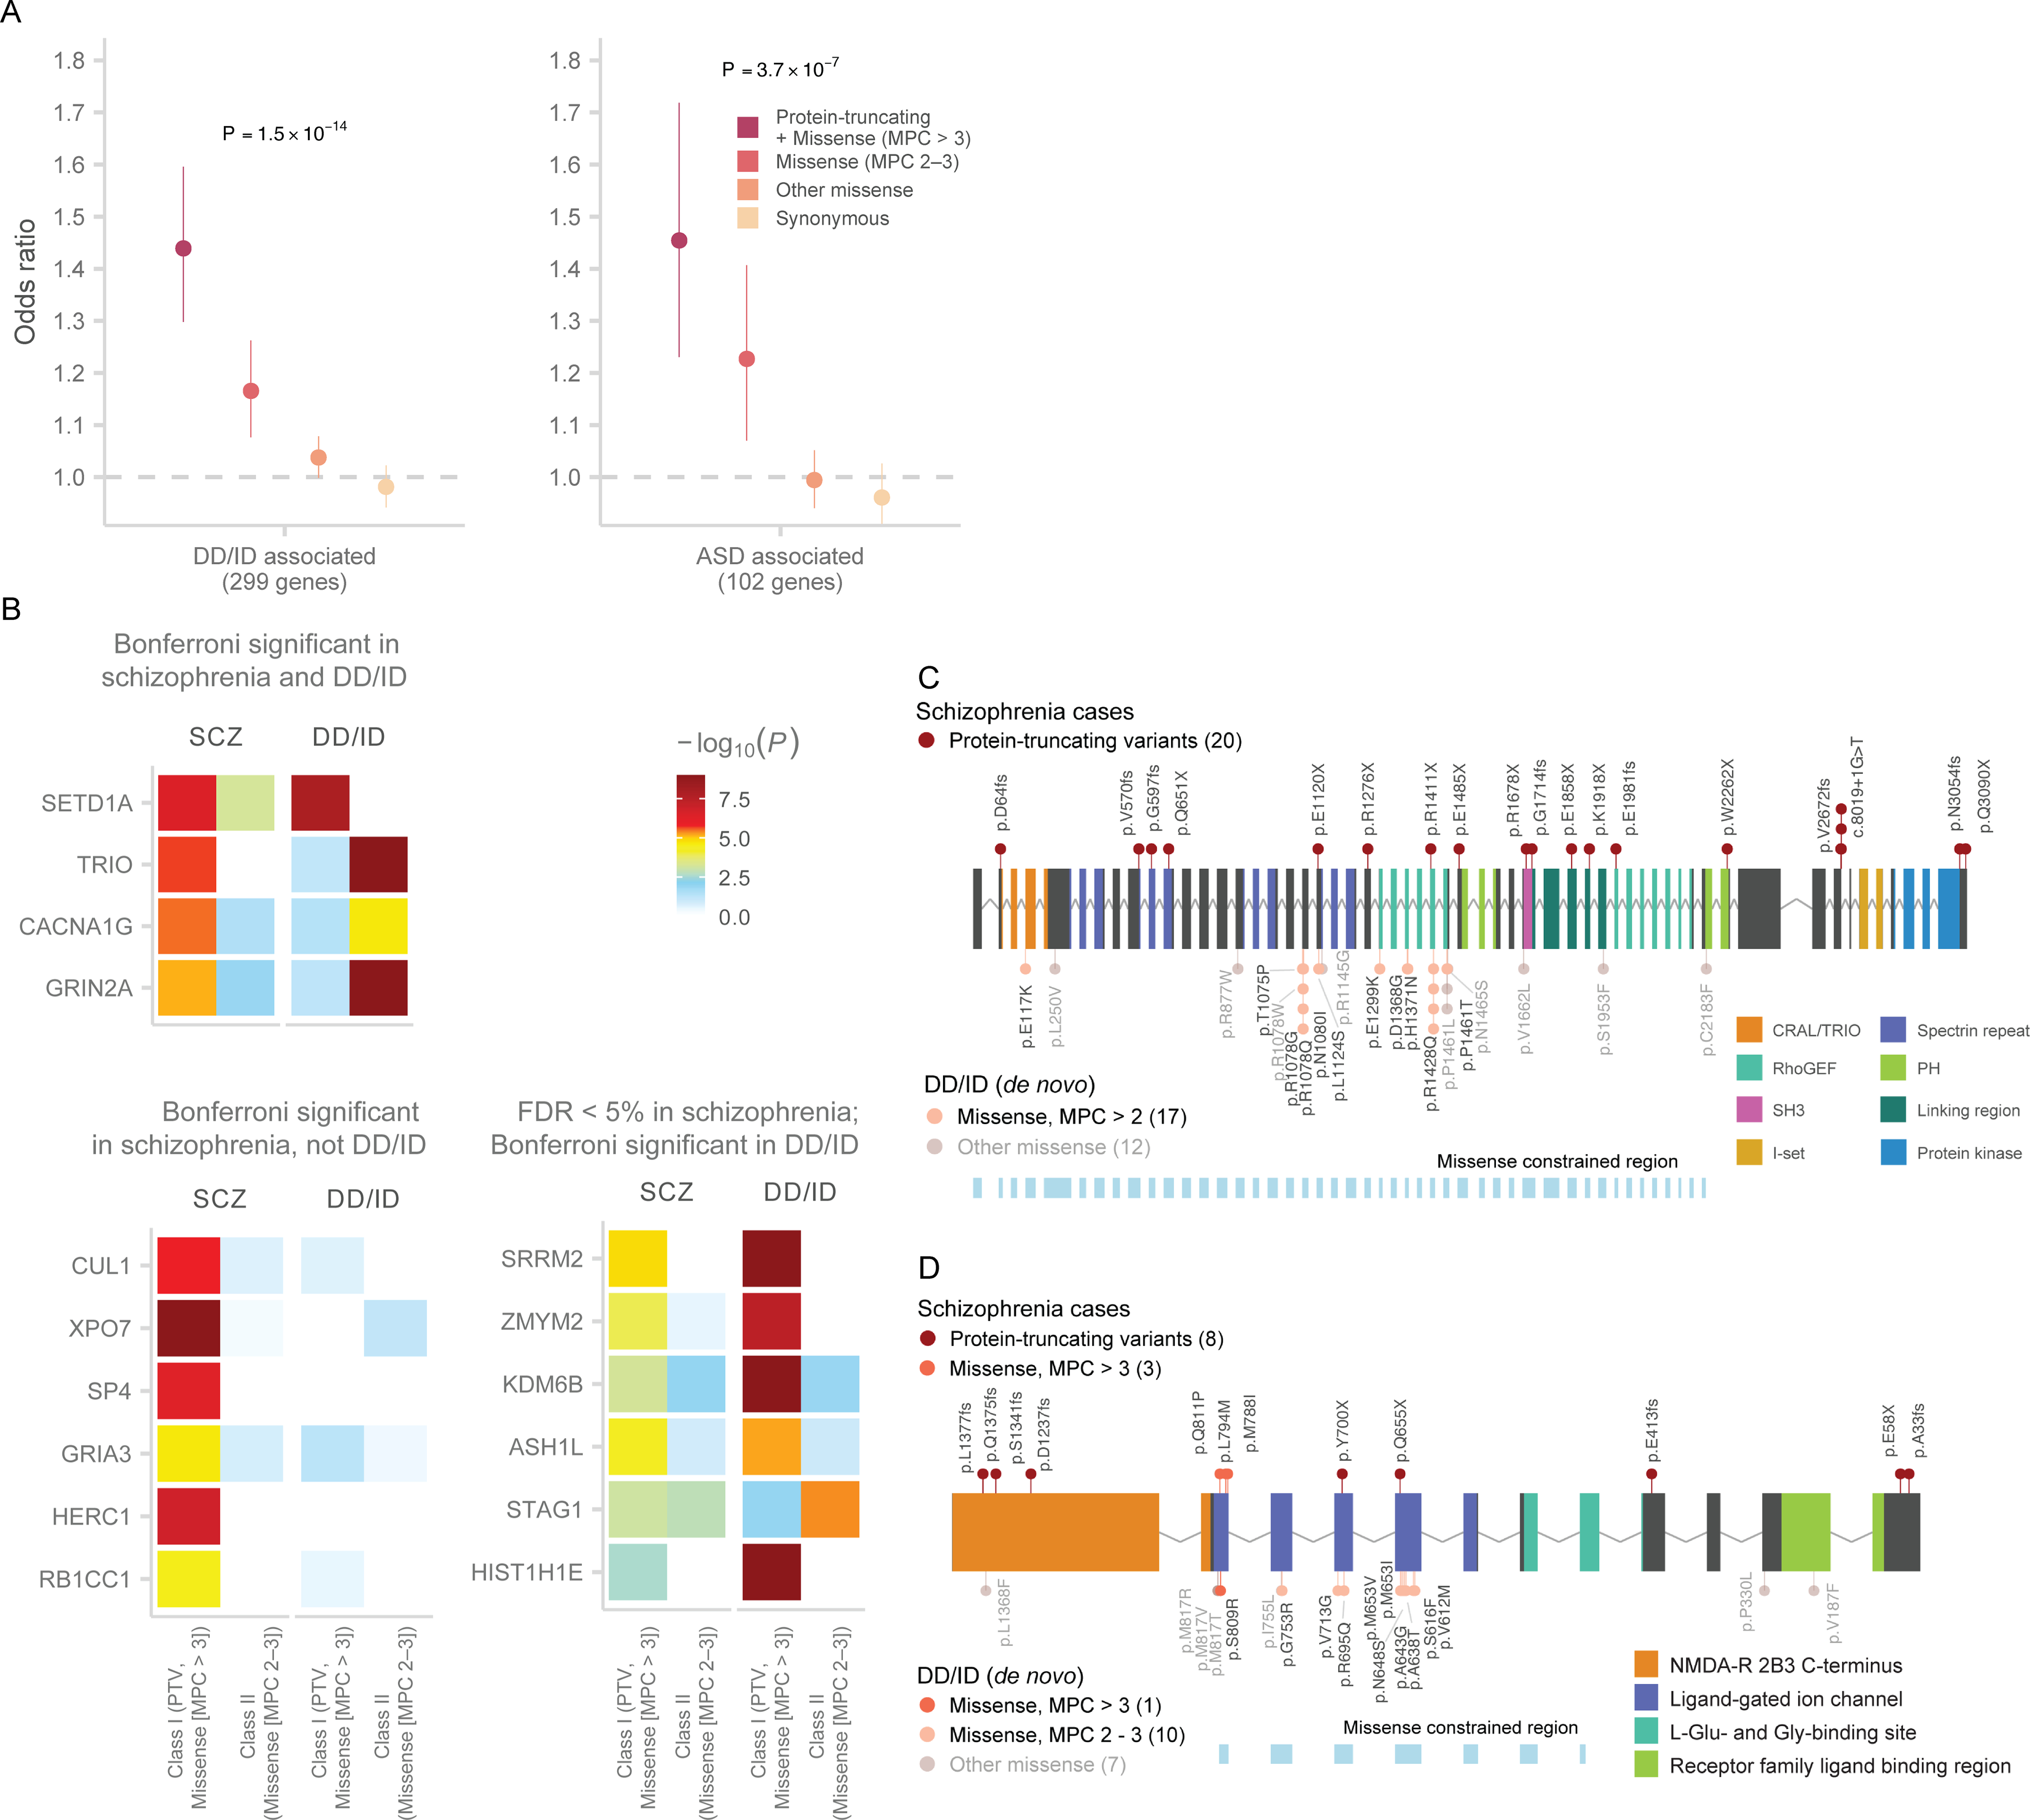
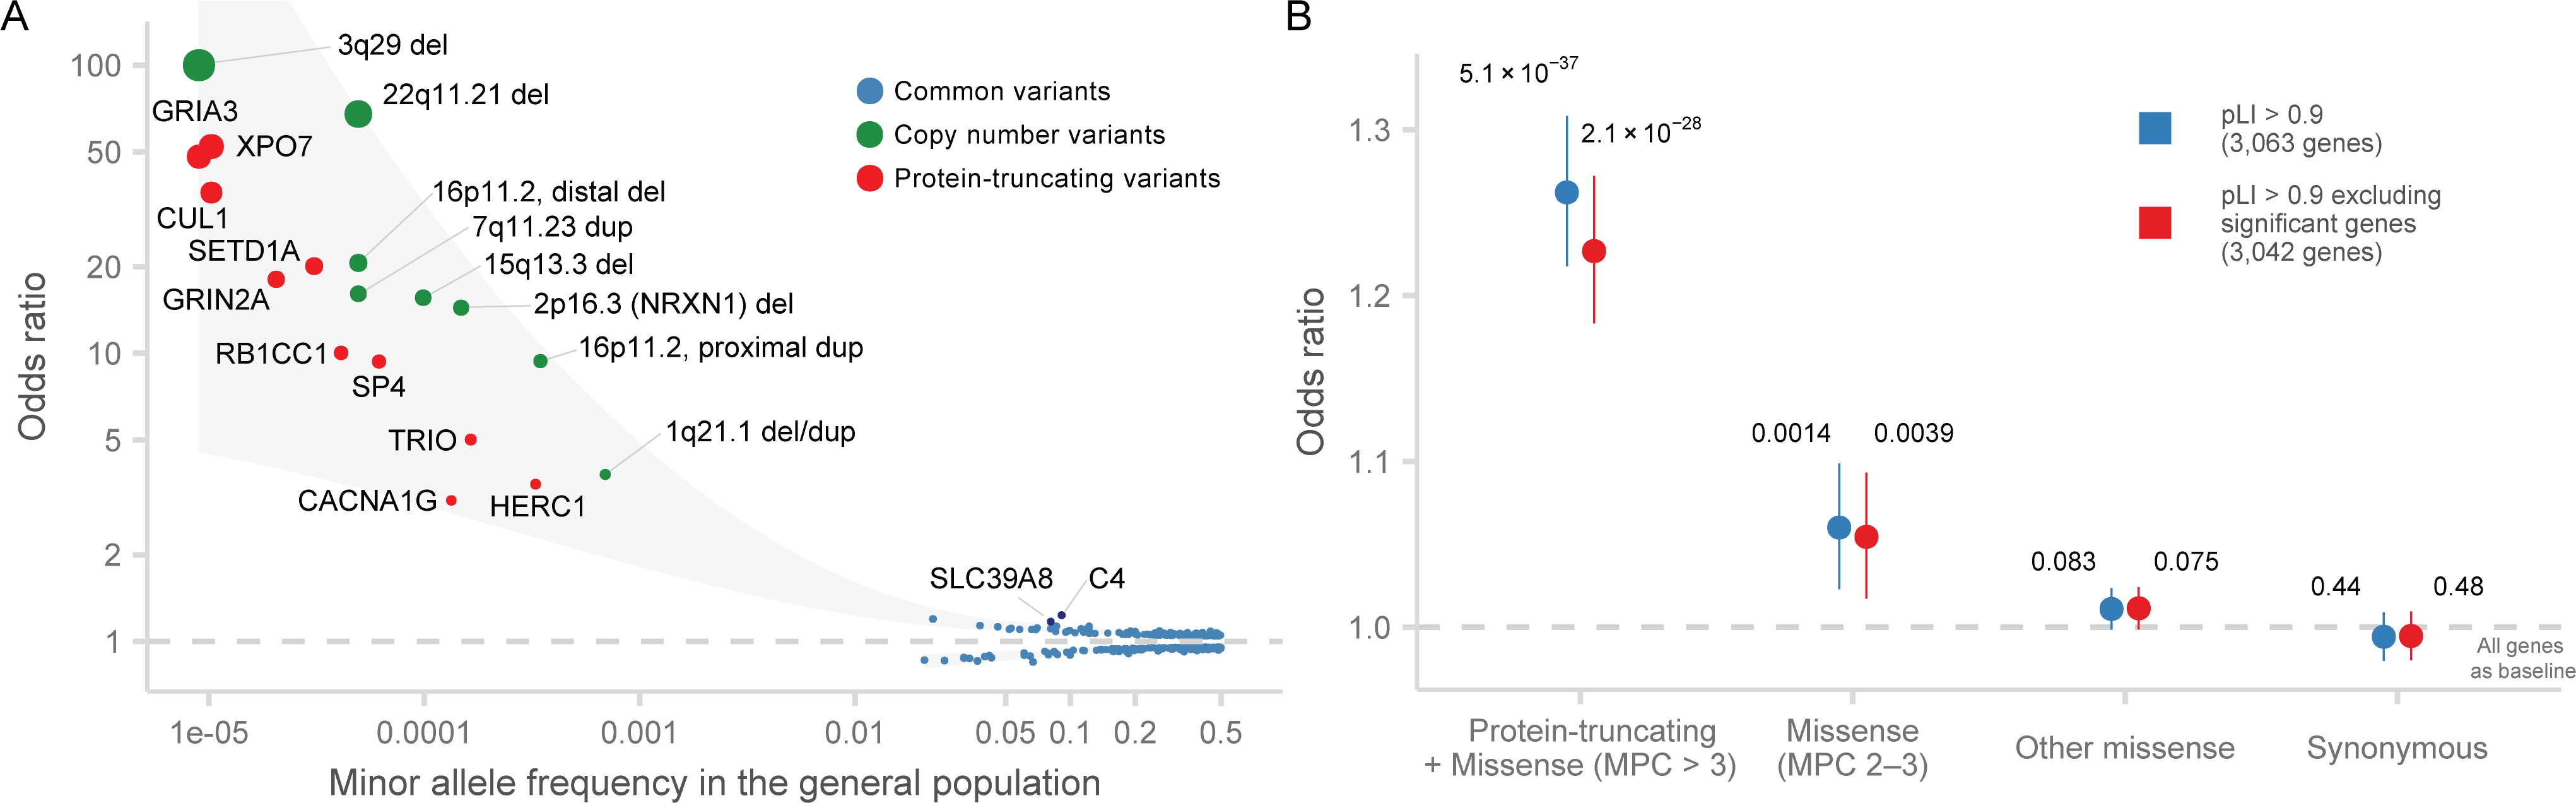
Rare coding variation has historically provided the most direct connections between gene function and disease pathogenesis. By meta-analysing the whole exomes of 24,248 schizophrenia cases and 97,322 controls, we implicate ultra-rare coding variants (URVs) in 10 genes as conferring substantial risk for schizophrenia (odds ratios of 3-50, P < 2.14 × 10⁻⁶) and 32 genes at a false discovery rate of <5%. These genes have the greatest expression in central nervous system neurons and have diverse molecular functions that include the formation, structure and function of the synapse. The associations of the NMDA (N-methyl-D-aspartate) receptor subunit GRIN2A and AMPA (α-amino-3-hydroxy-5-methyl-4-isoxazole propionic acid) receptor subunit GRIA3 provide support for dysfunction of the glutamatergic system as a mechanistic hypothesis in the pathogenesis of schizophrenia. We observe an overlap of rare variant risk among schizophrenia, autism spectrum disorders1, epilepsy and severe neurodevelopmental disorders2, although different mutation types are implicated in some shared genes. Most genes described here, however, are not implicated in neurodevelopment. We demonstrate that genes prioritized from common variant analyses of schizophrenia are enriched in rare variant risk3, suggesting that common and rare genetic risk factors converge at least partially on the same underlying pathogenic biological processes. Even after excluding significantly associated genes, schizophrenia cases still carry a substantial excess of URVs, which indicates that more risk genes await discovery using this approach.


Conflict of interest statement

Competing Interests

M.J.D. is a founder of Maze Therapeutics and RBNC Therapeutics. B.M.N. is a member of the scientific advisory board at Deep Genomics and RBNC Therapeutics, Member of the scientific advisory committee at Milken and a consultant for Camp4 Therapeutics, Merck and Biogen. A.P. is a member of Astra Zeneca’s Genomics Advisory Board. M.C.O, M.J.O, and J.T.W. are supported by a collaborative research grant from Takeda Pharmaceuticals. D.S.P. was an employee of Genomics plc, all analyses reported in this paper were performed as part of D.S.P.’s employment at the Massachusetts General Hospital and Broad Institute. The remaining authors declare no competing interests.

Figures

Extended Data Figure 1.
Extended Data Figure 1.. Schizophrenia case-control enrichment in constrained genes (pLI > 0.9) in different SCHEMA cohorts (n = 22,444 cases and n = 39,837 controls).
The odds ratio and standard error of PTVs and Synonymous variants are provided for each cohort. The meta-analyzed odds ratio and standard error is calculated using inverse-variance. PTVs show consistent signals across the different cohorts, and synonymous variants do not deviate from expectation. Bars represent the 95% CIs of the point estimates.
Extended Data Figure 2.
Extended Data Figure 2.. Schizophrenia case-control enrichment in constrained genes (pLI > 0.9) stratified by different variant annotations and inferred consequences (n = 22,444 cases and n = 39,837 controls).
LoF: all loss-of-function or PTVs; LoFHC: high-confidence LOFTEE PTVs; LoFLC: low-confidence based on LOFTEE; MPC > 3: missense variants with MPC > 3; MPC 2 – 3: missense variants with MPC 2 – 3; Other missense: missense variants with MPC < 2; Syn: synonymous variants. The dot represents the odds ratio, and the bars represent the 95% CIs of the point estimates.
Extended Data Figure 3.
Extended Data Figure 3.. Enrichment of URVs in n = 4,403 ASD and n = 3,292 ADHD cases compared to n = 5,220 controls stratified by variant annotation and consequences in constrained genes (pLI > 0.9).
Two-sided P values from logistic regression displayed are from comparing the burden of variants of the labeled consequence in cases compared to controls. The dot represents the odds ratio, and the bars represent the 95% CIs of the point estimates.
Extended Data Figure 4.
Extended Data Figure 4.. Schizophrenia case-control gene set enrichment in brain and non-brain GTEx tissues.
We test for the burden of rare PTVs in genes with the strongest specific expression in that tissue type relative to other tissues as defined in . Gene set burden statistics are calculated using a logistic regression model of rare variants from n = 22,444 cases and n = 39,837 controls. We report two-sided P values. Each bar is a different tissue in GTEx, grouped by whether it is part of the central nervous system and sorted by P value (Table S8).
Figure 1.
Figure 1.. Study design and analytic approach.
A: Study design. Case-control and parent-proband trio sample sizes, variant classes, and analytical methods are described. The case-control stage is shown on the left, and the de novo mutation stage is shown on the right. B: Principal components analysis of SCHEMA samples. 1000 Genomes samples with reported ancestry are plotted in the background, and SCHEMA samples are displayed in the foreground. For each global ancestry group, we report the number of cases and controls in the discovery data set in red and blue respectively, and the number of external controls in black. AFR: African, ASJ: Ashkenazi Jewish, AMR: Latin American, EAS: East Asian, EST: Estonian, FIN: Finnish, EUR: non-Finnish European, SAS: South Asian. C: Case-control enrichment of ultra-rare protein-coding variants in genes intolerant of protein-truncating variants (n = 22,444 cases and n = 39,837 controls). Two-sided P values from logistic regression displayed are from comparing the burden of variants of the labeled consequence in cases compared to controls. By definition, MPC enrichment is only shown for pLI > 0.9 genes. The dot represents the odds ratio, and the bars represent the 95% CIs of the point estimates. pLI: probability of loss-of-function intolerant in the gnomAD database. D: Enrichment of schizophrenia de novo mutations in P value bins derived from the Stage 1 (case-control) gene burden analysis (n = 3,402 schizophrenia trios). The one-sided enrichment P values displayed are calculated as a Poisson probability having equal or greater than the observed number of mutations given the baseline mutation rate. The relative rate is given by the ratio of observed to expected rate of de novo mutations. The dot represents the relative rate, and the bars represent the 95% CIs of the point estimates.
Figure 2.
Figure 2.. Results from the meta-analysis of ultra-rare coding variants in 3,402 trios, 24,248 cases, and 97,322 controls.
A: Manhattan plot. −log10 P values are plotted against the chromosomal location of each gene. The per-gene P values are calculated by meta-analyzing two-sided burden test P values from rare coding variants in 24,248 cases and 97,322 controls, and one-sided Poisson rate test P values from de novo mutations in 3,402 trios (see text and Supplementary Methods for more information). Genes reaching exome-wide significance (P < 2.14 × 10⁻⁶ corresponding to 0.05/23,321 tests) are in red, and genes significant at FDR < 5% are in orange. Red dashed line: P = 2.14 × 10⁻⁶; Blue dashed line: FDR < 5%, or P = 8.23 × 10⁻⁵. B: Q-Q plot. Observed −log10 P values are plotted against expectation given a uniform distribution. The per-gene P values are calculated by meta-analyzing two-sided burden test P values from rare coding variants in 24,248 cases and 97,322 controls, and one-sided Poisson rate test P values from de novo mutations in 3,402 trios (see text and Supplementary Methods for more information). Genes reaching exome-wide significance are plotted with a larger size. The direction of effect is indicated by the color of each point. The gray shaded area indicates the 95% CI under the null. Dark blue dashed line: P = 2.14 × 10⁻⁶; Light blue dashed line: FDR < 5%.
Figure 3.
Figure 3.. Biological insights from exome sequence data.
A: Common and rare allelic series at NMDA receptor subunit GRIN2A. The Locus Zoom plot (top) displays the common variant (GWAS) association of the gene. The two-sided P values of each SNP from the GWAS meta-analysis are shown along the y-axis. The color of each dot corresponds to the LD with the index SNP, and the properties of the index SNP are displayed. The gene plot (bottom) displays the protein-coding variants that contribute to the exome signal in GRIN2A. Variants discovered in cases are plotted above the gene, and those from control are plotted below. Each variant is colored based on inferred consequence, and the protein domains and missense constrained regions of the gene are also labelled,. The frequencies and counts in cases and controls are displayed for each variant class. AF: allele frequency, AC: allele count. B: Temporal expression of GRIN2A in the human brain (n = 42 samples). We show GRIN2A expression in four prenatal and four postnatal periods derived from whole-brain tissue in BrainSpan. The expression values plotted are in transcript-per-million (TPM). In the box plot, the lower hinge is the 25% quantile, the middle line is the median, the upper hinge is the 75% quantile, the lower whisker extends to the smallest observation greater than or equal to the lower hinge − 1.5 * IQR, and the upper whisker extends to the largest observation less than or equal to the upper hinge + 1.5 * IQR.
Figure 4.
Figure 4.. Shared genetic signal with schizophrenia GWAS.
A: Case-control enrichment of ultra-rare protein-coding variants in genes prioritized from fine-mapping of the PGC schizophrenia GWAS (n = 22,444 cases and n = 39,837 controls). The reported P value is from applying the Fisher’s combined probability method on the two-sided P values of Class I and Class II variants. The dot represents the odds ratio, and the bars represent the 95% CIs of the point estimates. B, C, D: Prioritization of GWAS loci using exome data. The Locus Zoom plot of three GWAS loci is displayed. The two-sided P values of each SNP from the GWAS meta-analysis are shown along the y-axis. Below, for each gene in or adjacent to the region, we show the case-control counts of PTVs in the exome data, along with the two-sided burden test meta-analysis P values. SP4, STAG1 and FAM120A are highlighted as the only genes with notable signals in the exome data within each locus.
Figure 5.
Figure 5.. Shared genetic signal between schizophrenia and other neurodevelopmental disorders.
A: Case-control enrichment of ultra-rare protein-coding variants in DD/ID and ASD-associated genes (n = 22,444 cases and n = 39,837 controls). We test for the burden of schizophrenia URVs in genes identified in the most recent exome sequencing studies of ASD and DD/ID,. The reported P value is from applying the Fisher’s combined probability method on the two-sided P values of Class I and Class II variants. The dot represents the odds ratio, and the bars represent the 95% CIs of the point estimates. B: Heatmap displaying the strength of association for schizophrenia-associated genes in our discovery data set and in genes implicated by de novo mutations in trios diagnosed with DD/ID. We display three groups of genes: Bonferroni significant in schizophrenia and DD/ID, Bonferroni significant only in schizophrenia, and FDR < 5% in schizophrenia and Bonferroni significant in DD/ID. The degree of association from each sequencing study is displayed as the color corresponding to −log10 P values in that study. The two-sided case-control burden test P value is reported for schizophrenia, while one-sided P value from the de novo enrichment using the Poisson rate test is reported for DD/ID. Results are further stratified to tests of Class I (PTV and MPC > 3) and Class II (missense [MPC 2 – 3]) variants. C: Allelic series in TRIO between schizophrenia and DD/ID risk variants. The gene plot displays the protein-coding variants that contribute to the exome signal in TRIO. Variants discovered in schizophrenia cases are plotted above the gene, and missense de novo mutations from DD/ID probands are plotted below. Each variant is colored based on inferred consequence, and the protein domains of the gene are also labelled. The variant counts are displayed for each variant class. D: Allelic series in GRIN2A. See D for description.
Figure 6.
Figure 6.. The contributions of ultra-rare PTVs to schizophrenia risk.
A: Genetic architecture of schizophrenia. Significant genetic associations for schizophrenia from the most recent GWAS, CNV, and sequencing studies are displayed. The in-sample odds ratio is plotted against the minor allele frequency in the general population. The color of each dot corresponds to the source of the association, and the size of the dot to the odds ratio. The shaded area represented the loess-smoothed lines of the upper and lower bounds of the point estimates. B: Case-control enrichment of ultra-rare protein-coding variants in genes intolerant of protein-truncating variants after excluding schizophrenia-associate genes (n = 22,444 cases and n = 39,837 controls). We perform the test with all constrained genes (pLI > 0.9) and after excluding all schizophrenia-associated genes with FDR < 5%. Two-sided P values from logistic regression displayed are from comparing the burden of variants of the labeled consequence in cases compared to controls. The dot represents the odds ratio, and the bars represent the 95% CIs of the point estimates.

Comment in

Similar articles

Cited by

References

    1. Satterstrom FK et al. Large-Scale Exome Sequencing Study Implicates Both Developmental and Functional Changes in the Neurobiology of Autism. Cell (2020) doi:10.1016/j.cell.2019.12.036. - DOI - PMC - PubMed
    1. Kaplanis J et al. Evidence for 28 genetic disorders discovered by combining healthcare and research data. Nature (2020) doi:10.1038/s41586-020-2832-5. - DOI - PMC - PubMed
    1. Schizophrenia Working Group of the Psychiatric Genomics Consortium, Ripke S, Walters JTR & O’Donovan MC Mapping genomic loci prioritises genes and implicates synaptic biology in schizophrenia. medRxiv (2020) doi:10.1101/2020.09.12.20192922. - DOI
    1. McGrath J, Saha S, Chant D & Welham J Schizophrenia: A Concise Overview of Incidence, Prevalence, and Mortality. Epidemiol. Rev 30, 67–76 (2008). - PubMed
    1. Hjorthøj C, Stürup AE, McGrath JJ & Nordentoft M Years of potential life lost and life expectancy in schizophrenia: a systematic review and meta-analysis. The Lancet Psychiatry 4, 295–301 (2017). - PubMed

Substances