. 2022 Dec 15;33(1):50-67.
doi: 10.1093/cercor/bhac052.

Corticocortical innervation subtypes of layer 5 intratelencephalic cells in the murine secondary motor cortex

Affiliations

Corticocortical innervation subtypes of layer 5 intratelencephalic cells in the murine secondary motor cortex

Sanghun Im et al. Cereb Cortex. .

Abstract

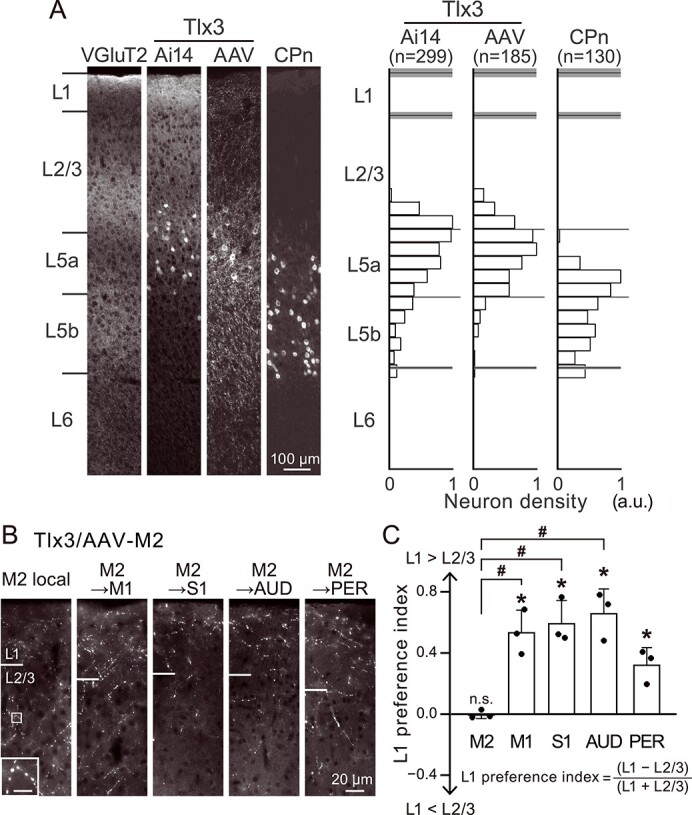
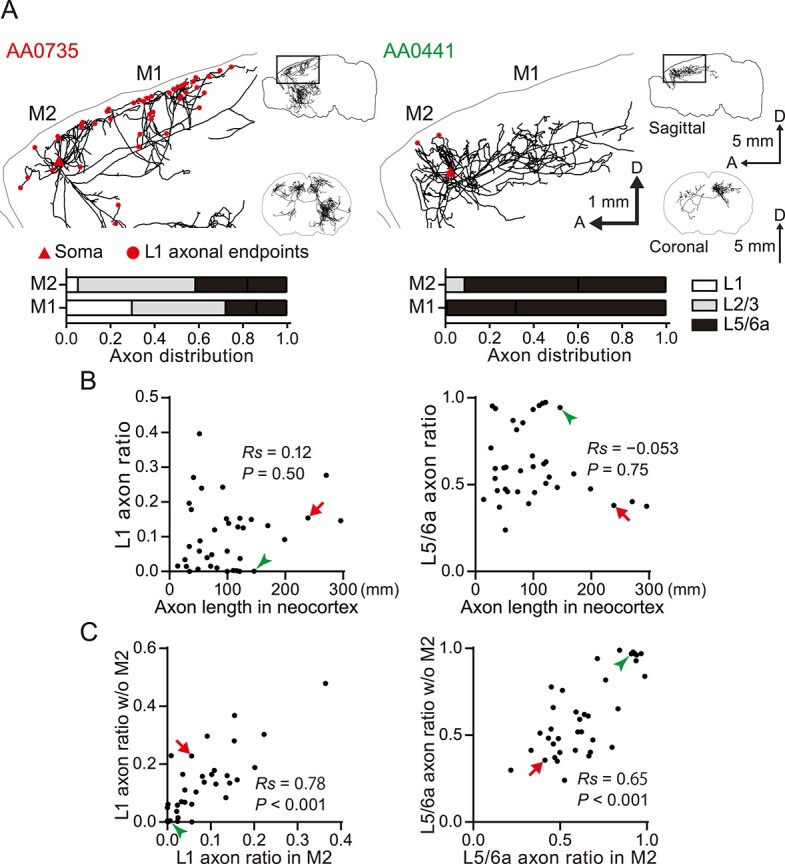
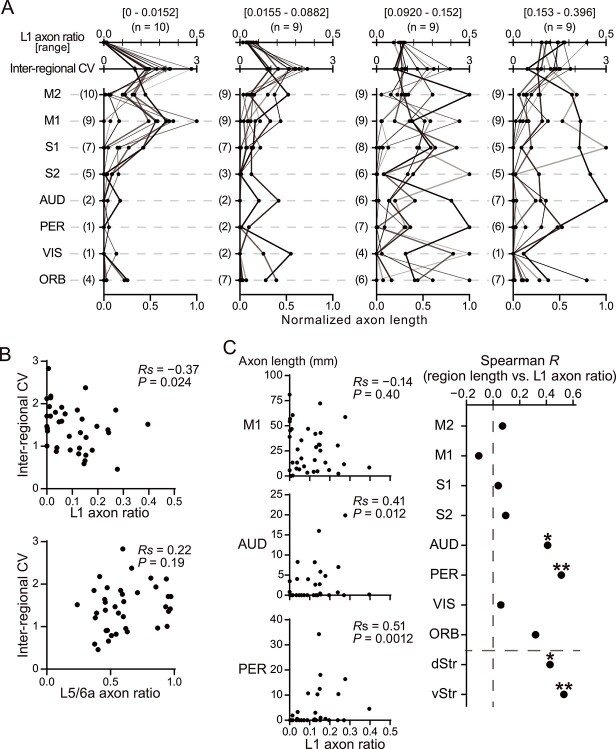
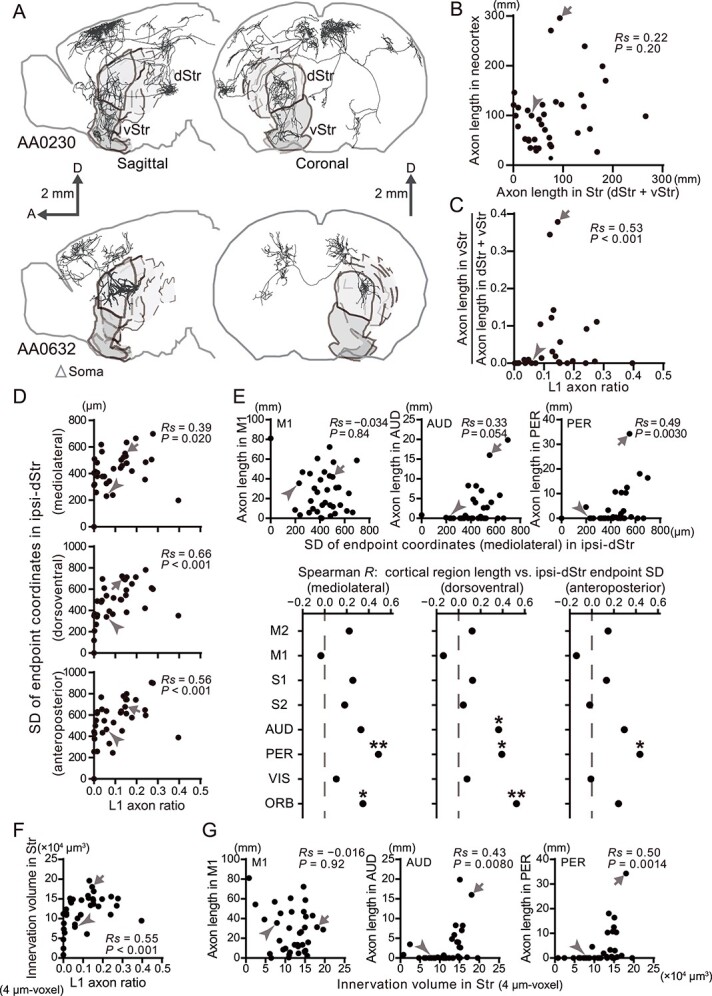
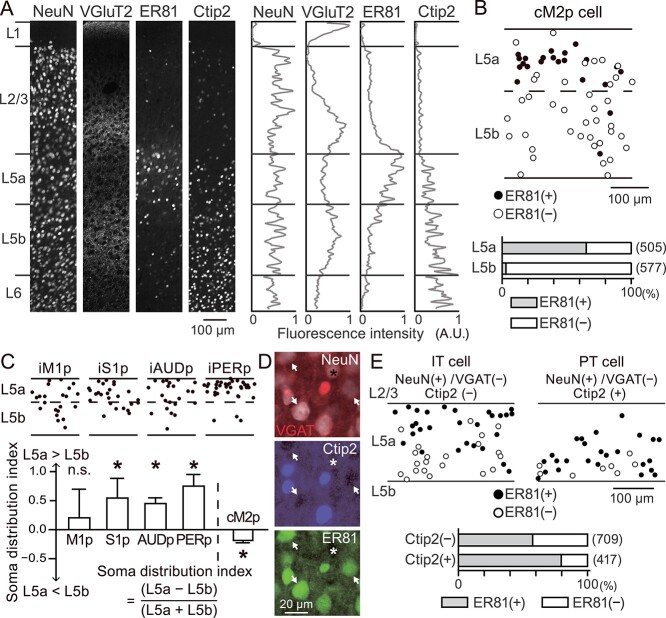
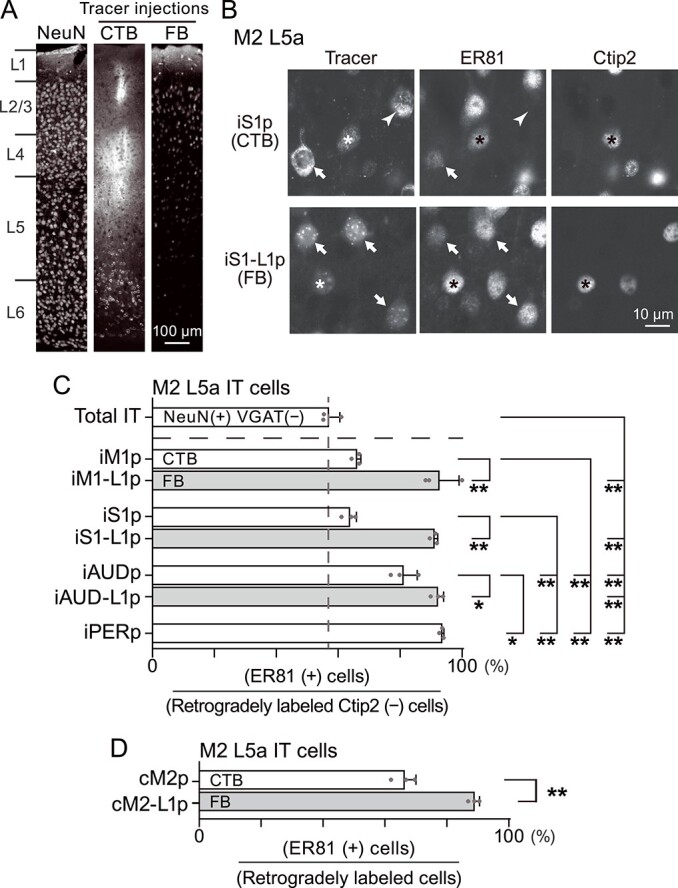
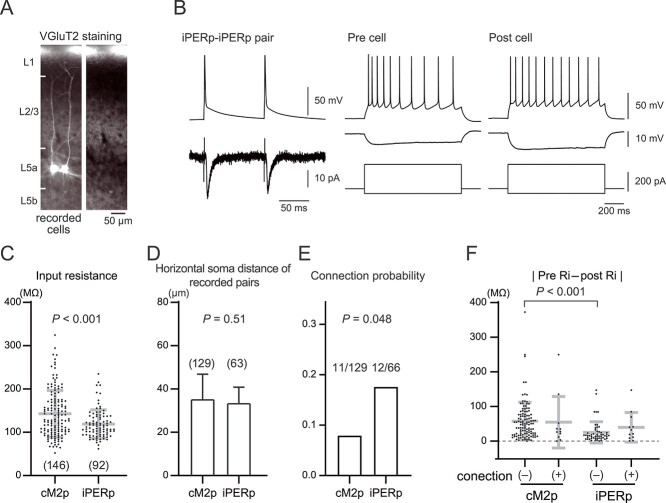
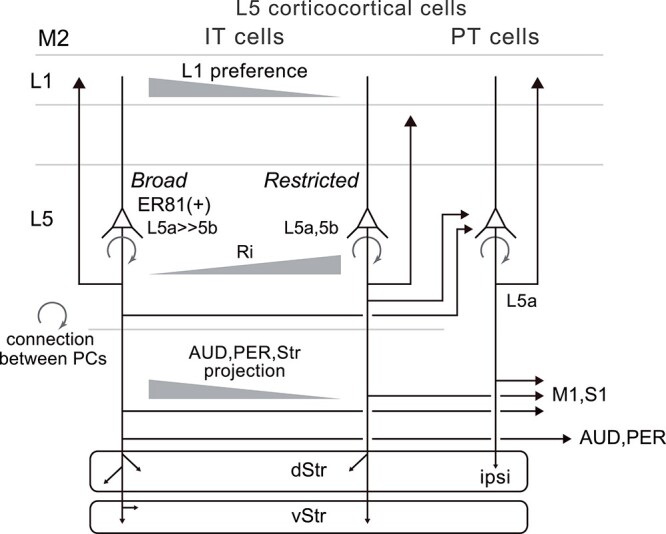
Feedback projections from the secondary motor cortex (M2) to the primary motor and sensory cortices are essential for behavior selection and sensory perception. Intratelencephalic (IT) cells in layer 5 (L5) contribute feedback projections to diverse cortical areas. Here we show that L5 IT cells participating in feedback connections to layer 1 (L1) exhibit distinct projection patterns, genetic profiles, and electrophysiological properties relative to other L5 IT cells. An analysis of the MouseLight database found that L5 IT cells preferentially targeting L1 project broadly to more cortical regions, including the perirhinal and auditory cortices, and innervate a larger volume of striatum than the other L5 IT cells. We found experimentally that in upper L5 (L5a), ER81 (ETV1) was found more often in L1-preferring IT cells, and in IT cells projecting to perirhinal/auditory regions than those projecting to primary motor or somatosensory regions. The perirhinal region-projecting L5a IT cells were synaptically connected to each other and displayed lower input resistance than contra-M2 projecting IT cells including L1-preferring and nonpreferring cells. Our findings suggest that M2-L5a IT L1-preferring cells exhibit stronger ER81 expression and broader cortical/striatal projection fields than do cells that do not preferentially target L1.

Keywords: ER81; MouseLight; corticocortical; corticostriatal; intratelencephalic pyramidal cell.


Figures

Fig. 1
Fig. 1
Axonal distributions of M2 Tlx3 cells of L5 IT subtype. A) Laminar distributions of somata of Tlx3 cells in M2. VGluT2, immunoreactivity used for layer identification; Tlx3, fluorescence detection by crossing with the reporter line (Ai14); that by local virus injection (AAV); CPn cells labeled with a retrograde tracer (CTB). Sections were 200 μm wide and 20 μm thick. Right graph, distribution of the fluorescently labeled somata (Ai14 and CPn, 3 mice; AAV, 2 mice). Cortical thickness was normalized by L5a thickness; depth intervals, one-fifth of L5a thickness; layer border, black line represents mean and gray bar indicates SD. (n), number of cells. B) Axonal distributions of M2 Tlx3 cells in M2 local and ipsilateral cortical regions. Axon fibers were labeled by Cre-dependent induction of synaptophysin-EGFP (AAV5-CAG Double flox synaptophysin-EGFP), which accumulated preferentially at the axon terminals (seen as puncta). Inset in “M2 local”, enlargement of rectangle in L2/3; scale bar, 5 μm. M2, secondary motor cortex; M1, primary motor cortex; S1, primary somatosensory cortex; AUD, auditory cortex including dorsal auditory, primary auditory, posterior auditory, and ventral auditory areas; PER, perirhinal cortex and surrounding areas including perirhinal, ectorhinal, and temporal association areas. C) Comparisons of L1 and L2/3 distribution of M2 Tlx3 cells’ axon puncta in different cortical regions. The difference between L1 and L2/3 was quantified by laminar distribution index of puncta density: positive for L1 preference and negative for L2/3 preference. Data, mean + SD (3 mice for each). *P < 0.05 (one sample t-test, hypothetical value = 0), #P < 0.05 (ordinary one-way ANOVA, P < 0.001; post hoc Tukey’s multiple comparisons test).
Fig. 2
Fig. 2
Heterogeneity in laminar axonal innervation of M2 L5 IT cells obtained from the MouseLight database. A) Two examples of M2-L5 IT cells from the MouseLight database. AA0735, cell with dense axon arborizations in L1; AA0441, with few axon collaterals in L1. Red triangle, soma; red circles, axon endpoints (points without further continuation) in L1. Right, ipsi-hemisphere sagittal projections (top) and coronal projections (bottom) are presented; the rectangle area was enlarged. A, anterior; D, dorsal. Bar graphs, laminar distributions of axon length normalized to the total length in L1/2/3/5/6a of bilateral M2 and M1, respectively. AA0735, 12 endpoints in ipsilateral M2 and 11 endpoints in iM1; AA0441, 2 endpoints in iM2 and 0 endpoints in iM1. B) Relationship of axon distribution ratio in L1 or L5/6a to total axon length in L1/2/3/4/5/6a of bilateral neocortex (37 cells). Rs and P, Spearman correlation test. Red arrow, cell on the left in (A); green arrowhead, cell on the right in (A). C) Relationship of the L1 or L5/6a axon ratio in bilateral neocortex excluding M2 to that in bilateral M2.
Fig. 3
Fig. 3
Correlation between L1-inervation preference and corticocortical projection pattern. A) Relationship of the axon length in respective innervated regions to L1 axon ratio in neocortex. The L1 axon ratio and inter-regional CV (SD/mean of axon lengths in 8 innervated cortical regions) are displayed at the top. The axon length in each region was normalized to the maximum there. Individual M2-L5 IT cells (MouseLight database) are connected by lines. The same cells are connected by distinct grayscale lines to easily distinguish them. For clarity, the M2-L5 IT cells were tentatively divided into 4 groups according to the L1 axon ratio. S2, secondary (supplemental) somatosensory cortex; VIS, visual cortex including anterolateral, anteromedial, lateral, primary, posterolateral, and posteromedial visual areas; ORB, orbital cortex including orbital area, orbital area lateral, medial, and ventrolateral parts. (n), (number of projecting cells). B) Relation of the inter-regional CV to the L1 or L5/L6a axon ratio in neocortex (37 cells). C) Relation of axon length in each innervated region to the L1 axon ratio in neocortex. No correlation was found in M1, but positive correlation was observed in AUD and PER. The coefficient of correlation in each region is shown in the right figure. *P < 0.05; **P < 0.005 (Spearman correlation test). dStr, dorsal striatum. vStr, ventral striatum.
Fig. 4
Fig. 4
Corticostriatal innervation patterns of M2-L5 IT cells. A) Two examples of striatum projecting M2-L5 IT cells. Top, cell with dense axon arborizations in vStr; bottom, with no axon collaterals into vStr. Triangle, soma. A, anterior; D, dorsal. B) Relationship between the axon lengths in whole Str and in neocortex. Arrow, cell on the top in (A); arrowhead, cell at the bottom in (A). Cell number = 37. C) Relationship between the ratio of axon length in vStr to entire Str and the L1 axon ratio. D) Relation of the SD of axonal endpoint coordinates (mediolateral, dorsoventral, and anteroposterior) in ipsilateral dStr to the L1 axon ratio. Cell number = 35. E) Relation of axon length in each cortical region to the SD of endpoints coordinates. The SD of mediolateral endpoint coordinates did not correlate with axon length in M1 but positively correlate with axon length in AUD and PER, shown above. The coefficient of correlation of axon length in each cortical region with SD of mediolateral, dorsoventral, and anteroposterior coordinates is shown below. *P < 0.05; **P < 0.005 (Spearman correlation test). F) Relation of striatal innervation volume (4 μm-voxel) with L1 axon ratio of M2-L5 corticostriatal cells. G) Relation of axon length in each cortical region with striatal innervation volume of the corticostriatal cells.
Fig. 5
Fig. 5
ER81 expression in a subpopulation of IT cells in L5a. A) Laminar distribution of ER81- and Ctip2-positive neurons. The layers were identified by immunofluorescence for NeuN and VGluT2. Sections: 200 μm wide and 20 μm thick. Right, fluorescence intensity was quantified every 5-μm depth and normalized by the maximum value. B) ER81 expression in contralateral M2-projecting (cM2p) cells. Top, cell distributions in L5. Filled circle, positive for ER81; open circle, negative for ER81. Bottom, proportion of ER81-positive cells in L5a and L5b cM2p cells (3 mice). (n), number of cells. C) Distribution of corticocortical cells in L5a and L5b, labeled retrogradely from other regions. Top: filled circle, retrogradely labeled neuron; laminar depth, normalized by L5a thickness. Bottom: soma distribution index between L5a and L5b (positive, more cells in L5a); data, mean + SD (4 mice for iM1p and iS1p, 3 mice for iAUDp, iPERp, and cM2p); *P < 0.05 (one sample t-test, hypothetical value = 0). iM1p, iS1p, iAUDp, and iPERp: cells projecting to ipsilateral M1, S1, AUD, and PER, respectively. D) ER81 expression heterogeneity in L5a IT cells. L5a IT cells were identified by NeuN expression (in white; top) without VGAT-tdTomato (in red) and Ctip2 expression (in blue; middle). Fluorescence, represented by pseudocolors. Arrows, ER81-positive IT cells; asterisk, ER81-negative IT cells. E) ER81 expression in IT and PT cells in M2-L5a, which were negative and positive for Ctip2, respectively. Top, cell distributions in L5a. Bottom, proportion of ER81-positive cells in Ctip2-negative IT and -positive PT cells (3 mice). (n), number of cells.
Fig. 6
Fig. 6
ER81 expression in M2-L5a is related to L1 innervation and corticocortical projection pattern. A) Two kinds of retrograde labeling: CTB injection across all layers and FB application onto the cortical surface (L1p: L1 projecting). For the CTB injection photograph, three images were overlaid. B) ER81 expression in iS1p and iS1-L1p cells. Top: iS1p IT cells (negative for Ctip2; shown in right) were positive (arrow) or negative (arrowhead) for ER81. Asterisk, cell positive for both Ctip2 and ER81. Bottom: iS1-L1p IT cells (negative for Ctip2; shown right) were positive for ER81 (arrows). C) Proportion of ER81 cells in ipsilateral corticocortical L5a IT cells. Total IT, the proportion of ER81 cells in L5a IT cells (the same data set as in Fig. 5E). The proportion was higher in cells projecting to iAUD and iPER than those to iM1 and iS1 and higher in iM1-L1p, iS1-L1p, and iAUD-L1p cells than in iM1p, iS1p, and iAUDp cells, respectively (3 mice for each). *P < 0.05 **P < 0.005 (ordinary one-way ANOVA, P < 0.001; post hoc Tukey’s multiple comparisons test). D) Proportion of ER81-positive cells in L5a cM2p IT cells. The proportion was higher in cM2-L1p cells than in cM2p cells (3 mice for each). **P < 0.005 (unpaired t-test).
Fig. 7
Fig. 7
Electrophysiological and connection properties of cM2p and iPERp cells in mouse M2. A) Simultaneously recorded cM2p cells in L5a. L5a was identified by weaker immunofluorescence for VGluT2. B) EPSC induction in iPER cell pairs. Left, two presynaptic spikes (interval, 100 ms) above and EPSCs in a postsynaptic cell below. Right, pre- and postsynaptic cell responses to depolarizing (250 pA, 1 s) and hyperpolarizing (−50 pA) current pulses. C) Input resistance (Ri) of cM2p and iPERp cells. (n), number of cells. P, Mann–Whitney U test. D) Horizontal distance of somata in recorded cell pairs. (n), number of synaptic directions tested. E) Connection probability in cM2p and iPERp cell pairs (129 and 66 directions, respectively). P, chi-square test. F) Input resistance (Ri) difference between simultaneously recorded cells without or with synaptic connections. Ri difference was smaller in unconnected iPERp pairs (25.4 ± 30.6 MΩ, n = 52) than unconnected cM2p pairs (57.7 ± 54.4 MΩ, n = 114; P < 0.001), but not different between connected cM2p and iPERp pairs (54.6 ± 74.4 MΩ for connected cM2p pairs, n = 11; 39.9 ± 42.7 MΩ for connected iPERp pairs, n = 12; P = 0.83).
Fig. 8
Fig. 8
Corticocortical innervation subtypes of M2-L5 pyramidal cells. Broad projection IT cells target more diverse cortical and striatal areas, innervate L1 more densely, and express ER81 more frequently than restricted projection IT cells. L5a PT cells innervate L1, like broad IT cells. They project to M1 but not to the perirhinal cortex, like restricted IT cells. IT cells innervate bilateral dorsal and ventral striatum, but PT cells only ipsilateral striatum.

Similar articles

Cited by

References

    1. Arber S, Ladle DR, Lin JH, Frank E, Jessell TM. ETS gene Er81 controls the formation of functional connections between group Ia sensory afferents and motor neurons. Cell. 2000:101:485–498. - PubMed
    1. Arlotta P, Molyneaux BJ, Chen J, Inoue J, Kominami R, Macklis JD. Neuronal subtype-specific genes that control corticospinal motor neuron development in vivo. Neuron. 2005:45:207–221. - PubMed
    1. Avesar D, Gulledge AT. Selective serotonergic excitation of callosal projection neurons. Front Neural Circuits. 2012:6:12. - PMC - PubMed
    1. Baker A, Kalmbach B, Morishima M, Kim J, Juavinett A, Li N, Dembrow N. Specialized subpopulations of deep-layer pyramidal neurons in the neocortex: bridging cellular properties to functional consequences. J Neurosci. 2018:38:5441–5455. - PMC - PubMed
    1. Barbas H. General cortical and special prefrontal connections: principles from structure to function. Annu Rev Neurosci. 2015:38:269–289. - PubMed

Publication types