Randomized Controlled Trial
. 2022 Aug;40(8):800-813.
doi: 10.1007/s11604-022-01270-5. Epub 2022 Apr 9.

Newly developed artificial intelligence algorithm for COVID-19 pneumonia: utility of quantitative CT texture analysis for prediction of favipiravir treatment effect

Affiliations
Randomized Controlled Trial

Newly developed artificial intelligence algorithm for COVID-19 pneumonia: utility of quantitative CT texture analysis for prediction of favipiravir treatment effect

Yoshiharu Ohno et al. Jpn J Radiol. 2022 Aug.

Abstract

Purpose: Using CT findings from a prospective, randomized, open-label multicenter trial of favipiravir treatment of COVID-19 patients, the purpose of this study was to compare the utility of machine learning (ML)-based algorithm with that of CT-determined disease severity score and time from disease onset to CT (i.e., time until CT) in this setting.

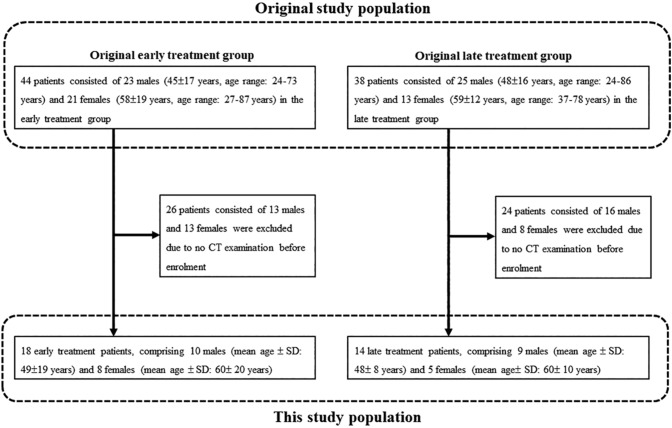
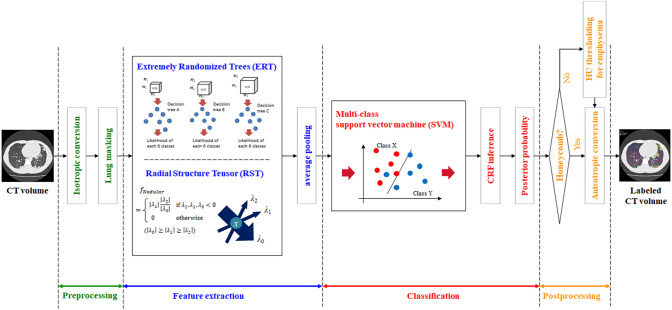
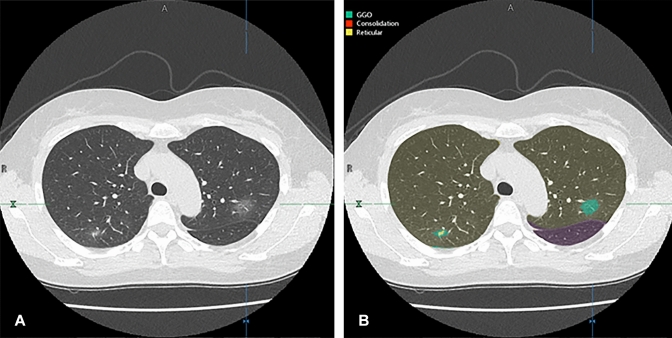
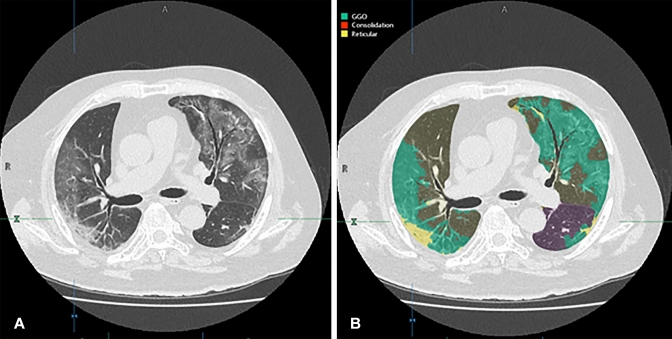
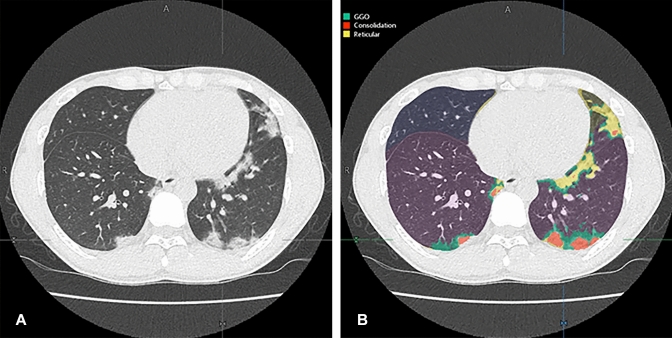
Materials and methods: From March to May 2020, 32 COVID-19 patients underwent initial chest CT before enrollment were evaluated in this study. Eighteen patients were randomized to start favipiravir on day 1 (early treatment group), and 14 patients on day 6 of study participation (late treatment group). In this study, percentages of ground-glass opacity (GGO), reticulation, consolidation, emphysema, honeycomb, and nodular lesion volumes were calculated as quantitative indexes by means of the software, while CT-determined disease severity was also visually scored. Next, univariate and stepwise regression analyses were performed to determine relationships between quantitative indexes and time until CT. Moreover, patient outcomes determined as viral clearance in the first 6 days and duration of fever were compared for those who started therapy within 4, 5, or 6 days as time until CT and those who started later by means of the Kaplan-Meier method followed by Wilcoxon's signed-rank test.

Results: % GGO and % consolidation showed significant correlations with time until CT (p < 0.05), and stepwise regression analyses identified both indexes as significant descriptors for time until CT (p < 0.05). When divided all patients between time until CT of 4 days and that of more than 4 days, accuracy of the combined quantitative method (87.5%) was significantly higher than that of the CT disease severity score (62.5%, p = 0.008).

Conclusion: ML-based CT texture analysis is equally or more useful for predicting time until CT for favipiravir treatment on COVID-19 patients than CT disease severity score.

Keywords: COVID-19; CT; Favipiravir; Machine learning.


Figures

Fig. 1
Fig. 1
Patients’ flowchart
Fig. 2
Fig. 2
Flowchart of three-dimensional (3D) machine learning for CT texture analysis. Flowchart of the proposed method. At the feature extraction stage, likelihood of each texture pattern’s occurrence on every voxel is calculated. At the classification stage, probability of each texture pattern is calculated from the features extracted on each voxel. Finally, each voxel is labeled with a specific texture pattern showing the maximum posterior probability
Fig. 3
Fig. 3
A 53-year-old female COVID-19 patient whose CT image was obtained 3 days after onset of clinical symptoms and assigned to the early treatment group in the original multicenter study. A Thin-section CT shows ground-glass opacities (GGOs) in the bilateral upper lobes. B Thin-section CT analyzed using the machine learning-based software shows GGOs as green areas and reticulation as a yellow area. % GGO in this case was assessed as 6%, and % consolidation as 0.3%. Probability within 4, 5, and 6 days from clinical onset determined with the combined method as 0.58, 0.58, and 0.64, respectively. CT disease severity score was 3. Prediction for this patient assigned to the early treatment group was based on %GGO, % consolidation, combined method, and CT disease severity score. After administration of favipiravir, periods for viral clearance, duration of fever, and time until hospital discharge were 1 day, 1 day, and 14 days, respectively
Fig. 4
Fig. 4
A 27-year-old male COVID-19 patient whose CT image was obtained 7 days after onset of clinical symptoms and assigned to the early treatment group in the original multicenter study. A Thin-section CT shows ground-glass opacities (GGOs) and reticulations in the bilateral lungs. B Thin-section CT analyzed using the machine learning-based software shows GGOs as green areas and reticulation as a yellow area. % GGO in this case was assessed as 16.8%, and % consolidation as 2.8%. Probability within 4, 5, and 6 days from clinical onset determined with the combined method as 0.62, 0.56, and 0.74, respectively. CT disease severity score was 17. Prediction for this patient assigned to the early treatment group was based on % consolidation and combined method. After administration of favipiravir, periods for viral clearance, duration of fever, and time until hospital discharge were 2 days, 1 day, and 14 days, respectively
Fig. 5
Fig. 5
A 29-year-old female COVID-19 patient whose CT image was obtained 10 days after onset of clinical symptoms and assigned to the early treatment group in the original multicenter study. A Thin-section CT shows CGOs, reticulation and consolidation in both lungs. B Thin-section CT analyzed using the machine learning-based software shows GGOs as green areas, reticulation as a yellow area and consolidation as an orange area. % GGO in this case was assessed as 2.5%, and % consolidation as 8.9%. Probability within 4, 5, and 6 days from clinical onset determined with the combined method as 0.23, 0.23, and 0.31, respectively. CT disease severity score was 5. Prediction for this patient assigned to the early treatment group was based on only %GGO, and others were accurately predicted as late response case. After administration of favipiravir, periods for viral clearance, duration of fever and time until hospital discharge were 5 days, 3 days, and 21 days, respectively

Comment in

References

    1. Guan WJ, Ni ZY, Hu Y, China Medical Treatment Expert Group for Covid-19 et al. Clinical Characteristics of coronavirus disease 2019 in China. N Engl J Med. 2020;382(18):1708–1720. doi: 10.1056/NEJMoa2002032. - DOI - PMC - PubMed
    1. Yang X, Yu Y, Xu J, et al. Clinical course and outcomes of critically ill patients with SARS-CoV-2 pneumonia in Wuhan, China: a single-centered, retrospective, observational study. Lancet Respir Med. 2020;8(5):475–481. doi: 10.1016/S2213-2600(20)30079-5. - DOI - PMC - PubMed
    1. Feng Y, Ling Y, Bai T, et al. COVID-19 with different severities: a multicenter study of clinical features. Am J Respir Crit Care Med. 2020;201(11):1380–1388. doi: 10.1164/rccm.202002-0445OC. - DOI - PMC - PubMed
    1. Shi F, Wang J, Shi J, et al. Review of artificial intelligence techniques in imaging data acquisition, segmentation, and diagnosis for COVID-19. IEEE Rev Biomed Eng. 2021;14:4–15. doi: 10.1109/RBME.2020.2987975. - DOI - PubMed
    1. Wang Y, Zhang D, Du G, et al. Remdesivir in adults with severe COVID-19: a randomised, double-blind, placebo-controlled, multicentre trial. Lancet. 2020;395(10236):1569–1578. doi: 10.1016/S0140-6736(20)31022-9. - DOI - PMC - PubMed

Publication types