. 2022 Apr 9;10(1):12.
doi: 10.1186/s40345-022-00258-4.

Anticipating manic and depressive transitions in patients with bipolar disorder using early warning signals

Affiliations

Anticipating manic and depressive transitions in patients with bipolar disorder using early warning signals

Fionneke M Bos et al. Int J Bipolar Disord. .

Abstract

Background: In bipolar disorder treatment, accurate episode prediction is paramount but remains difficult. A novel idiographic approach to prediction is to monitor generic early warning signals (EWS), which may manifest in symptom dynamics. EWS could thus form personalized alerts in clinical care. The present study investigated whether EWS can anticipate manic and depressive transitions in individual patients with bipolar disorder.

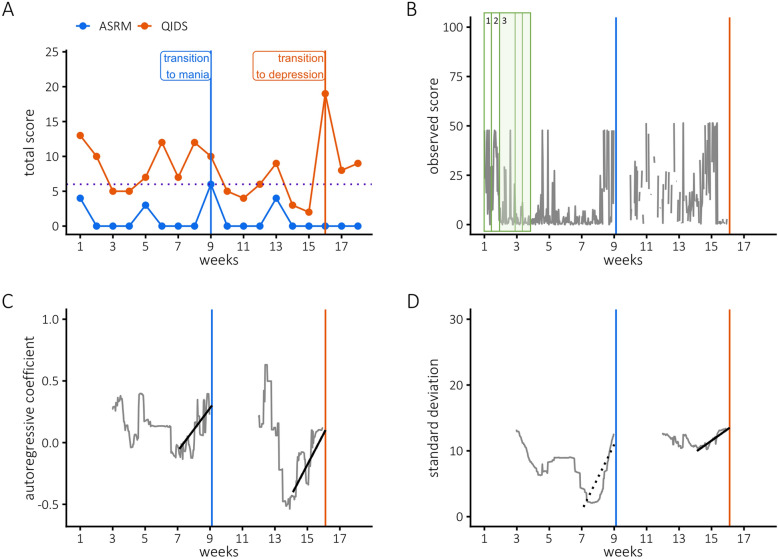
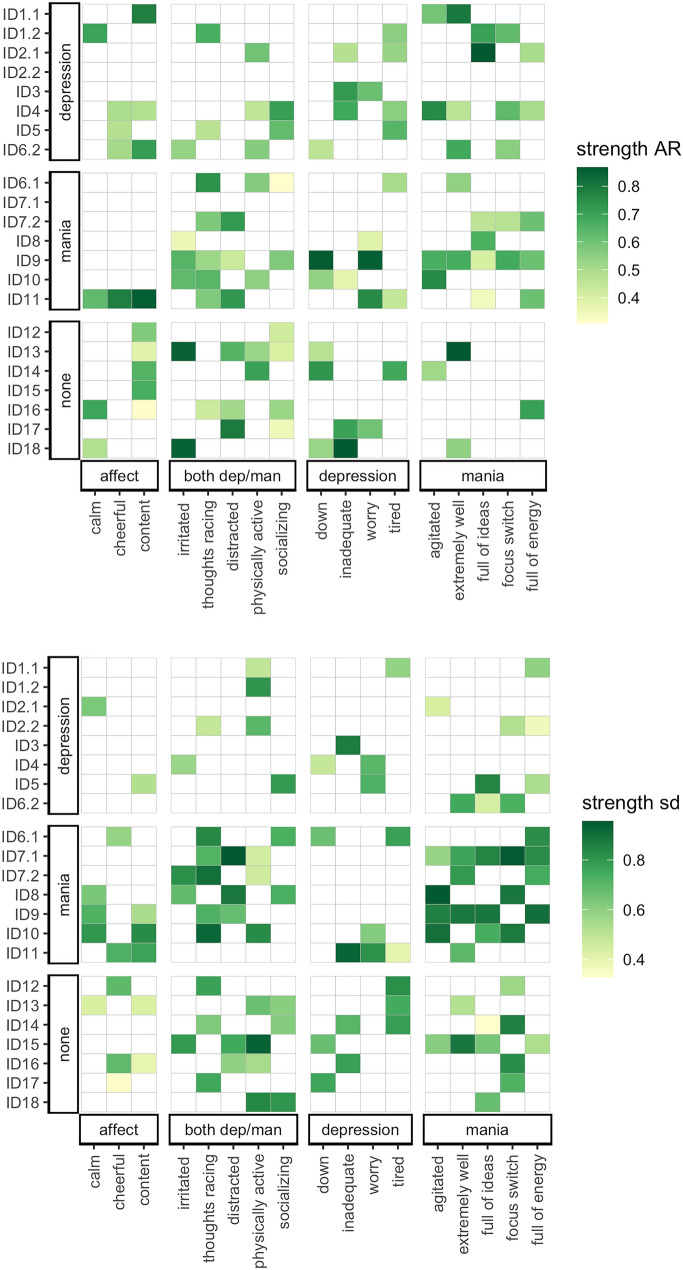
Methods: Twenty bipolar type I/II patients (with ≥ 2 episodes in the previous year) participated in ecological momentary assessment (EMA), completing five questionnaires a day for four months (Mean = 491 observations per person). Transitions were determined by weekly completed questionnaires on depressive (Quick Inventory for Depressive Symptomatology Self-Report) and manic (Altman Self-Rating Mania Scale) symptoms. EWS (rises in autocorrelation at lag-1 and standard deviation) were calculated in moving windows over 17 affective and symptomatic EMA states. Positive and negative predictive values were calculated to determine clinical utility.

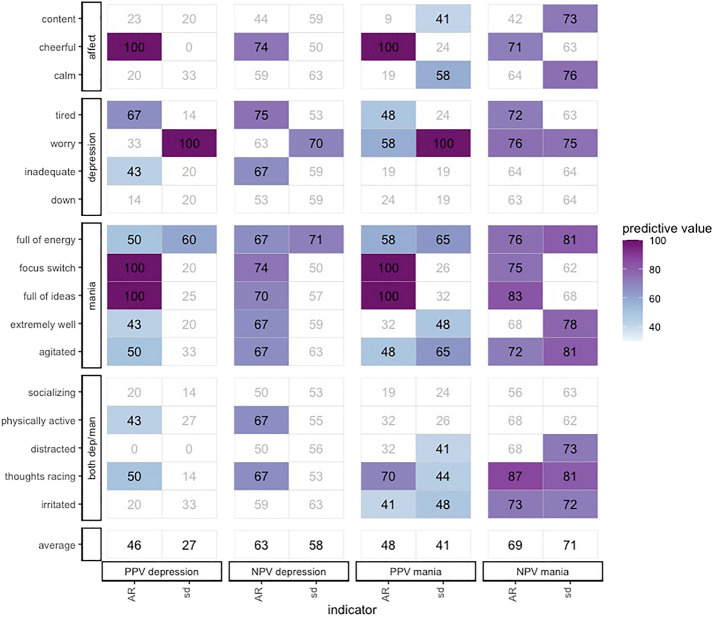
Results: Eleven patients reported 1-2 transitions. The presence of EWS increased the probability of impending depressive and manic transitions from 32-36% to 46-48% (autocorrelation) and 29-41% (standard deviation). However, the absence of EWS could not be taken as a sign that no transition would occur in the near future. The momentary states that indicated nearby transitions most accurately (predictive values: 65-100%) were full of ideas, worry, and agitation. Large individual differences in the utility of EWS were found.

Conclusions: EWS show theoretical promise in anticipating manic and depressive transitions in bipolar disorder, but the level of false positives and negatives, as well as the heterogeneity within and between individuals and preprocessing methods currently limit clinical utility.

Keywords: Bipolar disorder; Complexity; Critical transitions; Dynamical systems; Early detection; Early warning signals; Ecological momentary assessment; Experience sampling methodology; Mobile Health; Single-subject; Smartphone.


Conflict of interest statement

The authors declare that they have no competing interests.

Figures

Fig. 1
Fig. 1
An illustration of early warning signals in one individual (ID6) in the item “I feel extremely well”. A depicts weekly manic (Altman Self-Rating Scale, ASRM, blue) and depressive (Quick Inventory of Depressive Symptomatology, QIDS-SR, red) symptom scores. At week 8 and 15, she reports an abrupt transition to a manic and depressive episode, respectively. Figure 1B visualizes her raw ecological momentary assessment (EMA) scores on “feeling extremely well”. Higher scores indicate she is feeling more euphoric. We iteratively fitted windows containing two weeks of observations (green rectangles). These windows slided through the time series, meaning that the first window contained observations 1–70, the second window contained observations 2–71, etc. Note that the windows in the figure solely serve to illustrate the main idea behind the analyses. Within each window, we computed the autocorrelation and standard deviation as early warning signals (EWS). This yielded surrogate time series of the autocorrelation and standard deviation. As shown in Fig. 1C, significant EWS were found prior to the manic transition (Kendall’s Tau = .54, corrected p < .001) as well as the depressive transition (Kendall’s Tau = .68, corrected p < 0.001). Figure 1D shows an EWS in the standard deviation prior to the depressive transition (Kendall’s Tau = .75, corrected p < 0.001), but not prior to the manic transition (Kendall’s Tau = .50, corrected p = 0.07)
Fig. 2
Fig. 2
Individual differences in the type and strength of the early warning signal. The x-axis represents each EMA momentary state, the y-axis each transition. Note that four individuals had two transitions (denoted by digits, with the lowest digit corresponding to the first transition). EWS were detected using moving window analyses (window = 2 weeks). To facilitate interpretation, the EMA momentary states were assigned to summary categories based on hypothesized underlying constructs. A colored block indicates that the EWS was significant for that transition. The color intensity indicates the strength of the EWS: the more intense the color, the stronger the EWS. Strength of the EWS was operationalized as the value of Kendall’s tau. Abbreviations: AR autocorrelation at lag-1, EMA ecological momentary assessment, EWS early warning signal, sd = standard deviation
Fig. 3
Fig. 3
Positive and negative predictive values for each early warning signal. The y-axis represents each momentary state, the x-axis the positive (PPV) and negative (NPV) predictive value, separated for manic and depressive transitions and for the two early warning signals (EWS) indicators: the autocorrelation (AR) and standard deviation (SD). The predictive values can be compared against the prevalence of the transition: the proportion of manic (32%), depressive (36%), or no transitions (68% for mania and 64% for depression). White tiles indicate that this EWS did not improve the detection of a transition above the prevalence of that transition. The color indicates the magnitude of the predictive value for that EWS: the more intense the color, the higher the predictive value. To facilitate interpretation, the EMA momentary states were assigned to summary categories based on hypothesized underlying constructs

References

    1. Altman DG, Bland JM. Statistics notes: diagnostic tests 2: predictive values. BMJ. 1994;309:102. doi: 10.1136/bmj.309.6947.102. - DOI - PMC - PubMed
    1. Altman EG, Hedeker D, Peterson JL, Davis JM. The altman self-rating mania scale. Biolpsychiatry. 1997;42(10):948. - PubMed
    1. Auguie B. gridExtra: Miscellaneous Functions for "Grid" Graphics. R package version 2.3. https://CRAN.R-project.org/package=gridExtra. 2017.
    1. Bayani A, Hadaeghi F, Jafari S, Murray G. Critical slowing down as an early warning of transitions in episodes of bipolar disorder: a simulation study based on a computational model of circadian activity rhythms. Chronobiol Int. 2017;34(2):235–245. doi: 10.1080/07420528.2016.1272608. - DOI - PubMed
    1. Benjamini Y, Hochberg Y. Controlling the false discovery rate: a practical and powerful approach to multiple testing. J Roy Stat Soc B. 1995;57(1):289–300.