

Perinatal risk factors for mortality in very preterm infants-A nationwide, population-based discriminant analysis
- PMID: 35397189
- PMCID: PMC9546293
- DOI: 10.1111/apa.16356
Perinatal risk factors for mortality in very preterm infants-A nationwide, population-based discriminant analysis
Abstract
Aim: To assess the strength of associations between interrelated perinatal risk factors and mortality in very preterm infants.
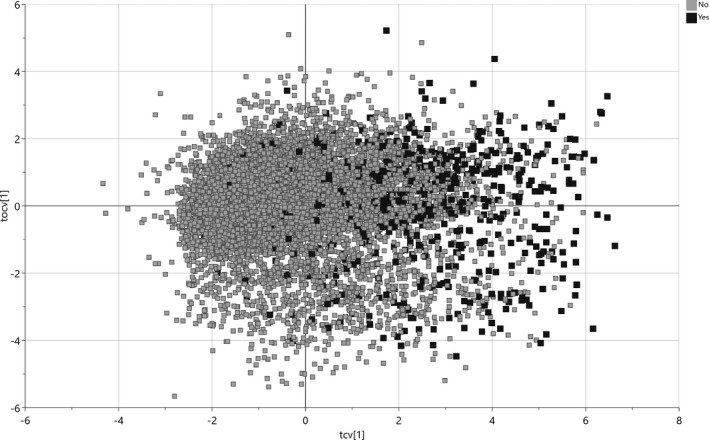
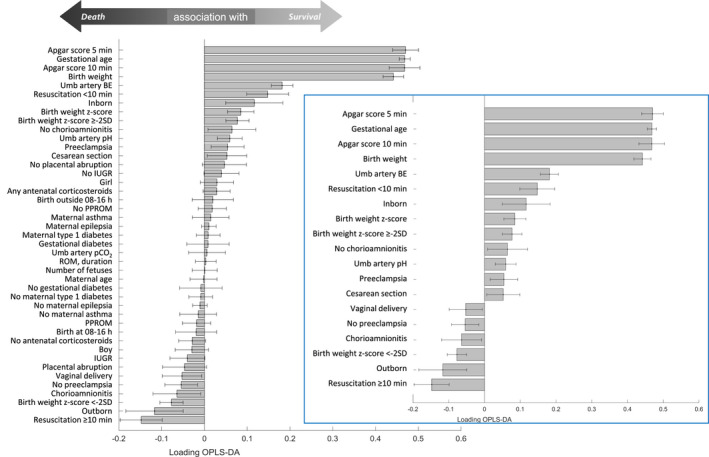
Methods: Information on all live-born infants delivered in Sweden at 22-31 weeks of gestational age (GA) from 2011 to 2019 was gathered from the Swedish Neonatal Quality Register, excluding infants with major malformations or not resuscitated because of anticipated poor prognosis. Twenty-seven perinatal risk factors available at birth were exposures and in-hospital mortality outcome. Orthogonal partial least squares discriminant analysis was applied to assess proximity between individual risk factors and mortality, and receiver operating characteristic (ROC) curves were used to estimate discriminant ability.
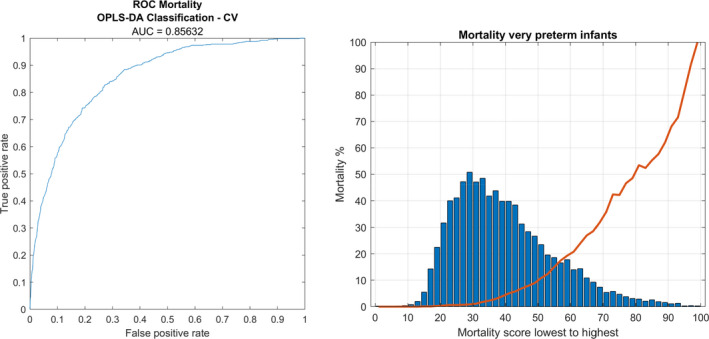
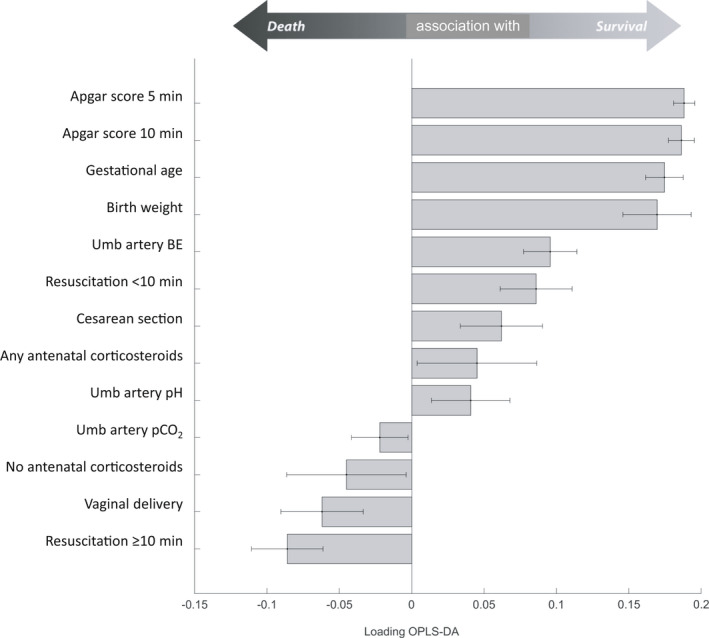
Results: In total, 638 of 8,396 (7.6%) infants died. Thirteen risk factors discriminated reduced mortality; the most important were higher Apgar scores at 5 and 10 min, GA and birthweight. Restricting the analysis to preterm infants <28 weeks' GA (n = 2939, 16.9% mortality) added antenatal corticosteroid therapy as significantly associated with lower mortality. The area under the ROC curve (the C-statistic) using all risk factors was 0.86, as determined after both internal and external validation.
Conclusion: Apgar scores, gestational age and birthweight show stronger associations with mortality in very preterm infants than several other perinatal risk factors available at birth.
Keywords: infant mortality; orthogonal partial least squares discriminant analysis; preterm infant.
© 2022 The Authors. Acta Paediatrica published by John Wiley & Sons Ltd on behalf of Foundation Acta Paediatrica.
Conflict of interest statement
The authors have no conflict of interest to disclose.
Figures
Similar articles
-
The very preterm infant - a population-based study.Acta Obstet Gynecol Scand. 2001 Jun;80(6):525-31. Acta Obstet Gynecol Scand. 2001. PMID: 11380288
-
One-year survival of extremely preterm infants after active perinatal care in Sweden.JAMA. 2009 Jun 3;301(21):2225-33. doi: 10.1001/jama.2009.771. JAMA. 2009. PMID: 19491184
-
A national short-term follow-Up study of extremely low birth weight infants born in Finland in 1996-1997.Pediatrics. 2001 Jan;107(1):E2. doi: 10.1542/peds.107.1.e2. Pediatrics. 2001. PMID: 11134466
-
The effect of customization and use of a fetal growth standard on the association between birthweight percentile and adverse perinatal outcome.Am J Obstet Gynecol. 2018 Feb;218(2S):S738-S744. doi: 10.1016/j.ajog.2017.11.563. Epub 2017 Dec 2. Am J Obstet Gynecol. 2018. PMID: 29199029
-
[Perinatal risk factors for congenital hypothyroidism in very preterm infants: a multicenter prospective study].Zhonghua Er Ke Za Zhi. 2022 Jun 2;60(6):545-550. doi: 10.3760/cma.j.cn112140-20211219-01054. Zhonghua Er Ke Za Zhi. 2022. PMID: 35658360 Chinese.
Cited by
-
Identification of Neonatal Factors Predicting Pre-Discharge Mortality in Extremely Preterm or Extremely Low Birth Weight Infants: A Historical Cohort Study.Children (Basel). 2024 Nov 28;11(12):1453. doi: 10.3390/children11121453. Children (Basel). 2024. PMID: 39767882 Free PMC article.
References
-
- Liu L, Oza S, Hogan D, et al. Global, regional, and national causes of child mortality in 2000–13, with projections to inform post‐2015 priorities: an updated systematic analysis. Lancet. 2015;385(9966):430‐440. - PubMed
-
- Harrison MS, Goldenberg RL. Global burden of prematurity. Semin Fetal Neonatal Med. 2016;21(2):74‐79. - PubMed
-
- The International Neonatal Network . The CRIB. (Clinical Risk Index for Babies) score: a tool for assessing initial neonatal risk and comparing performance of neonatal intensive care units. Lancet. 1993;342(8865):193‐198. - PubMed
-
- Richardson DK, Corcoran JD, Escobar GJ, Lee SK. SNAP‐II and SNAPPE‐II: simplified newborn illness severity and mortality risk scores. J Pediatr. 2001;138(1):92‐100. - PubMed
MeSH terms
Grants and funding
LinkOut - more resources
Full Text Sources
Medical
