

Association mapping reveals a reciprocal virulence/avirulence locus within diverse US Pyrenophora teres f. maculata isolates
- PMID: 35397514
- PMCID: PMC8994276
- DOI: 10.1186/s12864-022-08529-1
Association mapping reveals a reciprocal virulence/avirulence locus within diverse US Pyrenophora teres f. maculata isolates
Abstract
Background: Spot form net blotch (SFNB) caused by the necrotrophic fungal pathogen Pyrenophora teres f. maculata (Ptm) is an economically important disease of barley that also infects wheat. Using genetic analysis to characterize loci in Ptm genomes associated with virulence or avirulence is an important step to identify pathogen effectors that determine compatible (virulent) or incompatible (avirulent) interactions with cereal hosts. Association mapping (AM) is a powerful tool for detecting virulence loci utilizing phenotyping and genotyping data generated for natural populations of plant pathogenic fungi.
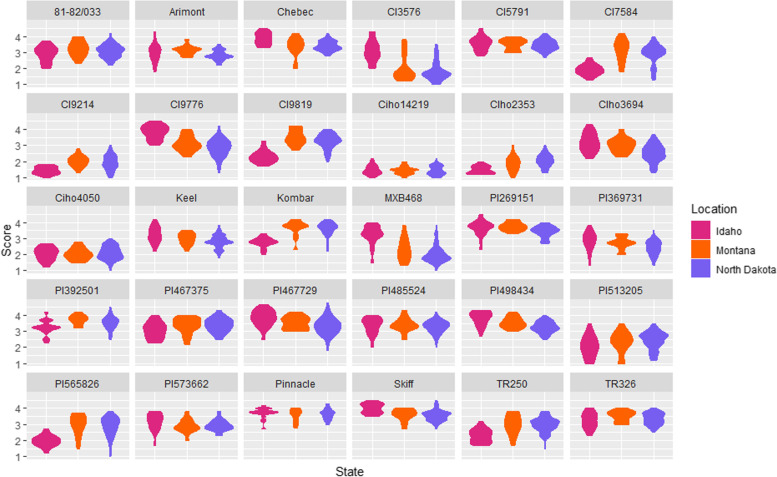
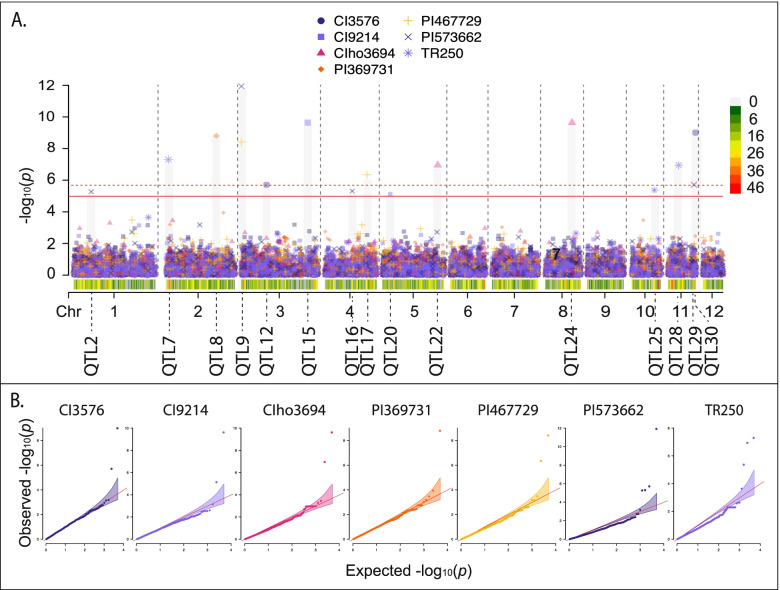
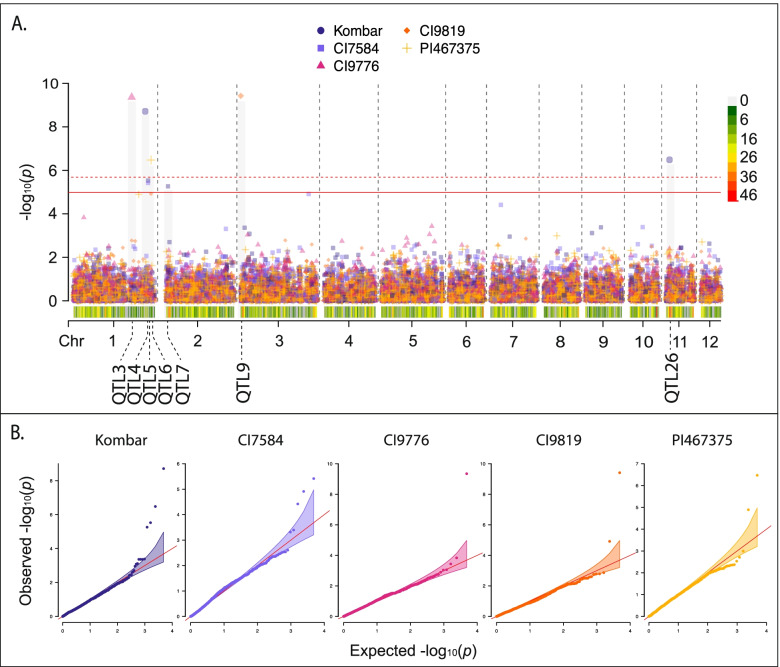
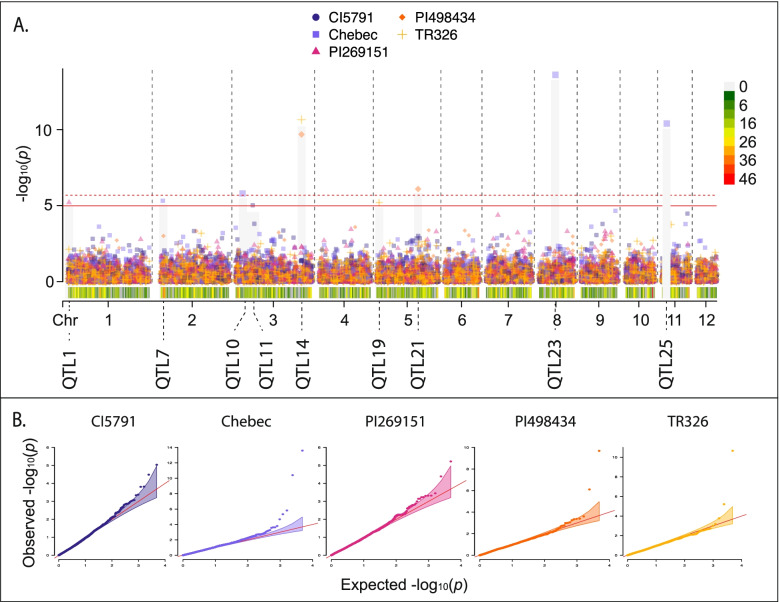
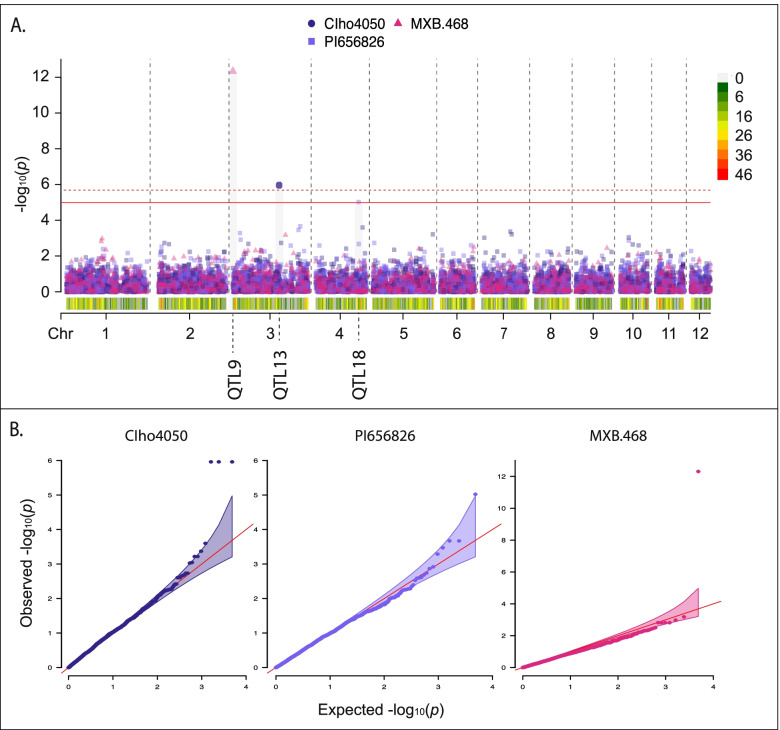
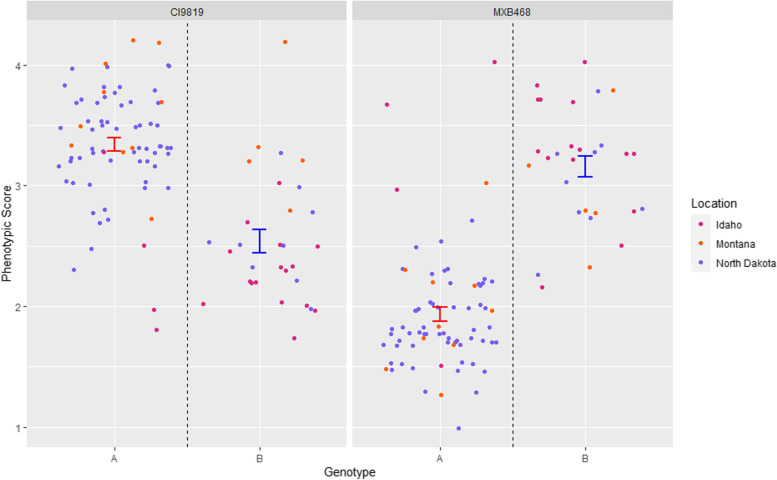
Results: Restriction-site associated DNA genotyping-by-sequencing (RAD-GBS) was used to generate 4,836 single nucleotide polymorphism (SNP) markers for a natural population of 103 Ptm isolates collected from Idaho, Montana and North Dakota. Association mapping analyses were performed utilizing the genotyping and infection type data generated for each isolate when challenged on barley seedlings of thirty SFNB differential barley lines. A total of 39 marker trait associations (MTAs) were detected across the 20 barley lines corresponding to 30 quantitative trait loci (QTL); 26 novel QTL and four that were previously mapped in Ptm biparental populations. These results using diverse US isolates and barley lines showed numerous barley-Ptm genetic interactions with seven of the 30 Ptm virulence/avirulence loci falling on chromosome 3, suggesting that it is a reservoir of diverse virulence effectors. One of the loci exhibited reciprocal virulence/avirulence with one haplotype predominantly present in isolates collected from Idaho increasing virulence on barley line MXB468 and the alternative haplotype predominantly present in isolates collected from North Dakota and Montana increasing virulence on barley line CI9819.
Conclusions: Association mapping provided novel insight into the host pathogen genetic interactions occurring in the barley-Ptm pathosystem. The analysis suggests that chromosome 3 of Ptm serves as an effector reservoir in concordance with previous reports for Pyrenophora teres f. teres, the causal agent of the closely related disease net form net blotch. Additionally, these analyses identified the first reported case of a reciprocal pathogen virulence locus. However, further investigation of the pathosystem is required to determine if multiple genes or alleles of the same gene are responsible for this genetic phenomenon.
Keywords: Association mapping; Barley; Pyrenophora teres f. maculata; Reciprocal virulence/avirulence.
© 2022. The Author(s).
Conflict of interest statement
The authors declare that they have no competing interests.
Figures
Similar articles
-
Genetic analysis of virulence in the Pyrenophora teres f. teres population BB25×FGOH04Ptt-21.Fungal Genet Biol. 2017 Oct;107:12-19. doi: 10.1016/j.fgb.2017.07.003. Epub 2017 Jul 17. Fungal Genet Biol. 2017. PMID: 28728987
-
Pyrenophora teres: profile of an increasingly damaging barley pathogen.Mol Plant Pathol. 2011 Jan;12(1):1-19. doi: 10.1111/j.1364-3703.2010.00649.x. Mol Plant Pathol. 2011. PMID: 21118345 Free PMC article. Review.
-
Association mapping of seedling resistance to spot form net blotch in a worldwide collection of barley.Phytopathology. 2015 Apr;105(4):500-8. doi: 10.1094/PHYTO-04-14-0106-R. Phytopathology. 2015. PMID: 25870925
-
Characterizing the Pyrenophora teres f. maculata-Barley Interaction Using Pathogen Genetics.G3 (Bethesda). 2017 Aug 7;7(8):2615-2626. doi: 10.1534/g3.117.043265. G3 (Bethesda). 2017. PMID: 28659291 Free PMC article.
-
Research advances in the Pyrenophora teres-barley interaction.Mol Plant Pathol. 2020 Feb;21(2):272-288. doi: 10.1111/mpp.12896. Epub 2019 Dec 13. Mol Plant Pathol. 2020. PMID: 31837102 Free PMC article. Review.
Cited by
-
Mini review: Targeting below-ground plant performance to improve nitrogen use efficiency (NUE) in barley.Front Genet. 2023 Mar 2;13:1060304. doi: 10.3389/fgene.2022.1060304. eCollection 2022. Front Genet. 2023. PMID: 36935938 Free PMC article. Review.
-
Association mapping with a diverse population of Puccinia graminis f. sp. tritici identified avirulence loci interacting with the barley Rpg1 stem rust resistance gene.BMC Genomics. 2024 Aug 1;25(1):751. doi: 10.1186/s12864-024-10670-y. BMC Genomics. 2024. PMID: 39090588 Free PMC article.
-
High resolution mapping of a novel non-transgressive hybrid susceptibility locus in barley exploited by P. teres f. maculata.BMC Plant Biol. 2024 Jun 29;24(1):622. doi: 10.1186/s12870-024-05303-1. BMC Plant Biol. 2024. PMID: 38951756 Free PMC article.
-
Multi-parental fungal mapping population study to detect genomic regions associated with Pyrenophora teres f. teres virulence.Sci Rep. 2023 Jun 16;13(1):9804. doi: 10.1038/s41598-023-36963-y. Sci Rep. 2023. PMID: 37328500 Free PMC article.
References
-
- McLean MS, Howlett BJ, Hollaway GJ. Spot form of net blotch, caused by Pyrenophora teres f. maculata, is the most prevalent foliar disease of barley in Victoria, Australia. Australas Plant Pathol. 2010;39:46–9. doi: 10.1071/AP09054. - DOI
-
- Jayasena KW, Van Burgel A, Tanaka K, Majewski J, Loughman R. Yield reduction in barley in relation to spot-type net blotch. Australas Plant Pathol. 2007;36:429–33. doi: 10.1071/AP07046. - DOI
-
- Perelló AE, Couretot L, Curti A, Uranga JP, Consolo VF. First report of spot lesion of wheat caused by Pyrenophora teres f. sp maculata observed in Argentina. Crop Prot. 2019;122:19–22. doi: 10.1016/j.cropro.2019.03.023. - DOI
-
- Uranga JP, Schierenbeck M, Perelló AE, Lohwasser U, Börner A, Simón MR. Localization of QTL for resistance to Pyrenophora teres f. maculata, a new wheat pathogen. Euphytica. 2020;216:1–13. doi: 10.1007/s10681-020-02593-y. - DOI
MeSH terms
Supplementary concepts
LinkOut - more resources
Full Text Sources
