. 2022 Jun 14;55(6):1105-1117.e4.
doi: 10.1016/j.immuni.2022.03.019. Epub 2022 Mar 25.

A large-scale systematic survey reveals recurring molecular features of public antibody responses to SARS-CoV-2

Affiliations

A large-scale systematic survey reveals recurring molecular features of public antibody responses to SARS-CoV-2

Yiquan Wang et al. Immunity. .

Abstract

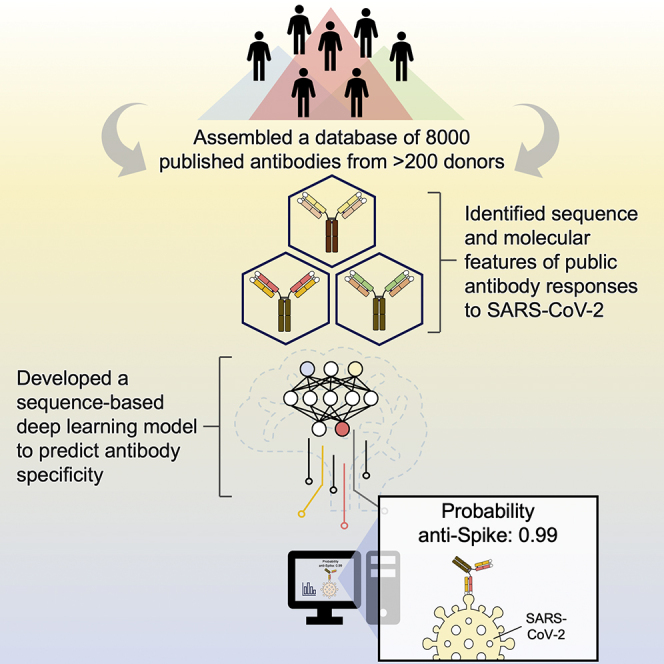
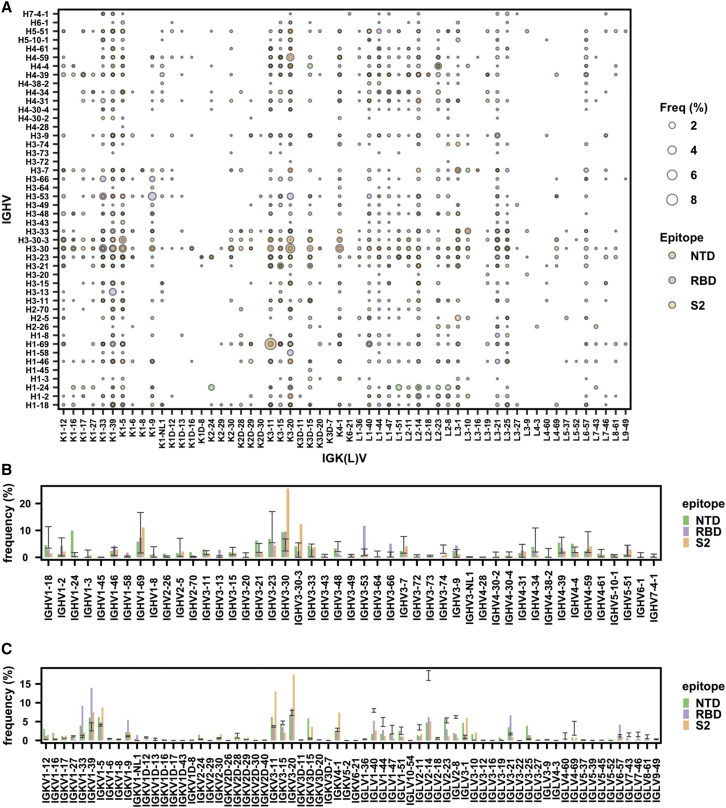
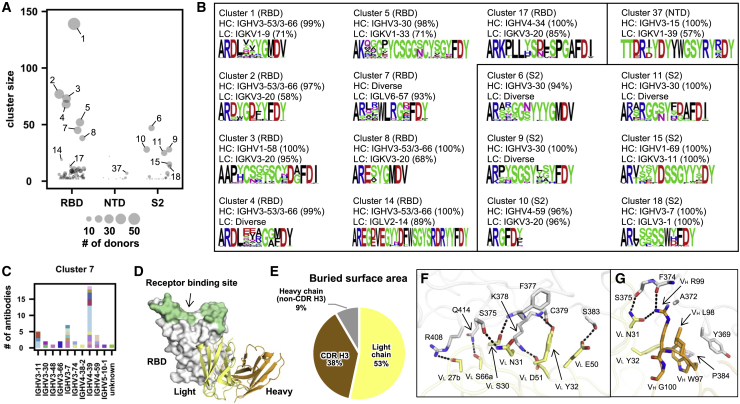
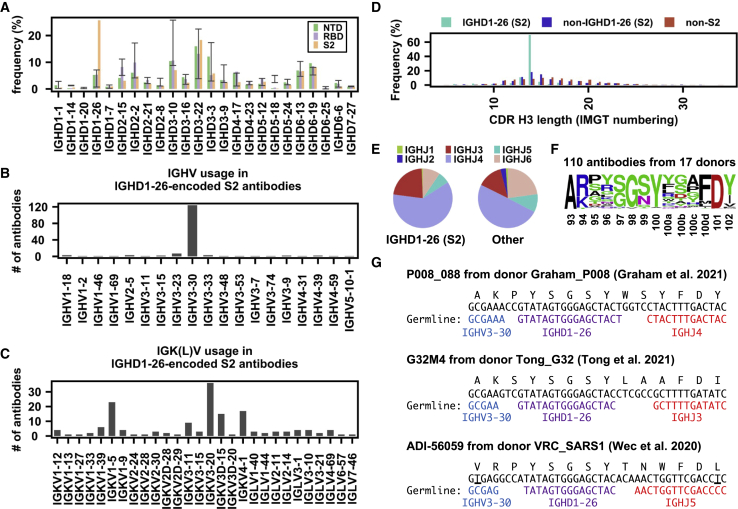
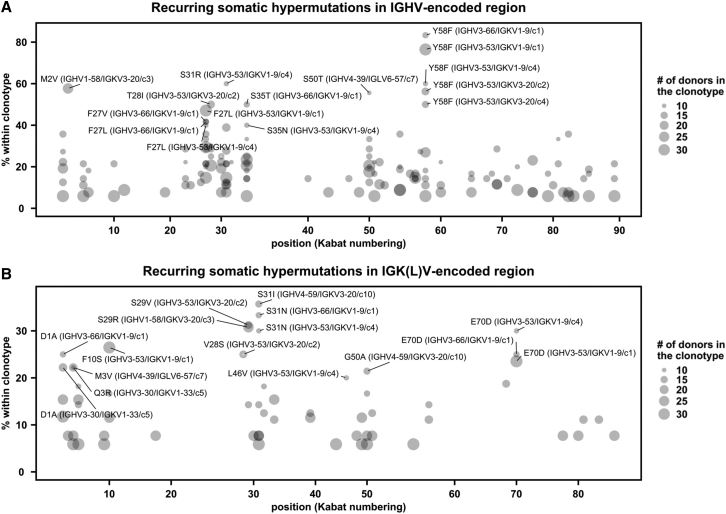
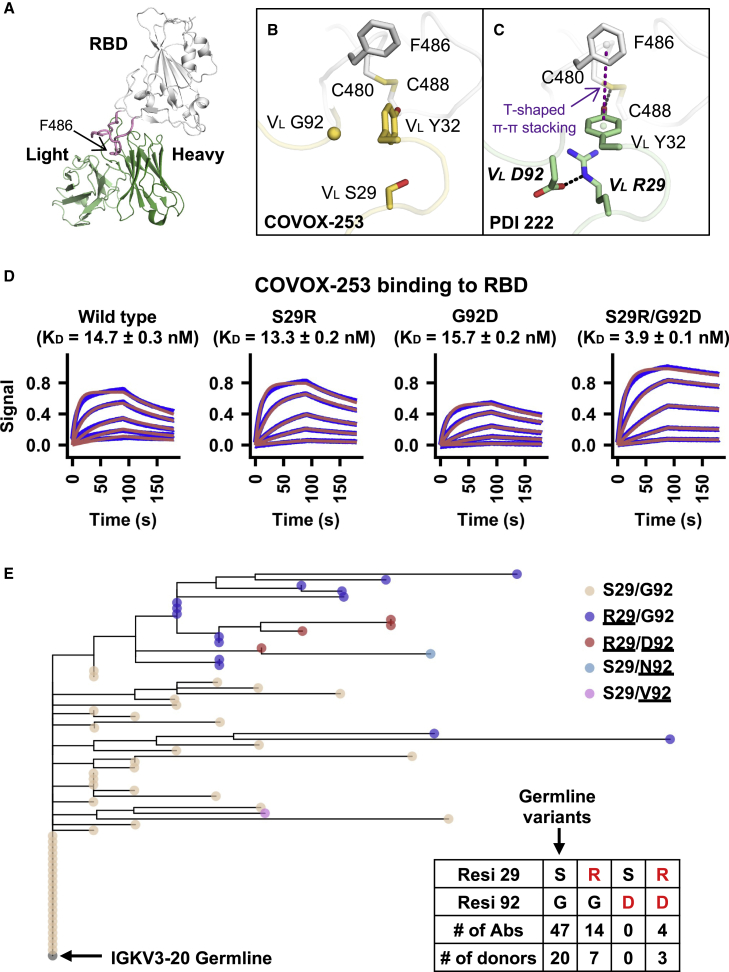
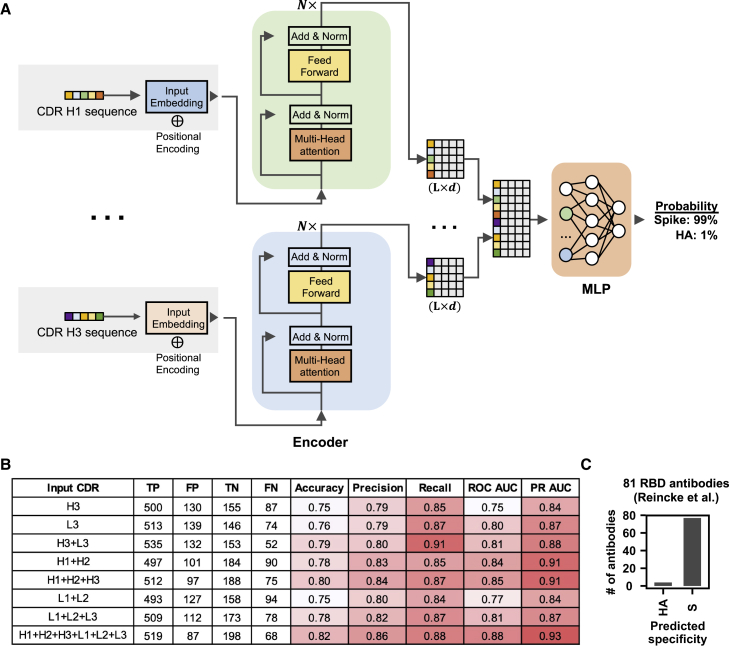
Global research to combat the COVID-19 pandemic has led to the isolation and characterization of thousands of human antibodies to the SARS-CoV-2 spike protein, providing an unprecedented opportunity to study the antibody response to a single antigen. Using the information derived from 88 research publications and 13 patents, we assembled a dataset of ∼8,000 human antibodies to the SARS-CoV-2 spike protein from >200 donors. By analyzing immunoglobulin V and D gene usages, complementarity-determining region H3 sequences, and somatic hypermutations, we demonstrated that the common (public) responses to different domains of the spike protein were quite different. We further used these sequences to train a deep-learning model to accurately distinguish between the human antibodies to SARS-CoV-2 spike protein and those to influenza hemagglutinin protein. Overall, this study provides an informative resource for antibody research and enhances our molecular understanding of public antibody responses.

Keywords: COVID-19; SARS-CoV-2; affinity maturation; antibody; data mining; deep learning; public antibody response; sequence analysis; somatic hypermutation; structural analysis.


Conflict of interest statement

Declaration of interests The authors declare no competing interests.

Figures

None
Graphical abstract
Figure 1
Figure 1
Antibodies to different domains of SARS-CoV-2 S have distinct patterns of V gene usage (A) The frequency of different V gene pairings between heavy and light chains are shown for SARS-CoV-2 S antibodies to RBD, NTD, and S2. The size of each data point represents the frequency of the corresponding IGHV/IGK(L)V pair within its epitope category. Only those antibodies where both IGHV and IGK(L)V information is available for both heavy and light chains were included in this analysis. (B) The IGHV gene usage in antibodies to NTD, RBD, and S2 is shown. Only those antibodies with IGHV information available were included in this analysis. (C) The IGK(L)V gene usage in antibodies to NTD, RBD, and S2 is shown. Only those antibodies with IGK(L)V information available were included in this analysis. (B and C) Error bars represent the frequency range among 26 healthy donors (Briney et al., 2019; Guo et al., 2019; Soto et al., 2019). See also Figure S1 and Tables S1 and S2.
Figure 2
Figure 2
SARS-CoV-2 S antibodies exhibit convergent CDR H3 sequences (A) CDR H3 sequences from individual antibodies were clustered using a 80% sequence identity cutoff (see STAR Methods). The epitope of each CDR H3 cluster is classified based on that of its antibody members. Cluster size represents the number of antibodies within the cluster. (B) The V gene usage and CDR H3 sequence are shown for each of the 16 CDR H3 clusters of interest. For each of the CDR H3 cluster of interest, the CDR H3 sequences are shown as a sequence logo, where the height of each letter represents the frequency of the corresponding amino-acid variant (single-letter amino-acid code) at the indicated position. The dominant germline V genes (>50% usage among all antibodies within a given CDR H3 cluster) are listed. Diverse: no germline V genes had >50% frequency among all antibodies within a given CDR H3 cluster. HC, heavy chain; LC, light chain. Clusters with the same domain specificity are grouped in the same box. (C) IGHV usage in cluster 7 is shown. Different colors represent different donors. Unknown: IGHV information is not available. (D) An overall view of SARS-CoV-2 RBD in complex with IGLV6-57 antibody S2A4 (PDB 7JVA) (Piccoli et al., 2020), which belongs to cluster 7, is shown. The RBD is in white with the receptor-binding site highlighted in green. The heavy and light chains of S2A4 are in orange and yellow, respectively. (E) Percentages of the S2A4 epitope that are buried by the light chain, heavy chain (without CDR H3), and CDR H3 are shown as a pie chart. Buried surface area (BSA) was calculated by proteins, interfaces, structures, and assemblies (PISA) at the European Bioinformatics Institute (https://www.ebi.ac.uk/pdbe/prot_int/pistart.html) (Krissinel and Henrick, 2007). (F and G) Detailed interactions between the (F) light and (G) heavy chains of S2A4 and SARS-CoV-2 RBD. Hydrogen bonds and salt bridges are represented by black dashed lines. The color coding is the same as (D). See also Figures S2–S4 and Tables S1 and S2.
Figure 3
Figure 3
IGHD1-26 is enriched among SARS-CoV-2 S2 antibodies (A) The IGHD gene usage in NTD, RBD, S2 antibodies is shown. Error bars represent the frequency range among 26 healthy donors. (B and C) (B) IGHV gene usage and (C) IGK(L)V gene usage among IGHD1-26 S2 antibodies is shown (n = 157). (D) The distribution of CDR H3 length (IMGT numbering) in IGHD1-26 S2 antibodies (n = 157), non-IGHD1-26 S2 antibodies (n = 533), and non-S2 S antibodies (n = 5,090) are shown. (E) The IGHJ gene usage among IGHD1-26 S2 antibodies (n = 157) and other S antibodies with well-defined epitopes (n = 5,623) is shown. (F) The CDR H3 sequences for IGHD1-26 S2 antibodies (n = 110) are shown as a sequence logo. (G) Amino acid and nucleotide sequences of the V-D-J junction are shown for three IGHD1-26 S2 antibodies (Graham et al., 2021; Tong et al., 2021; Wec et al., 2020). While P008_088 and G32M4 were from SARS-CoV-2-infected individuals, ADI-56059 was from a SARS-CoV survivor. Putative germline sequences and segments were identified by IgBlast (Ye et al., 2013) and are indicated. Somatically mutated nucleotides are underlined. Intervening spaces at the V-D and D-J junctions are N-nucleotide additions. See also Tables S1 and S2.
Figure 4
Figure 4
SARS-CoV-2 S antibodies contain recurring somatic hypermutations (SHMs) (A and B) For each public clonotype, if the exact same SHM emerged in at least two donors, such SHM is classified as a recurring SHM. Only those public clonotypes that can be observed in at least nine donors are shown. (A) Recurring SHMs in heavy-chain V genes. (B) Recurring SHMs in light-chain V genes. x axis represents the position on the V gene (Kabat numbering). y axis represents the percentage of donors who carry a given recurring SHM among those who carry the public clonotype of interest. For example, VL S29R emerged in 8 donors out of 26 donors that carry a public clonotype that is encoded by IGHV1-58/IGKV3-20. As a result, VL S29R (IGHV1-58/IGKV3-20) is 31% (8/26) within the corresponding clonotype. Of note, since each public clonotype is also defined by the similarity of CDR H3 (see STAR Methods), there could be multiple clonotypes with the same heavy- and light-chain V genes (e.g., IGHV3-53/IGKV1-9). The CDR H3 cluster ID for each clonotype is indicated with a prefix “c,” following the information of the V genes. For heavy chain, SHMs that emerged in at least 40% of the donors of the corresponding clonotype are labeled. For light chain, SHMs that emerged in at least 20% of the donors of the corresponding clonotype are labeled. See also Figure S5 and Table S1.
Figure 5
Figure 5
Two recurring SHMs synergistically drive the affinity maturation of a IGHV1-58/IGKV3-20 public clonotype (A) An overall view of SARS-CoV-2 RBD in complex with the IGHV1-58/IGKV3-20 antibody PDI 222 (PDB 7RR0) (Wheatley et al., 2021). The RBD is shown in white, while the heavy and light chains of the antibody are in dark and light green, respectively. The ridge region (residues 471–491) is shown in pink. (B and C) Structural comparison between two IGHV1-58/IGKV3-20 antibodies that either (B) carry germline residues VL S29/G92 (COVOX-253, PDB 7BEN) (Dejnirattisai et al., 2021) and (C) somatically hypermutated residues VL R29/D92 (PDI 222, PDB 7RR0) (Wheatley et al., 2021). SARS-CoV-2 RBD is in white, while antibodies are in yellow (COVOX-253) and green (PDI 222). Somatically mutated residues are labeled with bold and italic letters. The T-shaped π-π stacking between RBD-F486 and VL Y32 is indicated by a purple dashed line. Hydrogen bond and salt bridge are represented by black dashed lines. (D) Binding kinetics between COVOX-253 Fabs (wild type or mutants) and SARS-CoV-2 RBD were measured by biolayer interferometry (BLI). y axis represents the response. Blue lines represent the response curves and red lines represent the 1:1 binding model. Binding kinetics were measured for five concentrations of the RBDs at 3-fold dilution ranging from 300 to 3.7 nM. The dissociation constant (KD) values ± standard deviations are indicated. (E) A phylogenetic tree was constructed for the light-chain sequences of 67 antibodies in the IGHV1-58/IGKV3-20 public clonotype. The phylogenetic tree was rooted using the germline sequence of IGKV3-20. Each tip represents one antibody and is colored according to the corresponding amino acid variants at VL residues 29 and 92. Amino acid variants that represent SHM are underlined. Numbers of antibodies in the IGHV1-58/IGKV3-20 public clonotype carrying the germline-encoded variant at VL residues 29 and 92 (S29, G92), as well as VL SHM S29R and G92D (red) are listed in the inset table. Of note, one antibody in this IGHV1-58/IGKV3-20 public clonotype carries S29/N92 and another carries S29/V92. However, they are not listed in the table here.
Figure 6
Figure 6
Specificity of antibodies can be predicted by a sequence-based deep learning model (A) A schematic overview of the deep learning model architecture. (B) For evaluating model performance, S antibodies and HA antibodies were considered “positive” and “negative,” respectively. Model performance on the test set was compared when different input types were used. Of note, the test set has no overlap with the training set and the validation set, both of which were used to construct the deep learning model. True positive (TP) represents the number of S antibodies being correctly classified as S antibodies. False positive (FP) represents the number of HA antibodies being misclassified as S antibodies. True negative (TN) represents the number of HA antibodies being correctly classified as HA antibodies. False negative (FN) represents the number of S antibodies being misclassified as HA antibodies. See STAR Methods for the calculations of accuracy, precision, recall, ROC AUC, and PR AUC. (C) The antigen specificity of 81 RBD antibodies from Reincke et al. (2022) were predicted by a deep learning model that was trained to distinguish between S antibodies and HA antibodies. See also Figure S6 and Table S3. The dataset for constructing and testing the deep-learning model, related to Figure 6, Table S4. Performance of the deep learning model with different inputs, related to Figure 6, Table S5. Prediction result of 81 antibodies to SARS-CoV-2 RBD that were elicited by Beta variant infection, related to Figure 6, Table S6. Prediction result of 691 HIV antibodies from GenBank, related to Figure 6.

Update of

References

    1. Abadi M., Barham P., Chen J., Chen Z., Davis A., Dean J., Devin M., Ghemawat S., Irving G., Isard M., et al. 2016. TensorFlow: a system for large-scale machine learning. Paper presented at: Proceedings of the 12th USENIX Symposium on Operating Systems Design and Implementation.
    1. Álvarez-Prado Á.F., Pérez-Durán P., Pérez-García A., Benguria A., Torroja C., de Yébenes V.G., Ramiro A.R. A broad atlas of somatic hypermutation allows prediction of activation-induced deaminase targets. J. Exp. Med. 2018;215:761–771. - PMC - PubMed
    1. Anderson R.J., Weng Z., Campbell R.K., Jiang X. Main-chain conformational tendencies of amino acids. Proteins. 2005;60:679–689. - PubMed
    1. Andrews S.F., McDermott A.B. Shaping a universally broad antibody response to influenza amidst a variable immunoglobulin landscape. Curr. Opin. Immunol. 2018;53:96–101. - PubMed
    1. Barnes C.O., Jette C.A., Abernathy M.E., Dam K.A., Esswein S.R., Gristick H.B., Malyutin A.G., Sharaf N.G., Huey-Tubman K.E., Lee Y.E., et al. SARS-CoV-2 neutralizing antibody structures inform therapeutic strategies. Nature. 2020;588:682–687. - PMC - PubMed

Publication types

Substances