. 2022 Jul 15:255:119186.
doi: 10.1016/j.neuroimage.2022.119186. Epub 2022 Apr 7.

Dynamics of absolute and relative disparity processing in human visual cortex

Affiliations

Dynamics of absolute and relative disparity processing in human visual cortex

Milena Kaestner et al. Neuroimage. .

Abstract

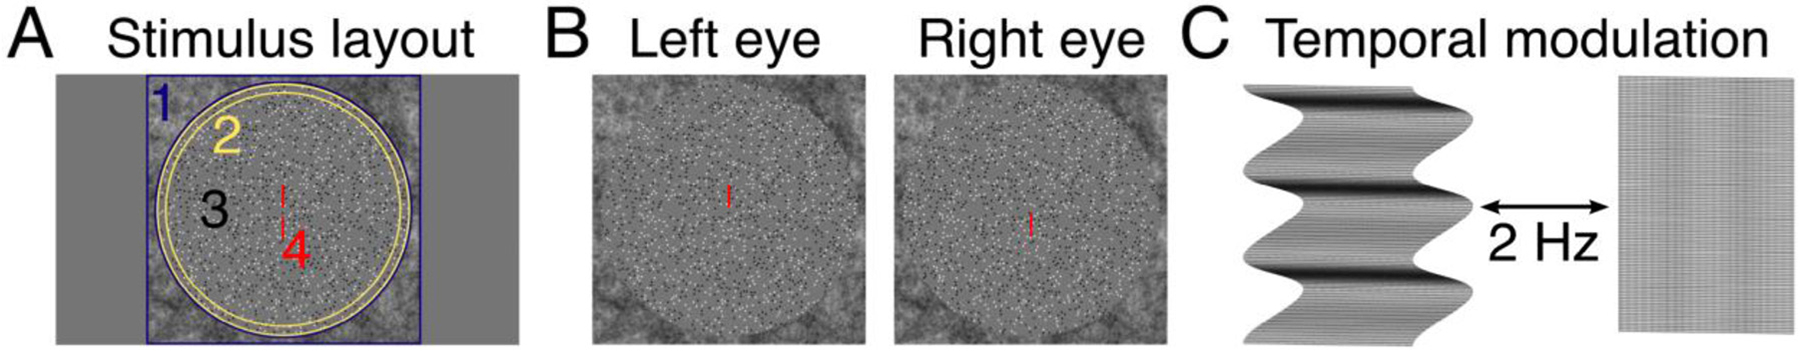
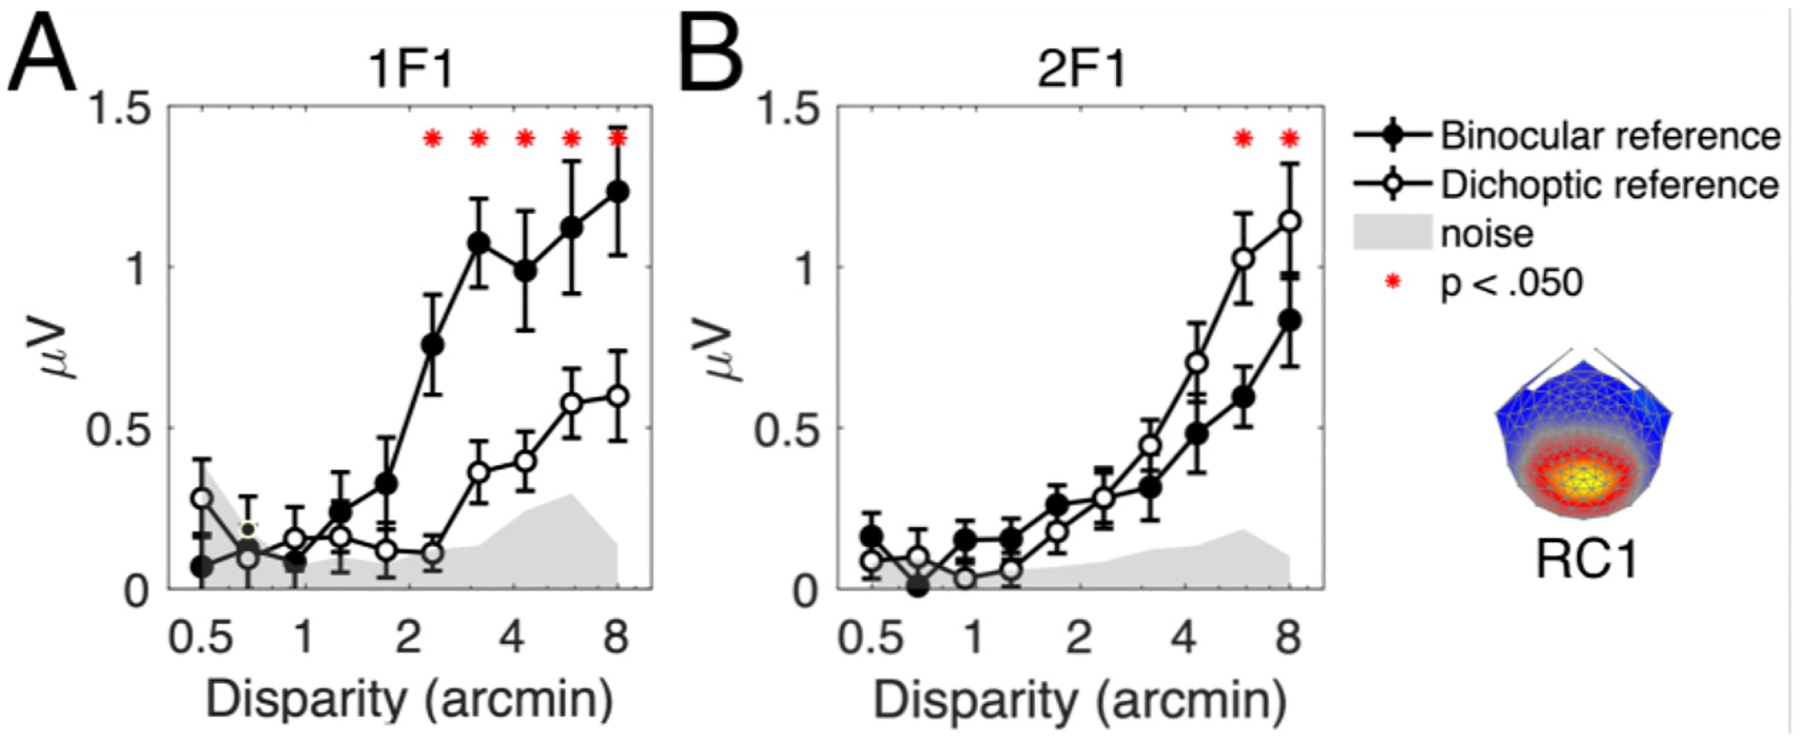
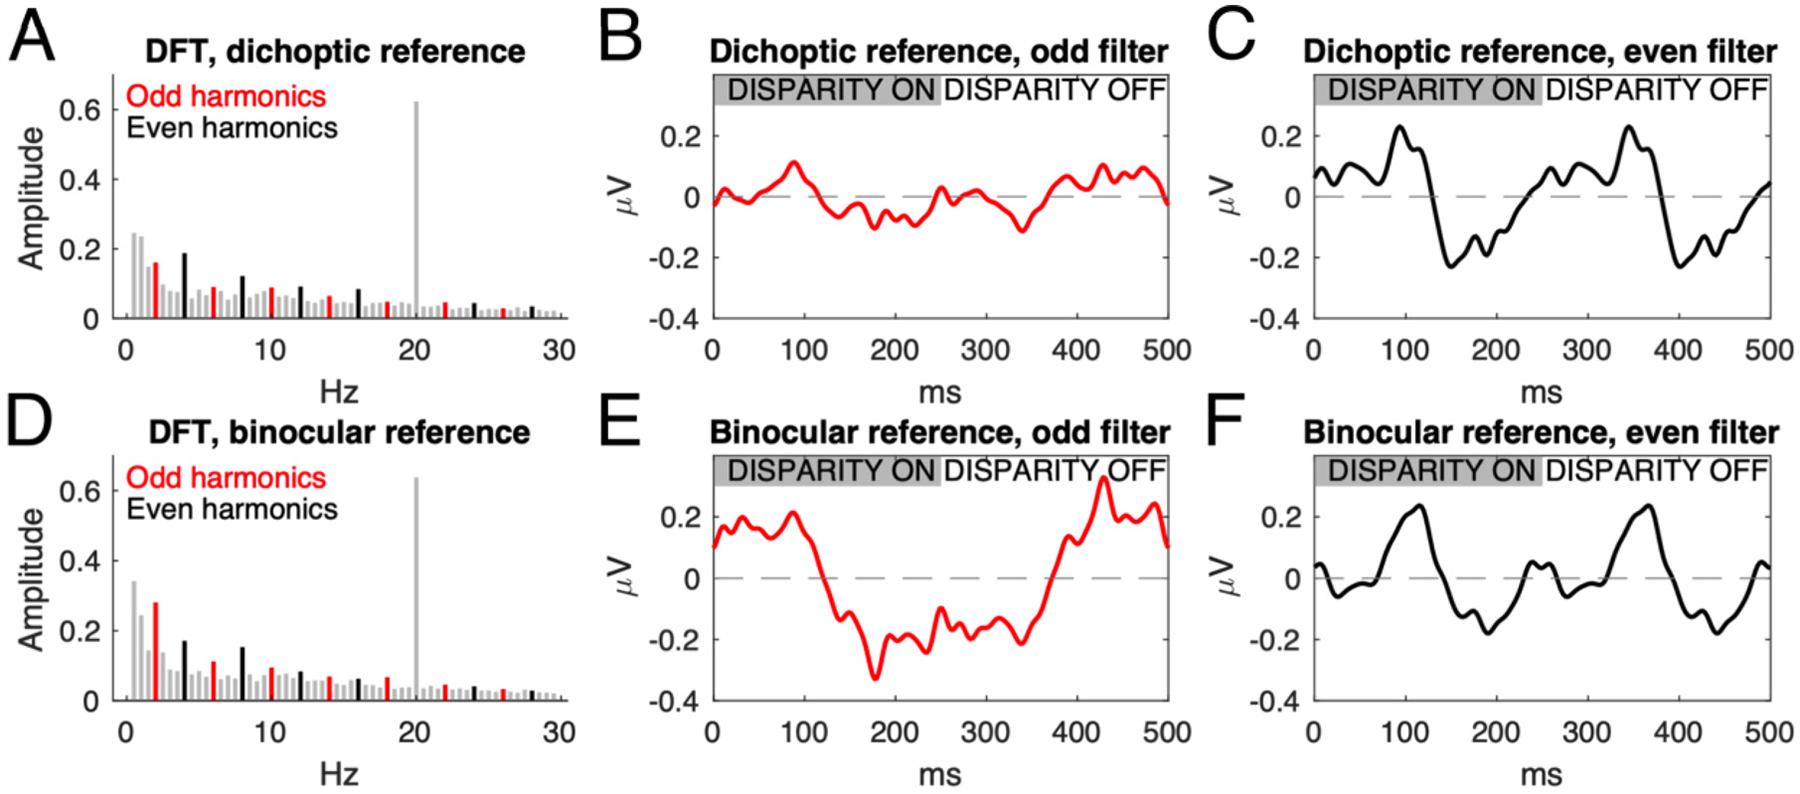
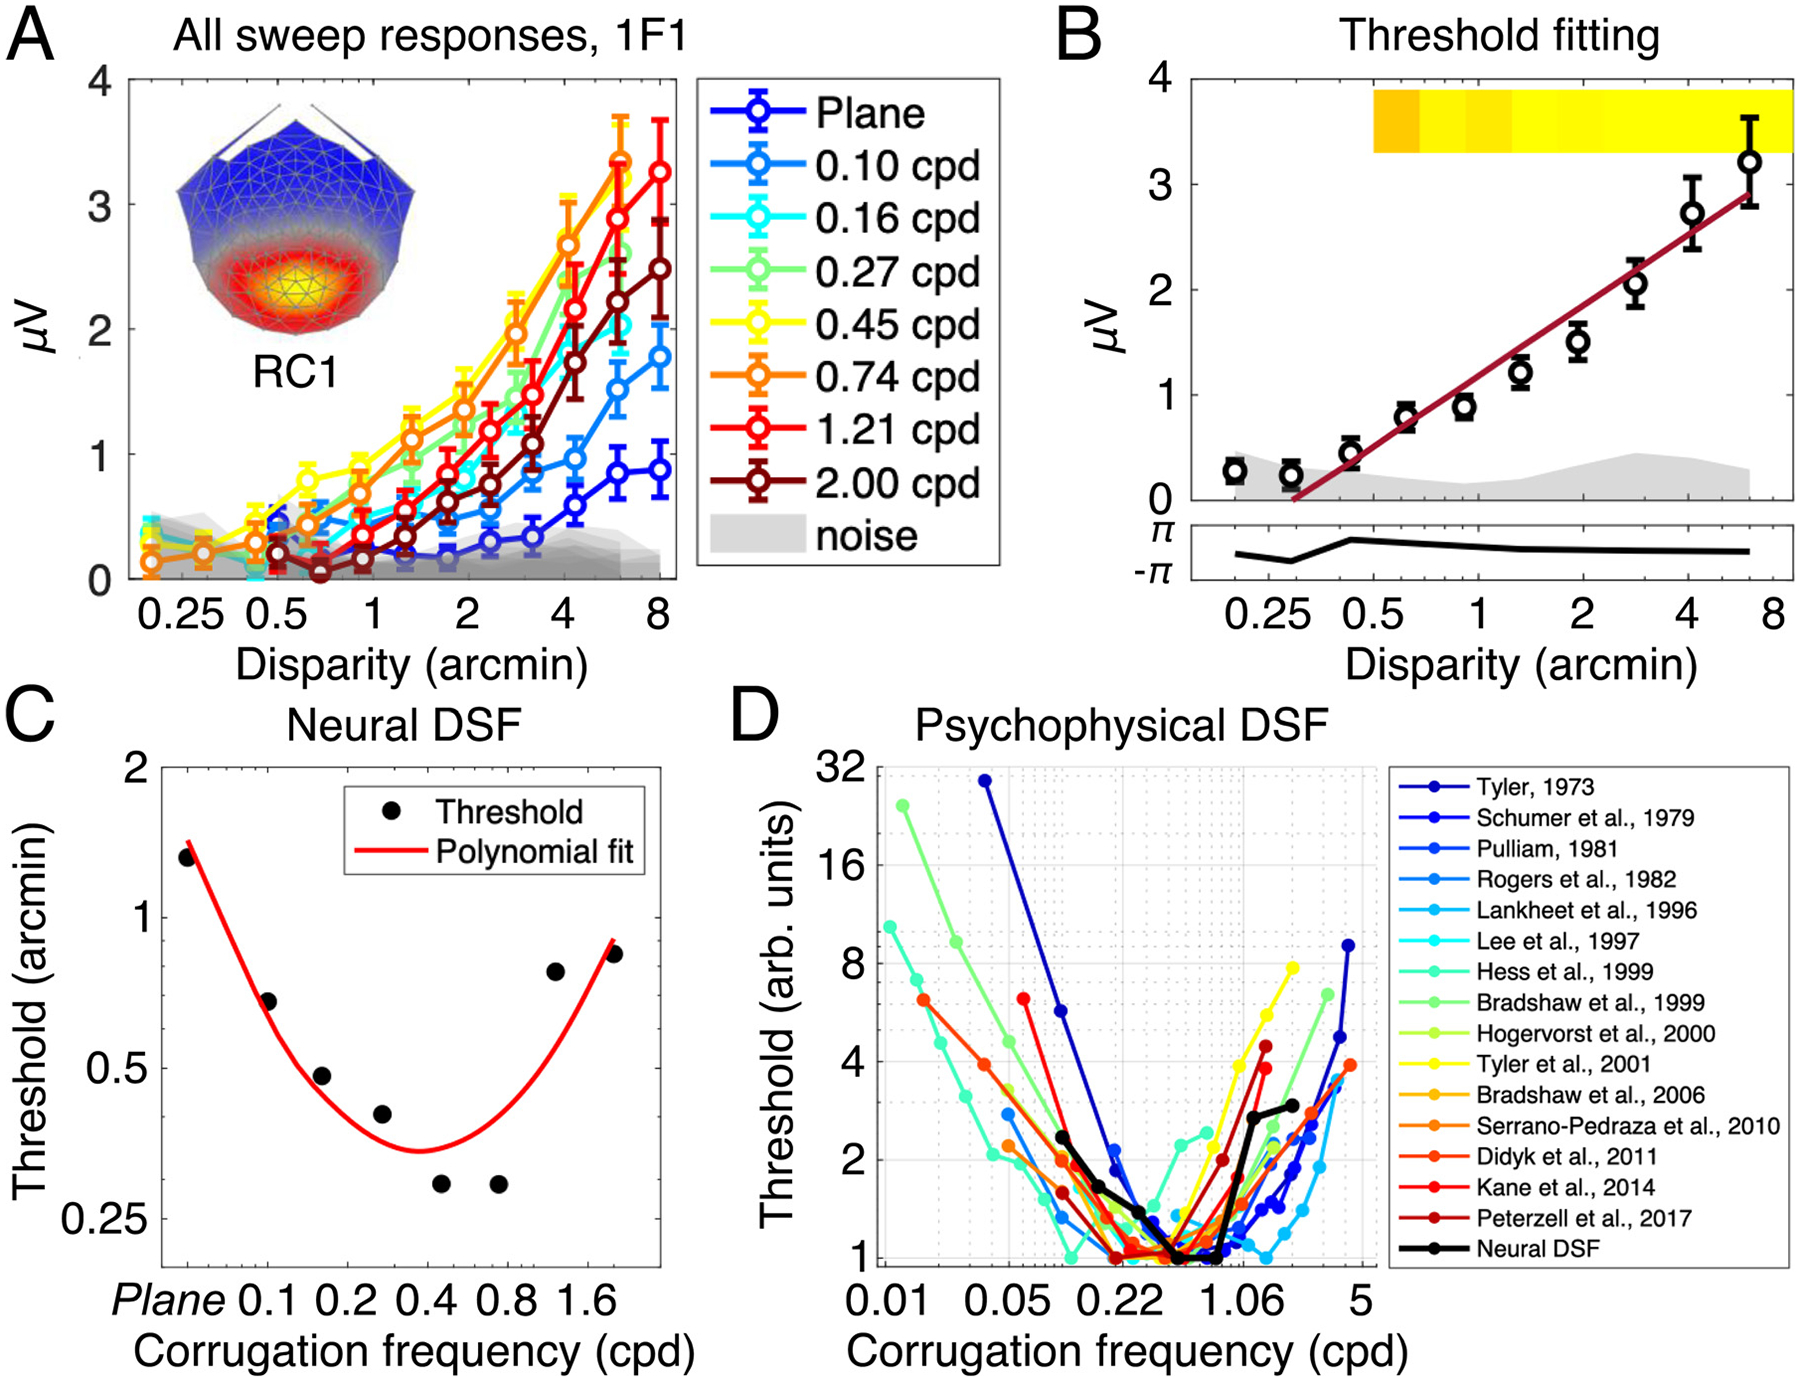
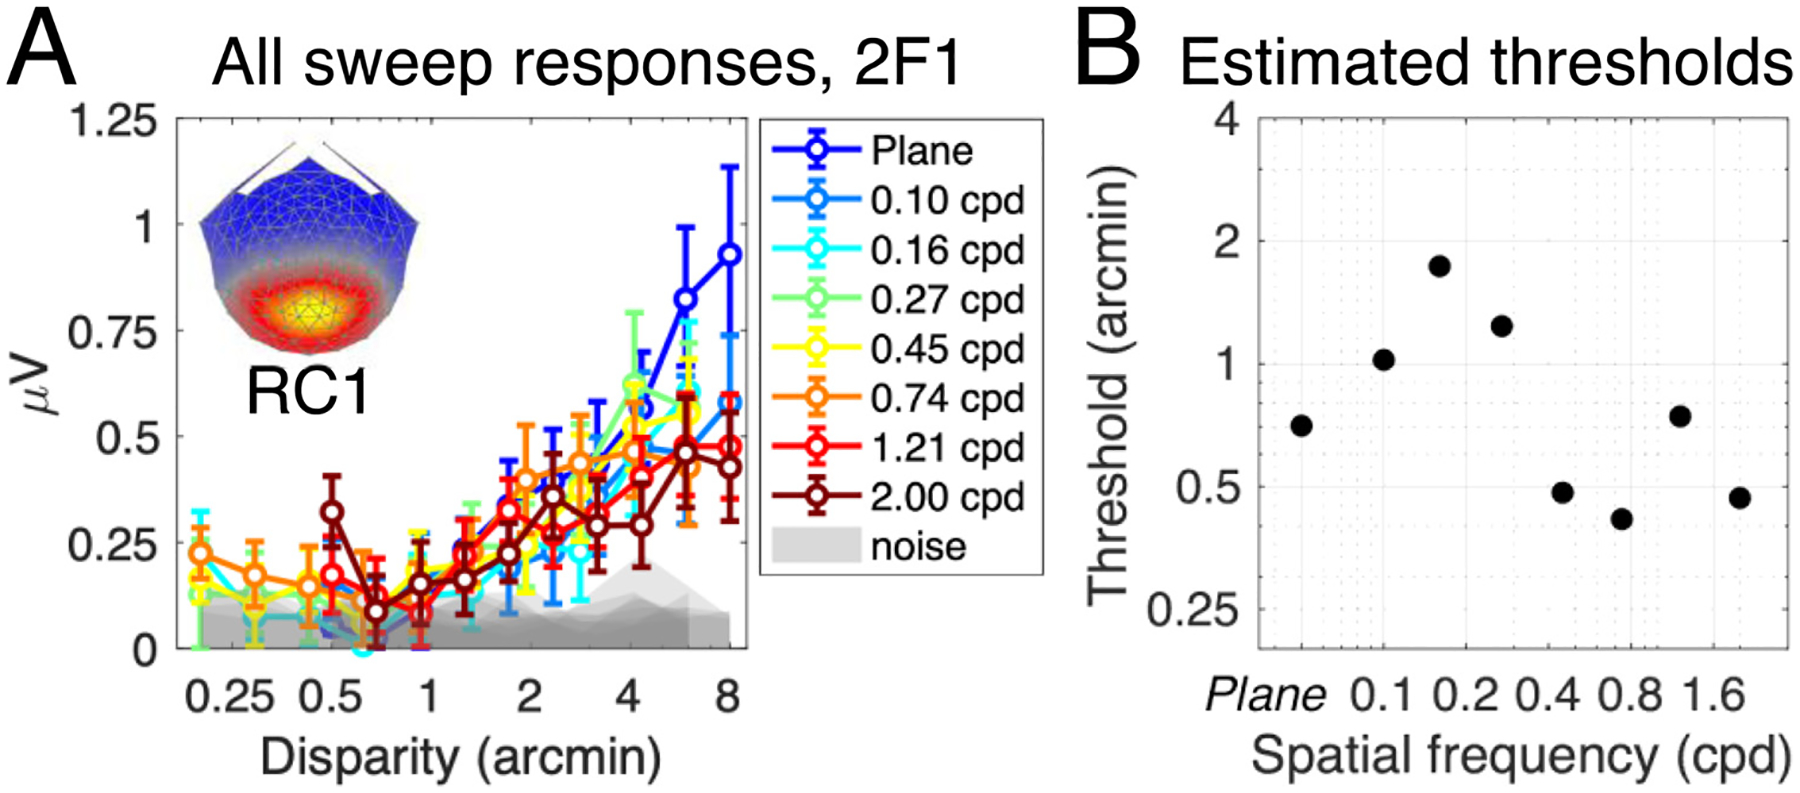
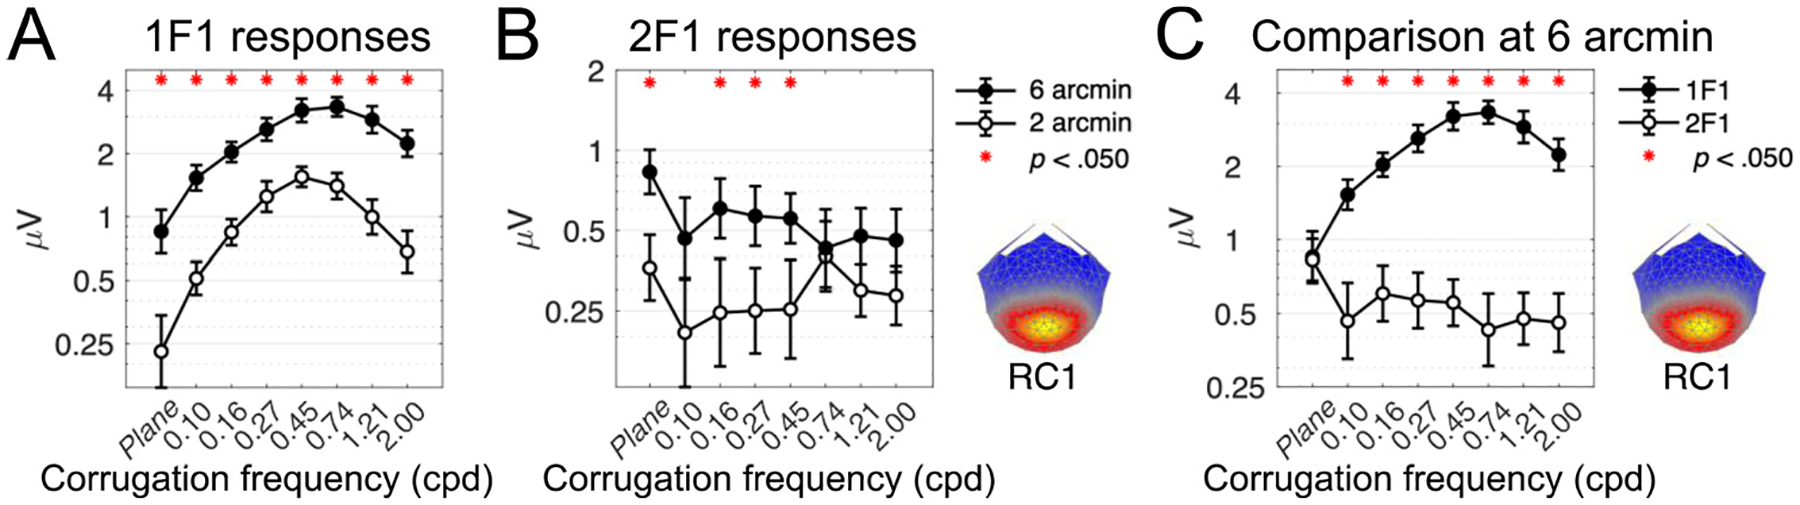
Cortical processing of binocular disparity is believed to begin in V1 where cells are sensitive to absolute disparity, followed by the extraction of relative disparity in higher visual areas. While much is known about the cortical distribution and spatial tuning of disparity-selective neurons, the relationship between their spatial and temporal properties is less well understood. Here, we use steady-state Visual Evoked Potentials and dynamic random dot stereograms to characterize the temporal dynamics of spatial mechanisms in human visual cortex that are primarily sensitive to either absolute or relative disparity. Stereograms alternated between disparate and non-disparate states at 2 Hz. By varying the disparity-defined spatial frequency content of the stereograms from a planar surface to corrugated ones, we biased responses towards absolute vs. relative disparities. Reliable Components Analysis was used to derive two dominant sources from the 128 channel EEG records. The first component (RC1) was maximal over the occipital pole. In RC1, first harmonic responses were sustained, tuned for corrugation frequency, and sensitive to the presence of disparity references, consistent with prior psychophysical sensitivity measurements. By contrast, the second harmonic, associated with transient processing, was not spatially tuned and was indifferent to references, consistent with it being generated by an absolute disparity mechanism. Thus, our results reveal a duplex coding strategy in the disparity domain, where relative disparities are computed via sustained mechanisms and absolute disparities are computed via transient mechanisms.

Keywords: Binocular vision; Disparity; SSVEP; Sustained; Transient.


Figures

Fig. 1.
Fig. 1.
Stimulus details. Panel A shows the general layout common to all stimulus conditions. Stimuli were viewed through a circular aperture embedded within a peripheral 1/f noise fusion lock (1). A ring of decorrelated dots (2) separated the edge of the stimulus. The stimulus was a dynamic random dot stereogram (DRDS, 3) where the corrugation frequency was disparity-defined and followed a sine-wave profile, except in the absolute disparity condition where it was a flat plane. Central nonius lines helped control eye gaze (4). Panel B shows screenshots of the stimulus as viewed by the left and right eyes. Note that in the monocular half-images, the decorrelated dots around the edge are indistinguishable from the DRDS, until they are fused and convey no depth information. Panel B is cross-fusible to reveal a sinusoidal disparity grating. Panel C illustrates the stimulus alternation between a corrugated surface and a flat, zero-disparity plane. The modulation rate was 2 Hz and generated the fundamental frequency in the steady-state visual evoked potential.
Fig. 2.
Fig. 2.
Effect of a central fixation task on the 1F1 and 2F1 response amplitudes. Responses were evoked by a plane stimulus oscillating between zero disparity and crossed disparity. Participants performed an attention task placed on the nonius lines (‘dichoptic reference’, open circles) or a letter change task (‘binocular reference’, filled circles). The introduction of a binocular reference adds a zero-disparity signal to the foveated part of the stimulus. Both 1F1 and 2F1 are sensitive to the change in fixation task, where the 1F1 response is significantly greater when the task is binocular. The 2F1 responses show the opposite trend, where the response is weaker when the task is binocular. The noise floor (light grey) is the mean signal amplitude in the frequency side-bands, at each disparity level, and averaged across both conditions.
Fig. 3.
Fig. 3.
Fourier transform-based filtering approaches reveal the sustained and transient response components of the SSVEP. Participants viewed a disparity plane alternating between crossed disparity (first 150 ms, indicated by grey bar in middle and right columns) and zero disparity. Fixation was encouraged using nonius lines (dichoptic reference, no relative disparity signals) or an X-O task at fixation (binocular reference, inducing relative disparity cues). Filtering on the odd (in red, panels B and E) or even (in black, panels C and F) harmonics reveals sustained (panel E) and transient (panels C and F) response components in the reconstructed waveforms. Gray bars in the discrete Fourier transforms (panels A and D) are frequencies that are nulled by the filtering – the large 20 Hz dot update response has also been removed. The introduction of a binocular reference point at fixation results in a sustained negative-going potential, shifted ~120 ms relative to stimulus onset, that is revealed by the odd filter (panel E), which is absent in the dichoptic reference condition (panel B) where only nonius lines are present. Both conditions have transient response components revealed by the even filter (panels C and F). Data are group-level averages of single-cycle responses across all trials, for a cluster of midline occipital electrodes.
Fig. 4.
Fig. 4.
Results from the 1F1 response in RC1 showing dependence on corrugation frequency. Panel A shows all sweep responses, plotted as the amplitude of the 1F1 response against the peak-to-trough disparity amplitude of the grating. Different colours denote different corrugation frequency conditions, and all error bars are ± 1SEM. The shaded area is the mean noise amplitude in the frequency side bands, for each condition. Weightings for RC1 at each electrode are shown in the topographical map insert. Panel B shows an example of the neural threshold estimation, here, data from the 0.45 cpd condition are shown. A linear trend (in red) is fit against bins that fulfil a set of criteria (see Methods for more details). The intersection of the linear trend with the x-axis is taken as the estimated neural threshold. Thresholds for each condition are plotted in Panel C and demonstrate U-shaped corrugation frequency sensitivity. The corrugation tuning in C is consistent with previous psychophysical measurements of the disparity sensitivity function, shown in Panel D (y-axis is normalised, with the best threshold measured for each study being set to 1. ‘Plane’ condition in Neural DSF data omitted for consistency on the x-axis).
Fig. 5.
Fig. 5.
Results from the 2F1 response to disparity in RC1. Responses to gratings at different corrugation frequencies are plotted in Panel A, where the signal increased in amplitude as the peak-to-trough disparity in the grating increased. Neural thresholds were extracted by fitting a linear function to each curve in A. The value of the x-axis intercept was taken as the threshold, and is plotted in Panel B. Both panels indicate no systematic tuning to corrugation frequency, in contrast to the 1F1 response which was strongly tuned. Note the sensitivity of the 2F1 response to the 0 cpd, plane stimulus, expressed as a large signal amplitude in Panel A (dark blue curve) and a relatively low threshold in Panel B (leftmost point on the plot).
Fig. 6.
Fig. 6.
Suprathreshold response amplitudes for 1F1 and 2F1 in RC1. Panels A and B show tuning functions measured at 2 and 6 arcmin of disparity, for 1F1 and 2F1, respectively. Overlaying the 1F1 and 2F1 responses on the same axes in panel C clearly reveals their differences in tuning, where 1F1 is highly sensitive to the spatial structure of the stimulus. 2F1 is untuned and responses are similar across all corrugation frequencies, except for at 0 cpd (plane stimulus) where the response is higher and matches the 1F1 response. Red asterisks in each panel mark pairwise comparisons at each corrugation frequency where amplitudes are significantly different (Bonferroni corrected for multiple comparisons). Error bars are ± 1 SEM and the y-axes are log-scaled.

References

    1. Abraira VE, Ginty DD, 2013. The sensory neurons of touch. Neuron 79, 618–639. - PMC - PubMed
    1. Andrews TJ, Glennerster A, Parker AJ, 2001. Stereoacuity thresholds in the presenc eof a reference surface. Vis. Res 41, 3051–3061. - PubMed
    1. Anzai A, Chowdhury SA, DeAngelis GC, 2011. Coding of stereoscopic depth information in visual areas V3 and V3A. J. Neurosci 31, 10270–10282. - PMC - PubMed
    1. Banks MS, Gepshtein S, Landy MS, 2004. Why is spatial stereoresolution so low? J. Neurosci 24, 2077–2089. - PMC - PubMed
    1. Beverley KI, Regan D, 1974. Temporal integration of disparity information in stereoscopic perception. Exp. Brain Res 19, 228–232. - PubMed

Publication types