. 2022 Mar 23:10:861829.
doi: 10.3389/fcell.2022.861829. eCollection 2022.

Antihypertensive Therapy by ACEI/ARB Is Associated With Intestinal Flora Alterations and Metabolomic Profiles in Hypertensive Patients

Affiliations

Antihypertensive Therapy by ACEI/ARB Is Associated With Intestinal Flora Alterations and Metabolomic Profiles in Hypertensive Patients

Ying Dong et al. Front Cell Dev Biol. .

Abstract

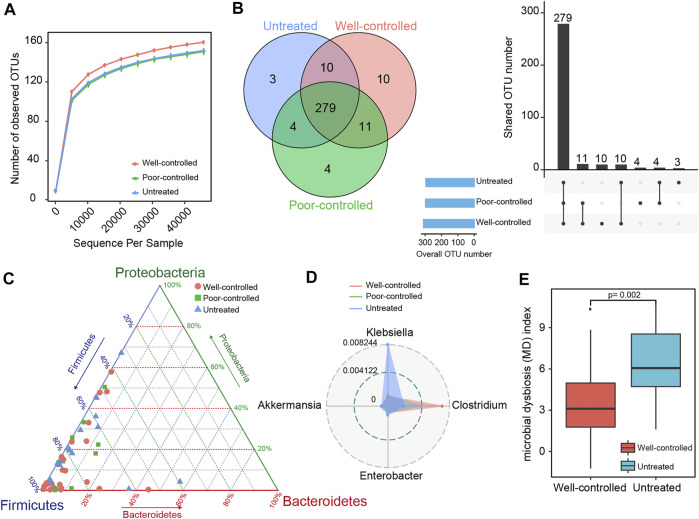
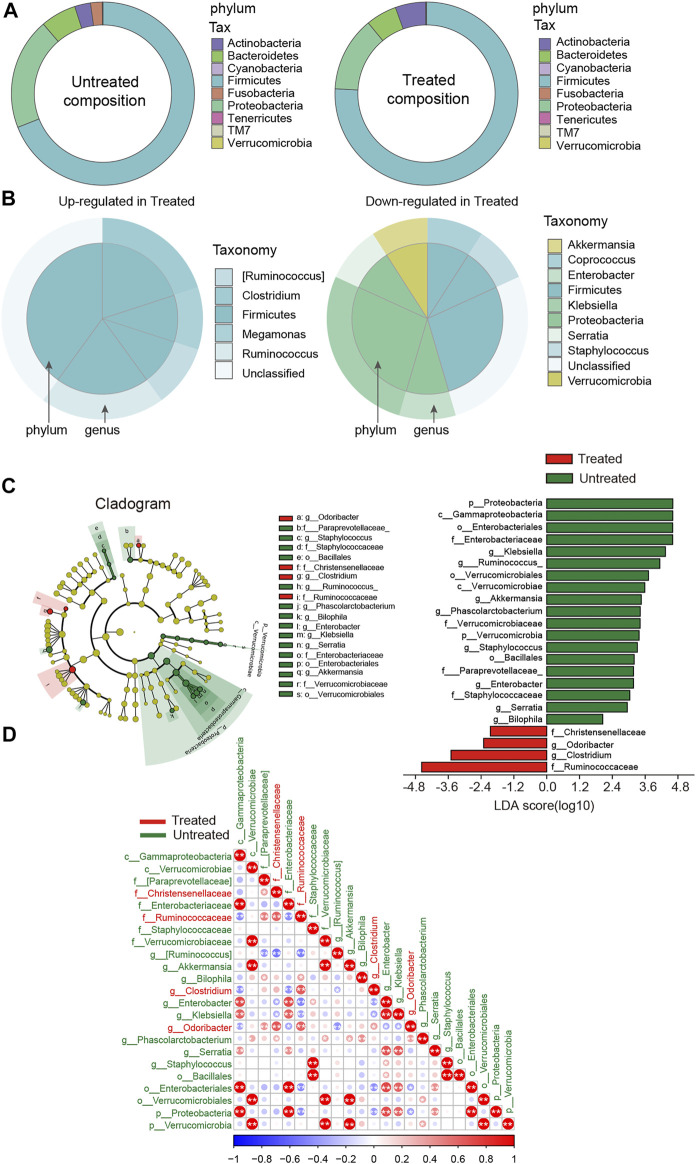
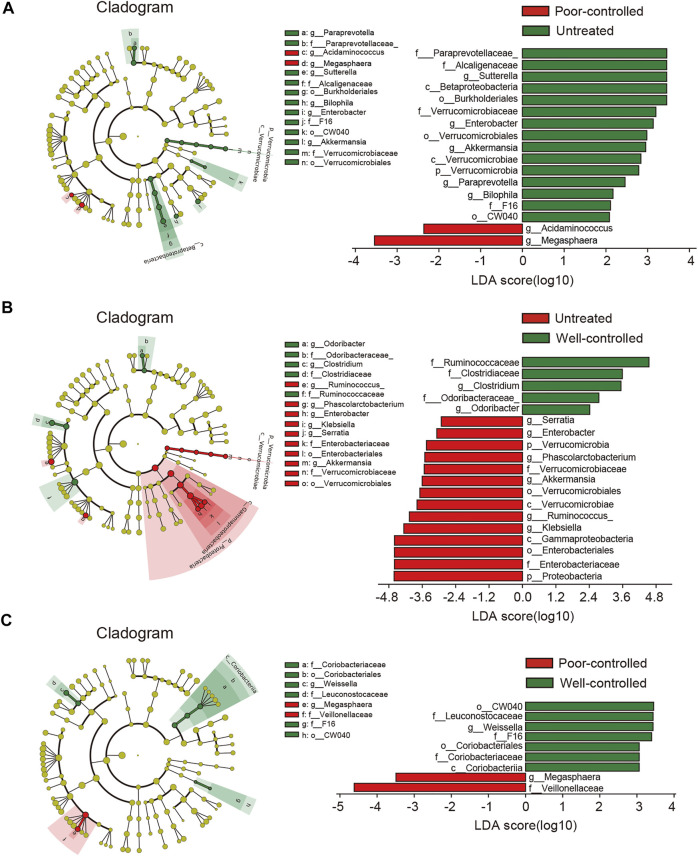
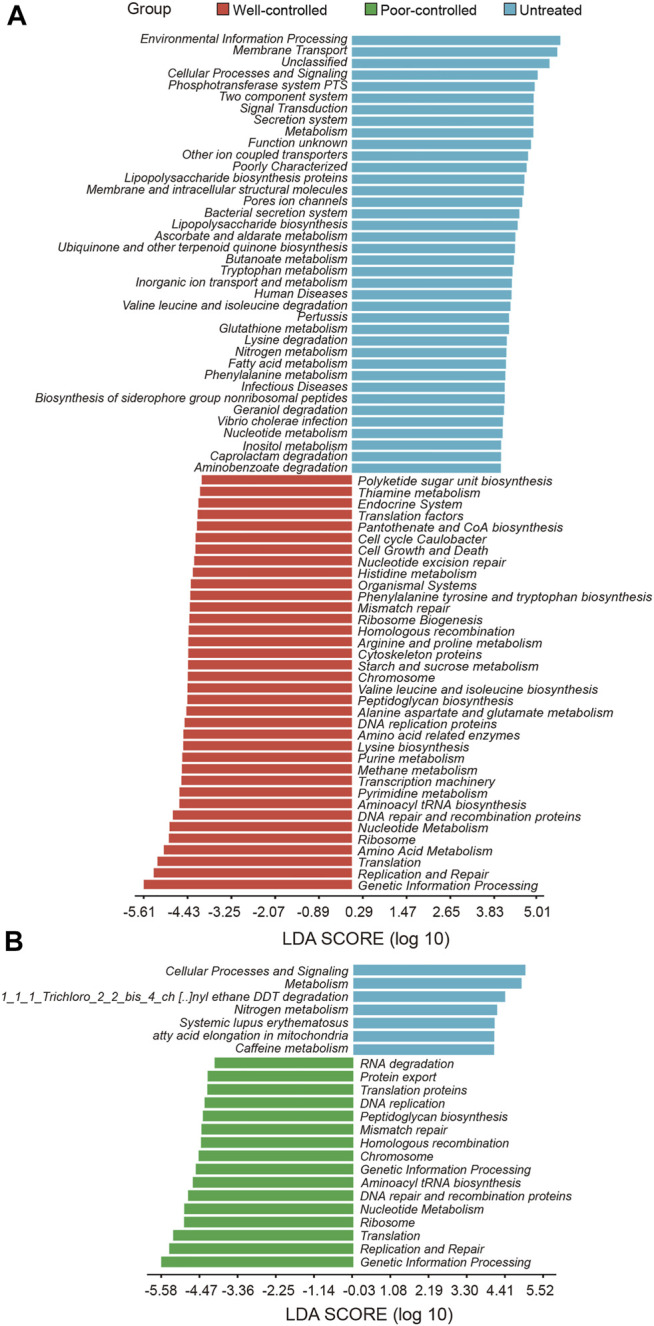
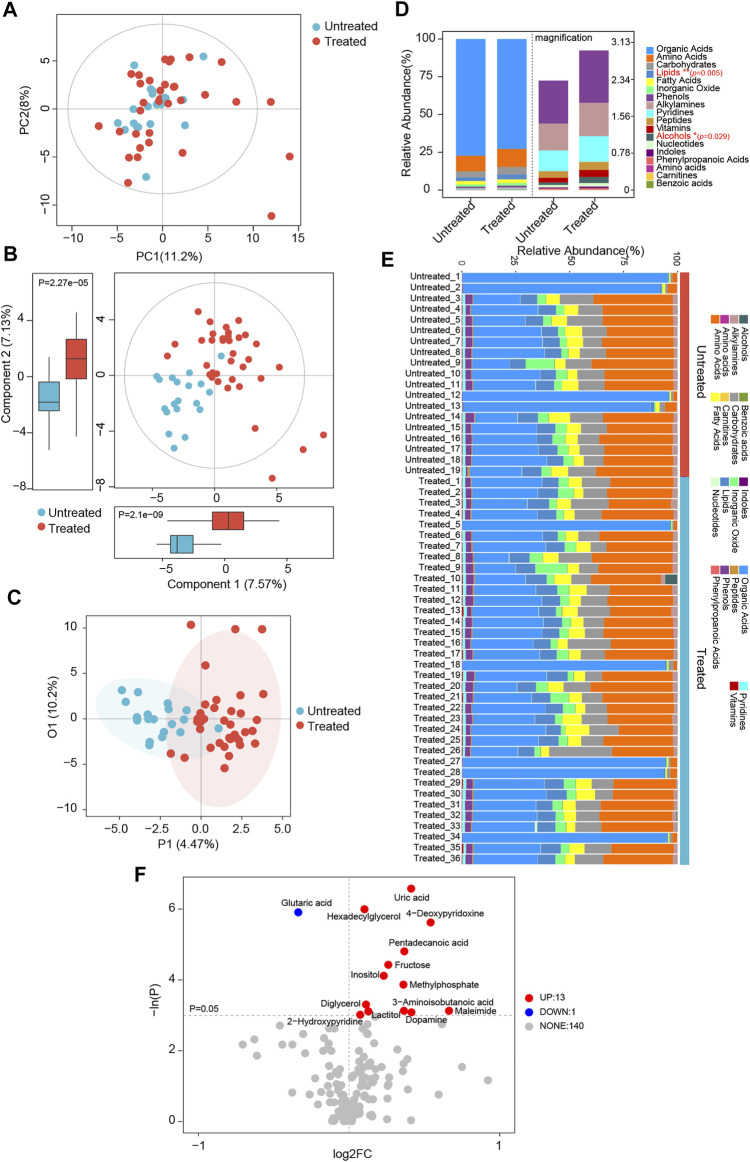
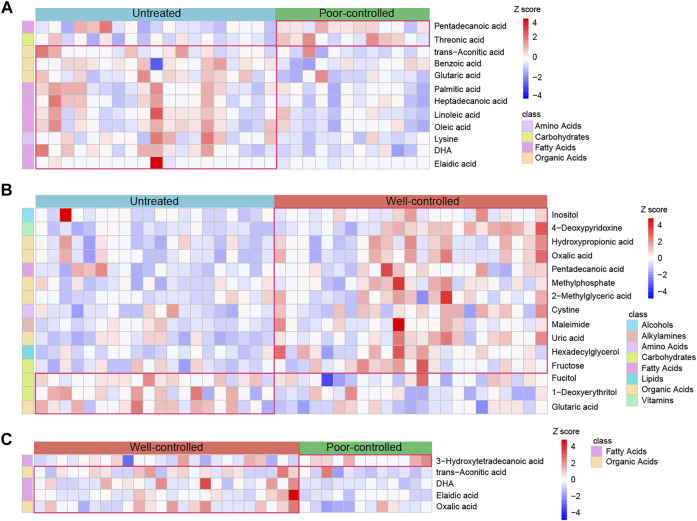
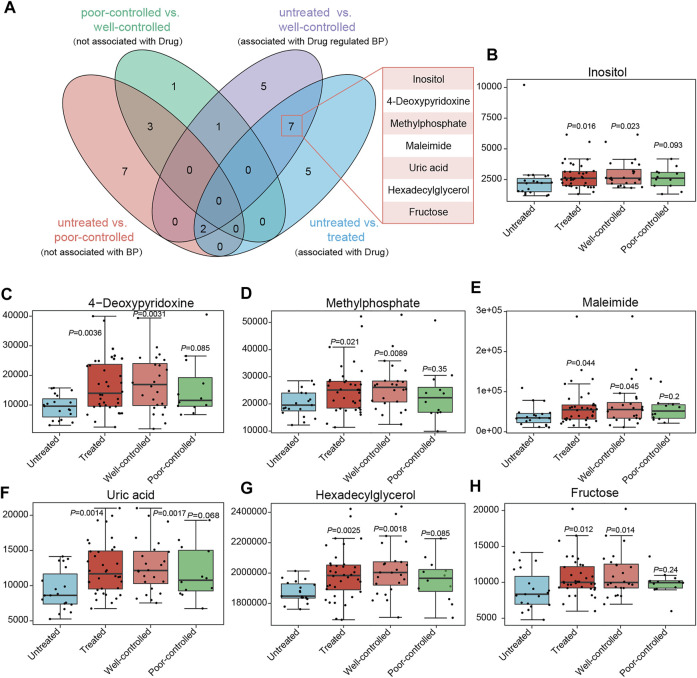
Angiotensin-converting enzyme inhibitors and angiotensin receptor blockers (ACEI/ARB) are the first-line drugs for the treatment of essential hypertension (HTN), one of the most important risk factors for cardiovascular and cerebrovascular diseases. Intestinal flora and microbial metabolites have been demonstrated to play important roles in blood pressure (BP) regulation and HTN development. However, it remains elusive that intestinal bacteria and metabolites are associated with the protective effects of ACEI/ARB anti-hypertensive drugs against HTN. In this study, we evaluated the effect of ACEI/ARB on gut microbiome and metabolites in patients suffering from HTN. We performed 16S rRNA sequencing and fecal metabolomic analysis of 36 HTN patients placed on ACEI/ARB therapy and 19 newly diagnosed HTN patients with no history of anti-hypertensive treatment. Patients under medication treatment were further classified into well-controlled (n = 24) and poor-controlled (n = 12) groups according to their BP levels. The ACEI/ARB improved the intestinal microbiome of the HTN patients by reducing potentially pathogenic bacteria such as Enterobacter and Klebsiella and increasing beneficial bacteria such as Odoribacter. Moreover, ACEI/ARB therapy was correlated with significant metabolomic changes in the HTN patients, including progressively enhanced inositol from poor-controlled to well-controlled groups. The profiles of gut bacteria were linked to the production of metabolites, and inositol was negatively correlated with Klebsiella, Enterobacter, and Proteobacteria. Our study suggests that ACEI/ARB modulates gut microbial composition and functions and alters microbial metabolites in HTN patients.

Keywords: ACEI/ARB; anti-hypertensive; hypertension; intestinal flora; metabolomics.


Conflict of interest statement

The authors declare that the research was conducted in the absence of any commercial or financial relationships that could be construed as a potential conflict of interest.

Figures

FIGURE 1
FIGURE 1
Taxonomic distribution of fecal microbiome in ACEI/ARB well-controlled and poor-controlled HTN subjects. (A) A rarefaction curve in each group was obtained by gradually expanding the sequencing depth of random samples. The curves approached saturation as the sample sequencing depth advanced and indicated that the sequencing data were sufficient and stable. (B) Venn diagrams and an upset view showing the number of OTUs shared or uniquely distributed in the untreated and treated patients (well-controlled or poor-controlled groups). The black bar charts represent the number of OTUs shared in the groups, while those at the bottom left show the number of OTUs in each group. The dotted line at the right bottom indicates the share pattern. A total of 279 OTUs were shared among groups. (C) The distribution of hypertensive subjects in groups is plotted into a ternary diagram based on the relative abundance of the three most dominant taxon at the phylum level: Proteobacteria, Firmicutes, and Bacteroidetes. (D) Radar charts for the distinct taxonomical composition of groups in the top four most abundant genera. The inner blue circle represents a relative abundance at 0.004122 and the outer gray circle represents a relative abundance of 0.008244. The untreated group was more predominant with Klebsiella, while the ACEI/ARB-treated groups were more enriched with Clostridium. (E) Box plots showing the gut MD index in untreated and well-controlled hypertensive patients. The boxes represent the interquartile ranges, the inside line represents the median, and the circles represent outliers. The MD index is significantly depressed in the well-controlled group as compared with the untreated ones; p = 0.002; Wilcoxon rank-sum test.
FIGURE 2
FIGURE 2
Disparity in gut microbial composition in the stool samples between untreated and ACEI/ARB-treated HTN patients. (A) Pie graph showing the bacterial proportion and composition of the overall nine phylum in untreated and treated groups. (B) As compared with the untreated group, the upregulated and downregulated genera and the corresponding phylum in the ACEI/ARB-treated group are shown in a pie chart, respectively. The outer circle represents a genus while the inner circle indicates the phylum it derives from. (C) LEfSe cladogram and LDA score analysis revealed differences in taxonomic composition, and the bacterial taxa significantly enriched the treated (green) and untreated (red) groups. (D) Heat map describing the correlation between different taxonomic compositions. A negative correlation is shown in red and a positive correlation in blue. The bacteria enriched in the treated patients are labeled with red color, while those dominant in the untreated patients are labeled with green. *, p < 0.05; **, p < 0.01, Spearman’s correlation.
FIGURE 3
FIGURE 3
LEfSe analysis revealed differences in the fecal taxonomic composition between the poor-controlled or well-controlled hypertensive patients under ACEI/ARB therapy compared with untreated subjects. (A) Cladogram and LDA score of significantly different taxonomic compositions in poor-controlled (red) HTN patients relative to untreated (green) ones. (B) Significantly altered gut microbiota by ACEI/ARB in BP well-controlled individuals as compared with an untreated group are shown in LEfSe cladogram. Taxon abundant in untreated (red) and well-controlled (green) HTN patients are further presented with LDA scores. (C) Cladogram describing the microbial shifts in taxonomic composition between poor-controlled (red) and well-controlled (green) groups. The significance of different variables is defined by LDA scores (log10) > 2. Variants with p values < 0.1 are shown.
FIGURE 4
FIGURE 4
Potential functions of intestinal microbial metabolites in hypertensive individuals receiving ACEI/ARB or not receiving ACEI/ARB. (A) PICRUSt bar plots showing KEGG pathways significantly shifted in the well-controlled group (red) as compared with untreated patients (blue). Microbial functions targeting inositol metabolism were abundant in untreated patients and decreased in the ACEI/ARB well-control group. (B) Bar plot illustrating the KEGG pathways significantly distinct between untreated (blue) and poor-controlled group (green). The significance of different pathways is presented according to the LDA score. These variables with LDA scores (log10) > 2 are listed.
FIGURE 5
FIGURE 5
Global patterns for the serum metabolome in ACEI/ARB-treated HTN patients. (A) PCA plots depicting the metabolic profiles and features according to untargeted GC-TOF/MS data of serum samples from untreated and treated hypertensive groups. PC1, principal component 1; PC2, principal component 2. (B) Scatter plots of PLS-DA identifying the metabolic discrimination and separation between groups. p = 2.1e−09 and 2.27e−05 between untreated and treated groups were obtained at Component 1 and Component 2, respectively. (C) OPLS-DA with scatter plots shows the metabolic discrimination and separation between groups. (D) Relative abundance and percentage of serum metabolites and class composition detected in untreated and treated HTN patients. *p < 0.05, **p < 0.01. (E) Relative abundance of annotated metabolite class in serum samples of each individual from untreated and treated groups. (F) Volcano plots show significant alterations of serum metabolites between groups. Metabolites at p < 0.05 were considered to be significantly distinct. Up, the number of significantly elevated serum metabolites in the treated group as compared with untreated HTN patients; Down, the number of dramatically decreased metabolites in treated group; None, the number of metabolites not significantly altered between groups. Each metabolite is labeled with the corresponding annotation.
FIGURE 6
FIGURE 6
Abundance of the serum metabolites in untreated, ACEI/ARB well-controlled, and ACEI/ARB poor-controlled groups. (A) Heat map for the relative abundance of strikingly decreased and significantly enriched serum metabolites in poor-controlled patients when compared with untreated ones. The metabolites shown are statistically significant in the calculation, and the relative abundance is shown in each sample. (B) Heat map illustrating the relative abundance of shifted serum metabolites between untreated and ACEI/ARB well-controlled groups. (C) Heat map demonstrating the relative abundance of statistically shifted distinct serum metabolites between the poor-controlled and well-controlled groups. The abundance profiles are transformed into Z-scores by subtracting the average abundance and dividing the standard deviation of all the samples. Z-score is negative and shown in blue when the abundance is lower than the mean and is positive and shown in red when the relative abundance is higher than the mean.
FIGURE 7
FIGURE 7
Core metabolites significantly altered between groups, possessing potential association with medical treatment or BP regulation. (A) Venn diagrams indicate the metabolites in different groups. The variables different between the untreated and poor-controlled groups are considered as not associated with BP attenuation; those between the poor-controlled and well-controlled groups are not attributed to ACEI/ARB treatment; variables derived from untreated vs. treated might be linked to drug therapy; when comparing the untreated and well-controlled groups, it is intended to obtain serum metabolites related to BP regulation by ACEI/ARB administration. Potential metabolites important for ACEI/ARB in lowering BP are concentrated in 7. (B–H) Relative abundance of inositol, 4-deoxypyridoxine, methylphosphate, maleimide, uric acid, hexadecylglycerol, and fructose in ACEI/ARB-treated HTN patients either well-controlled or poor-controlled.

Similar articles

Cited by

References

    1. Bäckhed F., Roswall J., Peng Y., Feng Q., Jia H., Kovatcheva-Datchary P., et al. (2015). Dynamics and Stabilization of the Human Gut Microbiome during the First Year of Life. Cell Host & Microbe 17, 690–703. 10.1016/j.chom.2015.04.004 - DOI - PubMed
    1. Balaich J., Estrella M., Wu G., Jeffrey P. D., Biswas A., Zhao L., et al. (2021). The Human Microbiome Encodes Resistance to the Antidiabetic Drug Acarbose. Nature 600, 110–115. 10.1038/s41586-021-04091-0 - DOI - PMC - PubMed
    1. Buckley C., Wilson C., Mccarron J. G. (2020). FK506 regulates Ca(2+) release evoked by inositol 1,4,5-trisphosphate independently of FK-binding protein in endothelial cells. Br. J. Pharmacol. 177, 1131–1149. 10.1111/bph.14905 - DOI - PMC - PubMed
    1. Chang Y., Chen Y., Zhou Q., Wang C., Chen L., Di W., et al. (2020). Short-chain Fatty Acids Accompanying Changes in the Gut Microbiome Contribute to the Development of Hypertension in Patients with Preeclampsia. Clin. Sci. (Lond) 134, 289–302. 10.1042/CS20191253 - DOI - PubMed
    1. Cheung K. S., Chan E. W., Seto W. K., Wong I. C. K., Leung W. K. (2020). ACE (Angiotensin-Converting Enzyme) Inhibitors/Angiotensin Receptor Blockers Are Associated with Lower Colorectal Cancer Risk. Hypertension 76, 968–975. 10.1161/hypertensionaha.120.15317 - DOI - PubMed

LinkOut - more resources