. 2022 Mar 23:10:750829.
doi: 10.3389/fcell.2022.750829. eCollection 2022.

C9orf72-Derived Proline:Arginine Poly-Dipeptides Modulate Cytoskeleton and Mechanical Stress Response

Affiliations

C9orf72-Derived Proline:Arginine Poly-Dipeptides Modulate Cytoskeleton and Mechanical Stress Response

Tomo Shiota et al. Front Cell Dev Biol. .

Abstract

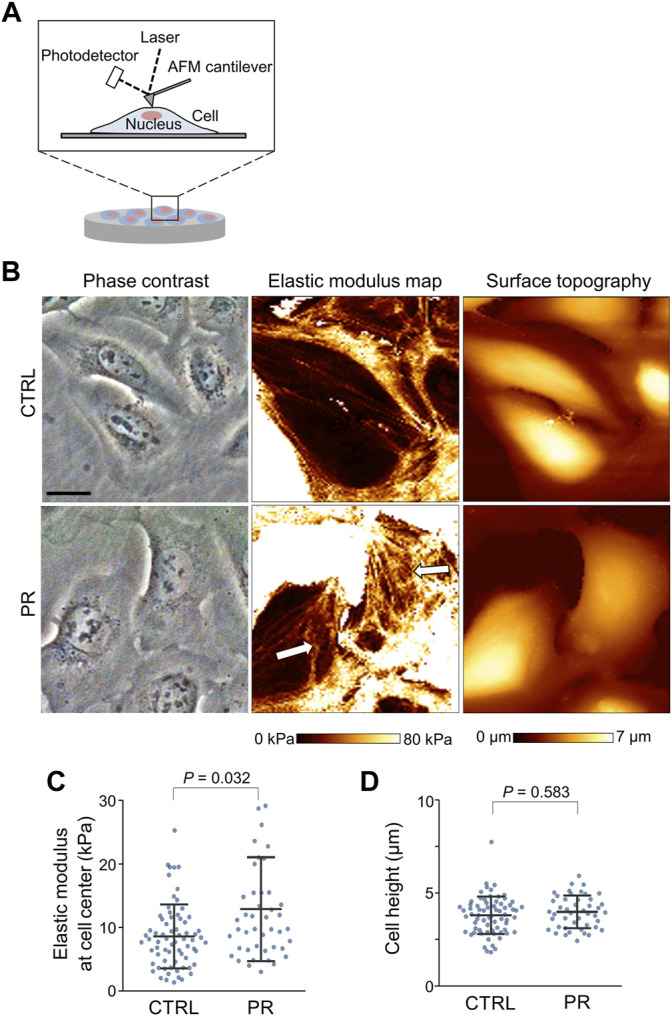
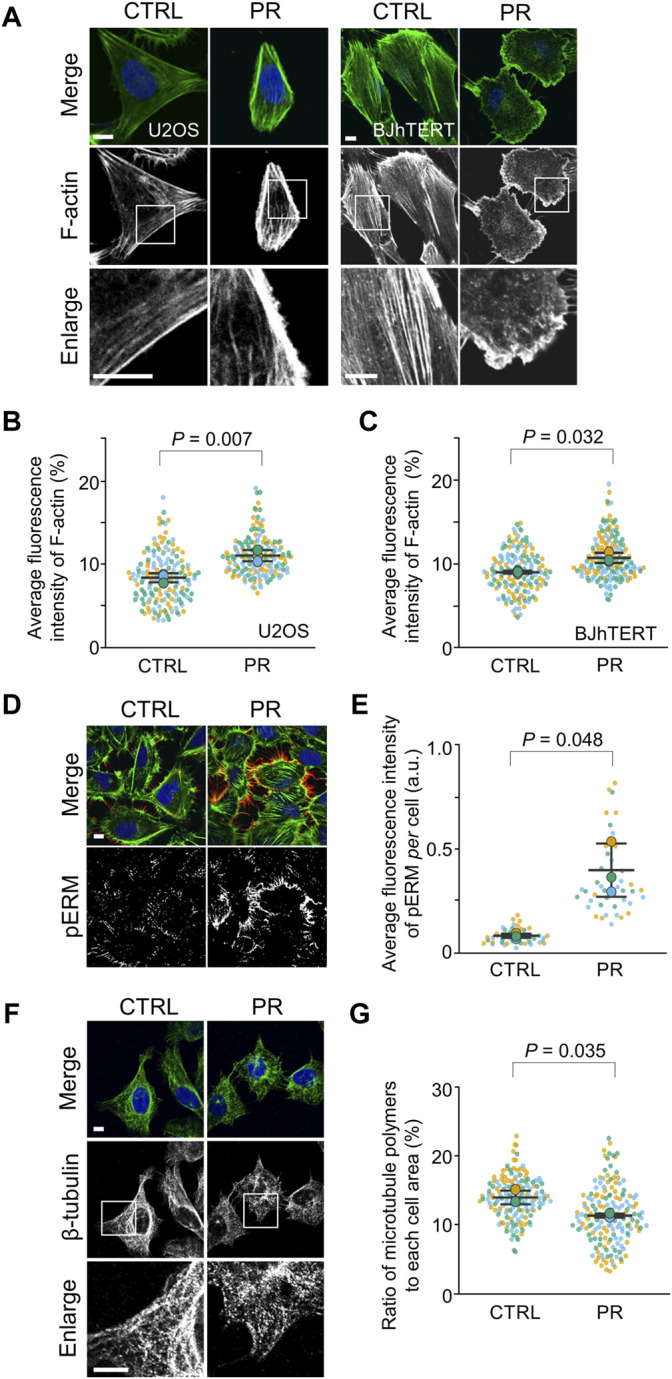
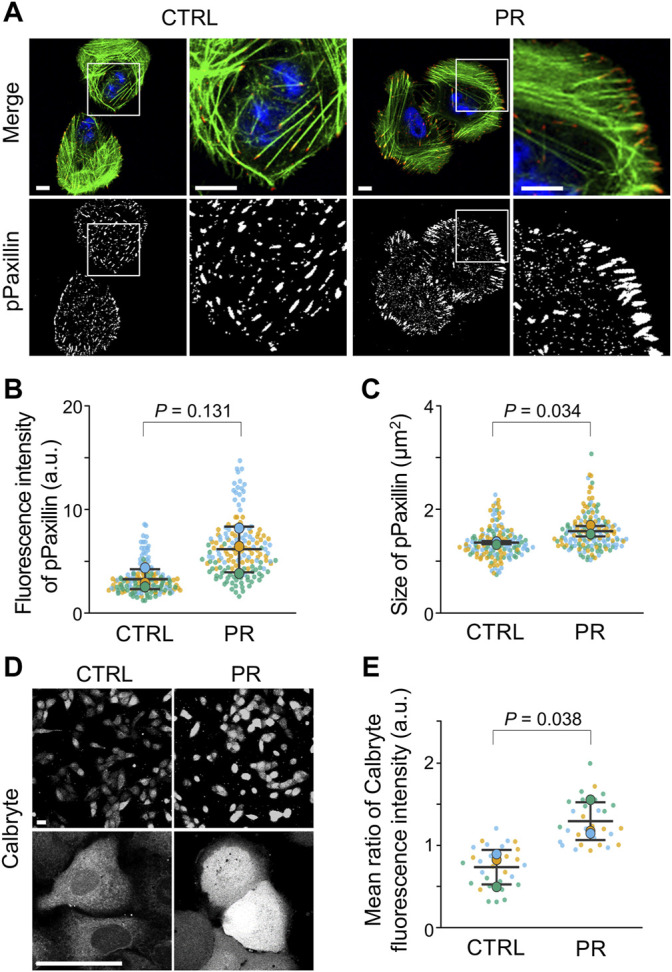
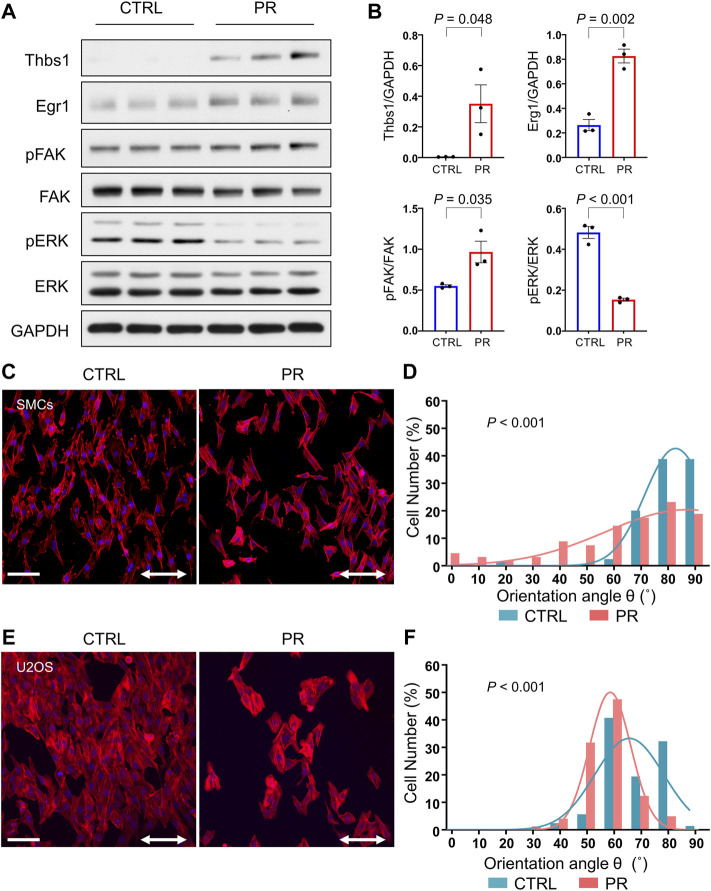
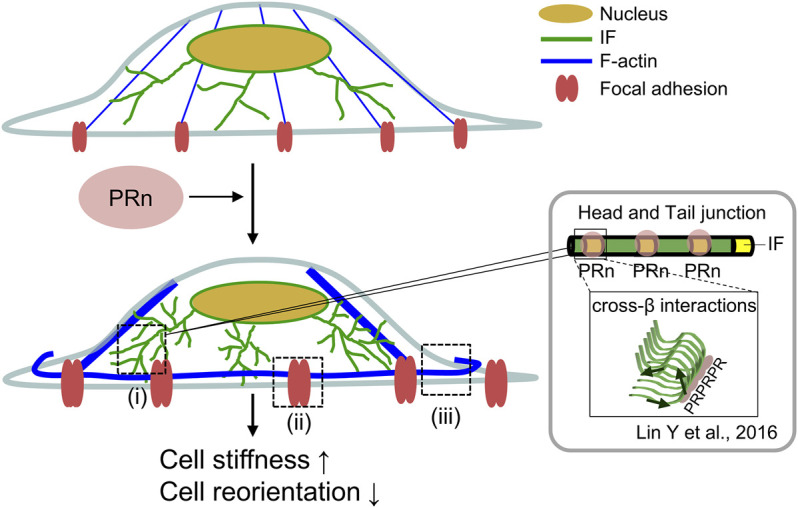
Proline:arginine (PR) poly-dipeptides from the GGGGCC repeat expansion in C9orf72 have cytotoxicity and bind intermediate filaments (IFs). However, it remains unknown how PR poly-dipeptides affect cytoskeletal organization and focal adhesion (FA) formation. Here, we show that changes to the cytoskeleton and FA by PR poly-dipeptides result in the alteration of cell stiffness and mechanical stress response. PR poly-dipeptides increased the junctions and branches of the IF network and increased cell stiffness. They also changed the distribution of actin filaments and increased the size of FA and intracellular calcium concentration. PR poly-dipeptides or an inhibitor of IF organization prevented cell detachment. Furthermore, PR poly-dipeptides induced upregulation of mechanical stress response factors and led to a maladaptive response to cyclic stretch. These results suggest that the effects of PR poly-dipeptides on mechanical properties and mechanical stress response may serve as a pathogenesis of C9orf72-related neurodegeneration.

Keywords: C9orf72; Focal Adhesion (FA); PR poly-dipeptides; actin; cytoskeleton.


Conflict of interest statement

The authors declare that the research was conducted in the absence of any commercial or financial relationships that could be construed as a potential conflict of interest.

Figures

FIGURE 1
FIGURE 1
PR poly-dipeptides (PR20) change the organization of intermediate filaments (IF) of U2OS cells. (A) Fluorescent images of Vim-IFs in untreated control (CTRL) and PR20-treated (PR) cells. Vim-IFs (green) and DAPI (blue) are shown. Scale bars are 10 µm. (B,C) Quantification of Vim-IF junctions (in B) and branches (in C) per 100 μm2 in the cytoplasm in CTRL and PR cells. Bars are means ± SD. In each experiment, 50 to 60 cells were evaluated (n = 3). P value shows Welch’s t-test. (D) Fluorescent images of cytokeratin14 (K14) in CTRL and PR cells. K14 (green) and DAPI (blue) are shown. Scale bars are 10 µm. (E,F) Quantification of Keratin-IF junctions (in E) and branches (in F) per 100 μm2 in the cytoplasm in CTRL and PR cells. Bars are means ± SD. In each experiment, 50 to 58 cells were evaluated (n = 3). p value shows Welch’s t-test. In quantification graphs, small dots are individual datapoints, and large dots indicate the averages of each experiment in orange (first; n = 1), blue (second; n = 2) and green (third; n = 3), respectively.
FIGURE 2
FIGURE 2
Atomic force microscopy (AFM) images of the surface of U2OS cells. (A) Schematic view of AFM measurement of cell surface, including cell stiffness and cell height. (B) Representative images of phase contrast images (left), elastic modulus maps (middle), and surface topographic images (right) of U2OS cells measured by AFM. Arrows in the middle image show thick- and short-stress fibers in PR20-treated (PR) cells. Scale bars are 20 µm. (C,D) Quantification graph shows elastic modulus at cell central region (in C) and cell height (in D) in CTRL and PR cells. Bars are means ± SD. 45 to 69. Cells were evaluated per condition. P value shows Mann–Whitney U test.
FIGURE 3
FIGURE 3
PR20 changes the organization of F-actin and β-tubulin and promotes the phosphorylation of ERM (pERM). (A) Fluorescent images of phalloidin in U2OS and BJhTERT cells after treatment with 10 µM of PR20 or CTRL. phalloidin (green) and DAPI (blue) are shown. Scale bars are 10 µm. (B,C) Quantification of average fluorescence intensity of F-actin in U2OS cells (in B) and BJhTERT cells (in C). Bars are means ± SD. In each experiment, 50 to 55 cells were evaluated (n = 3). p value shows Welch’s t-test. (D) Fluorescent images of pERM (red), phalloidin (green) and DAPI (blue) after treatment with or without 10 µM of PR20 in U2OS cells. A bar is 10 µm. (E) Average fluorescence intensity of pERM per cell after treatment with 10 µM of PR20 or CTRL. Bars are means ± SD. 15 regions were evaluated (n = 3). p value shows Welch’s t-test. (F) Fluorescent images of β-tubulin in U2OS cells after treatment with 10 µM of PR20 or CTRL. Bars are 10 µm. (G) The ratio of microtubule polymers in CTRL and PR20-treated (PR) cells. Bars are means ± SD. In each experiment, 50 to 57 cells were evaluated (n = 3). p value shows Welch’s t-test. In quantification graphs, small dots are individual datapoints, and large dots indicate the averages of each experiment in orange (first; n = 1), blue (second; n = 2) and green (third; n = 3), respectively.
FIGURE 4
FIGURE 4
PR20 increases the size of FA and intracellular calcium concentration. (A) Fluorescent images of pPaxillin (red), phalloidin (green) and DAPI (blue) are shown. Scale bars are 10 µm. (B,C) Average fluorescence intensity of pPaxillin (in B) and size of pPaxillin (in C). Bars are means ± SD. In each experiment, 41 to 57 cells were evaluated (n = 3). p value shows Welch’s t-test. (D,E) Fluorescence images of Calbryte590™ in CTRL and PR20-treated (PR) cells. Scale bars are 50 µm. Quantification shows in E. Bars are means ± SD. In each experiment, 10 cells were evaluated (n = 3). p value shows Welch’s t-test. In quantification graphs, small dots are individual datapoints, and large dots indicate the averages of each experiment by orange (first; n = 1), blue (second; n = 2), and green (third; n = 3), respectively.
FIGURE 5
FIGURE 5
PR20 inhibits cell detachment by EDTA. (A) Representative LifeAct-GFP images of U2OS cells in CTRL and PR20-treated (PR) and the cytoskeletal inhibitors, Withaferin-A, Blebbistatin and Nocodazole treatment, following detachment by 5 µM EDTA. A bar is 50 µm. (B) A histogram of the cell circularity of U2OS cells after detachment by 5 µM EDTA in CTRL (n = 179, blue), PR20 (n = 158, red), Withaferin-A (n = 243, green), Blebbistatin (n = 316, orange), and Nocodazole (n = 242, gray). A circularity of 1.0 indicates a complete circle. As it approaches 0.0, it indicates an elongated polygon. p value shows Welch’s t-test.
FIGURE 6
FIGURE 6
PR20 prohibits the cyclic stretch-induced reorientation of F-actin stress fibers. (A) Western blotting shows Thbs1, Egr1, pFAK, FAK, pERK and ERK levels in CTRL and PR20-treated (PR) cells (n = 3). GAPDH was used as a loading control. (B) Quantification graphs are shown. Bars are means ± SEM. p value shows unpaired t-test. (C,E) Rat vascular SMCs (in C) and U2OS cells (in E) with or without 10 µM of PR20 were subjected to cyclic stretch (20% strain, 1.0 Hz (60 cycles/min) for 6 hours. Phalloidin (red) and DAPI (blue) are shown. Scale bars are 100 µm. The two-way arrows indicate stretch direction. (D,F) Histograms of the percentage of the orientation angle (θ) for each cell in rat vascular SMCs (in D) and U2OS cells (in F). The orientation of each cell was analyzed by measuring the orientation angle (θ) of the long axis of the ellipse relative to the stretch axis in CTRL (blue) and PR cells (red). 70 to 104 cells were evaluated in each condition. p value shows Mann–Whitney U test.
FIGURE 7
FIGURE 7
Graphical abstract. PR poly-dipeptides bind to IF head domain and induced the alterations of cellular mechanics. PR poly-dipeptides (pink) bind to the IF head domain (yellow) and dysregulate the IF dynamics. This results in an increase of IF branches and IF mesh network (green) (ⅰ). The IF network increases the size of FA (red) (ⅱ) and thickness of F-actin stress fibers (blue) (ⅲ), leading to cell stiffness. Further, the alterations of cytoskeleton and FA disrupt cell reorientation after cyclic stretch. IF: intermediate filament, PRn: PR poly-dipeptides.

Similar articles

Cited by

References

    1. Abercrombie M., Dunn G. A. (1975). Adhesions of Fibroblasts to Substratum during Contact Inhibition Observed by Interference Reflection Microscopy. Exp. Cel Res. 92 (1), 57–62. 10.1016/0014-4827(75)90636-9 - DOI - PubMed
    1. Ash P. E. A., Bieniek K. F., Gendron T. F., Caulfield T., Lin W.-L., Dejesus-Hernandez M., et al. (2013). Unconventional Translation of C9ORF72 GGGGCC Expansion Generates Insoluble Polypeptides Specific to c9FTD/ALS. Neuron 77 (4), 639–646. 10.1016/j.neuron.2013.02.004 - DOI - PMC - PubMed
    1. Bamburg J. R., Bloom G. S. (2009). Cytoskeletal Pathologies of Alzheimer Disease. Cell Motil. Cytoskeleton 66 (8), 635–649. 10.1002/cm.20388 - DOI - PMC - PubMed
    1. Baniukiewicz P., Collier S., Bretschneider T. (2018). QuimP: Analyzing Transmembrane Signalling in Highly Deformable Cells. Bioinformatics 34 (15), 2695–2697. 10.1093/bioinformatics/bty169 - DOI - PMC - PubMed
    1. Bargagna-Mohan P., Hamza A., Kim Y.-e., Khuan Ho Y., Mor-Vaknin N., Wendschlag N., et al. (2007). The Tumor Inhibitor and Antiangiogenic Agent Withaferin A Targets the Intermediate Filament Protein Vimentin. Chem. Biol. 14 (6), 623–634. 10.1016/j.chembiol.2007.04.010 - DOI - PMC - PubMed