

Er-Chen Decoction Alleviates High-Fat Diet-Induced Nonalcoholic Fatty Liver Disease in Rats through Remodeling Gut Microbiota and Regulating the Serum Metabolism
- PMID: 35399623
- PMCID: PMC8991405
- DOI: 10.1155/2022/6221340
Er-Chen Decoction Alleviates High-Fat Diet-Induced Nonalcoholic Fatty Liver Disease in Rats through Remodeling Gut Microbiota and Regulating the Serum Metabolism
Abstract
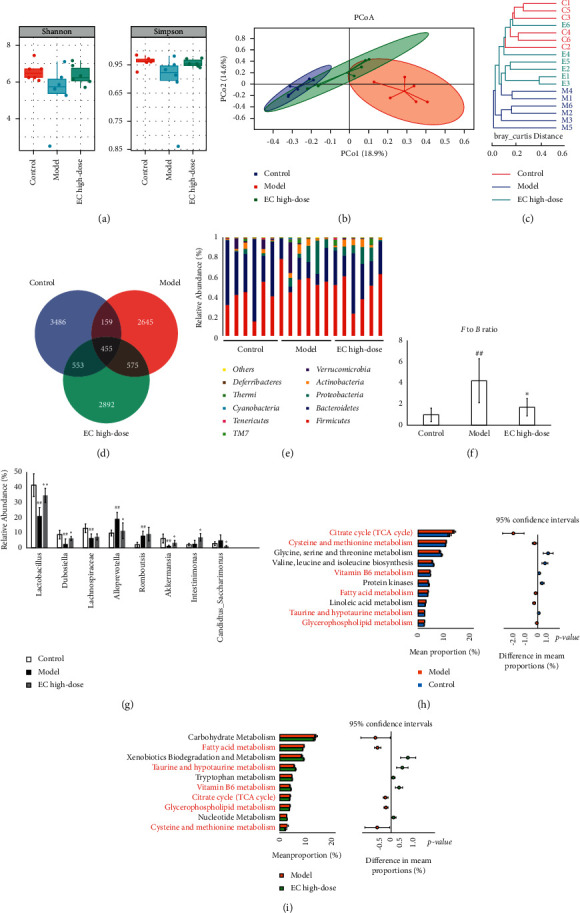
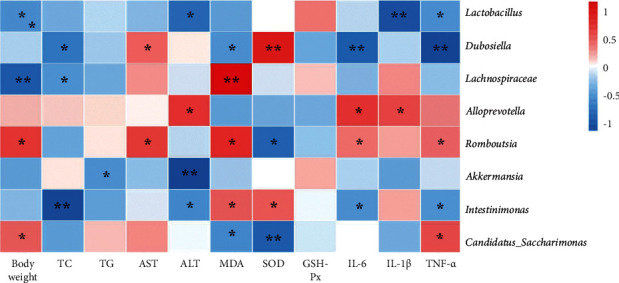
Many studies have found that the dysfunction in gut microbiota and the metabolic dysfunction can promote nonalcoholic fatty liver disease (NAFLD) development. Er-Chen decoction (EC) can be used in the treatment of NAFLD. However, the mechanism of this hepatoprotection is still unknown. In this study, we constructed a rat model with NAFLD fed with high-fat chow and administered EC treatment. The therapeutic effects of EC on NAFLD were evaluated by measuring transaminases, blood lipid levels, and pathological changes in the liver. In addition, we measured the effects of EC on liver inflammatory response and oxidative stress. The changes in gut microbiota after EC treatment were studied using 16S rRNA sequencing. Serum untargeted metabolomics analysis was also used to study the metabolic regulatory mechanisms of EC on NAFLD. The results showed that EC decreased the serum transaminases and lipid levels and improved the pathological changes in NAFLD rats. Furthermore, EC enhanced the activities of SOD and GSH-Px and decreased MDA level in the liver. EC treatment also decreased the gene and protein levels of IL-6, IL-1β, and TNF-α in the liver and serum. The 16S rRNA sequencing and untargeted metabolomics indicated that EC treatment affected the gut microbiota and regulated serum metabolism. Correlation analysis showed that the effects of EC on taurine and hypotaurine metabolism, cysteine and methionine metabolism, and vitamin B6 metabolism pathways were associated with affecting in the abundance of Lactobacillus, Dubosiella, Lachnospiraceae, Desulfovibri, Romboutsia, Akkermansia, Intestinimonas, and Candidatus_saccharimonas in the gut. In conclusion, our study confirmed the protective effect of EC on NAFLD. EC could treat NAFLD by inhibiting oxidative stress, reducing inflammatory responses, and improving the dysbiosis of gut microbiota and the modulation of the taurine and hypotaurine metabolism, cysteine and methionine metabolism, and vitamin B6 metabolism pathways in serum.
Copyright © 2022 Jing Miao et al.
Conflict of interest statement
The authors declare that they have no conflicts of interest.
Figures


Similar articles
-
Da-Chai-Hu Decoction Ameliorates High Fat Diet-Induced Nonalcoholic Fatty Liver Disease Through Remodeling the Gut Microbiota and Modulating the Serum Metabolism.Front Pharmacol. 2020 Nov 27;11:584090. doi: 10.3389/fphar.2020.584090. eCollection 2020. Front Pharmacol. 2020. PMID: 33328987 Free PMC article.
-
Jian-Gan-Xiao-Zhi Decoction Alleviates Inflammatory Response in Nonalcoholic Fatty Liver Disease Model Rats through Modulating Gut Microbiota.Evid Based Complement Alternat Med. 2021 Mar 20;2021:5522755. doi: 10.1155/2021/5522755. eCollection 2021. Evid Based Complement Alternat Med. 2021. PMID: 33824675 Free PMC article.
-
Terminalia bellirica ethanol extract ameliorates nonalcoholic fatty liver disease in mice by amending the intestinal microbiota and faecal metabolites.J Ethnopharmacol. 2023 Apr 6;305:116082. doi: 10.1016/j.jep.2022.116082. Epub 2022 Dec 27. J Ethnopharmacol. 2023. PMID: 36581163
-
Role of gut microbiota and Toll-like receptors in nonalcoholic fatty liver disease.World J Gastroenterol. 2014 Jun 21;20(23):7381-91. doi: 10.3748/wjg.v20.i23.7381. World J Gastroenterol. 2014. PMID: 24966608 Free PMC article. Review.
-
Role of Gut Dysbiosis in Liver Diseases: What Have We Learned So Far?Diseases. 2019 Nov 12;7(4):58. doi: 10.3390/diseases7040058. Diseases. 2019. PMID: 31726747 Free PMC article. Review.
Cited by
-
Genetically predicted gut bacteria, circulating bacteria-associated metabolites and pancreatic ductal adenocarcinoma: a Mendelian randomisation study.Sci Rep. 2024 Oct 24;14(1):25144. doi: 10.1038/s41598-024-77431-5. Sci Rep. 2024. PMID: 39448785 Free PMC article.
-
Effects of plant natural products on metabolic-associated fatty liver disease and the underlying mechanisms: a narrative review with a focus on the modulation of the gut microbiota.Front Cell Infect Microbiol. 2024 Feb 20;14:1323261. doi: 10.3389/fcimb.2024.1323261. eCollection 2024. Front Cell Infect Microbiol. 2024. PMID: 38444539 Free PMC article. Review.
-
Antidiabetic effect of sciadonic acid on type 2 diabetic mice through activating the PI3K-AKT signaling pathway and altering intestinal flora.Front Nutr. 2022 Dec 23;9:1053348. doi: 10.3389/fnut.2022.1053348. eCollection 2022. Front Nutr. 2022. PMID: 36618687 Free PMC article.
-
A Scoping Review on Hepatoprotective Mechanism of Herbal Preparations through Gut Microbiota Modulation.Curr Issues Mol Biol. 2024 Oct 16;46(10):11460-11502. doi: 10.3390/cimb46100682. Curr Issues Mol Biol. 2024. PMID: 39451562 Free PMC article.
-
Tangeretin Unravels Metabolic Dysfunction-Associated Fatty Liver Disease in Rats by Enhancing the IRS/Akt Pathway.Life (Basel). 2025 Mar 18;15(3):491. doi: 10.3390/life15030491. Life (Basel). 2025. PMID: 40141836 Free PMC article.
References
-
- Nonalcoholic steatohepatitis clinical research network. Hepatology . 2003;37:p. 224. - PubMed
LinkOut - more resources
Full Text Sources
