

Pharmacodynamic Parameters of Pharmacokinetic/Pharmacodynamic (PK/PD) Integration Models
- PMID: 35400105
- PMCID: PMC8989418
- DOI: 10.3389/fvets.2022.860472
Pharmacodynamic Parameters of Pharmacokinetic/Pharmacodynamic (PK/PD) Integration Models
Abstract
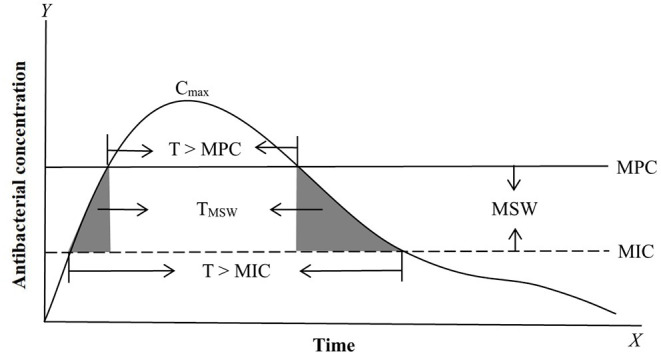
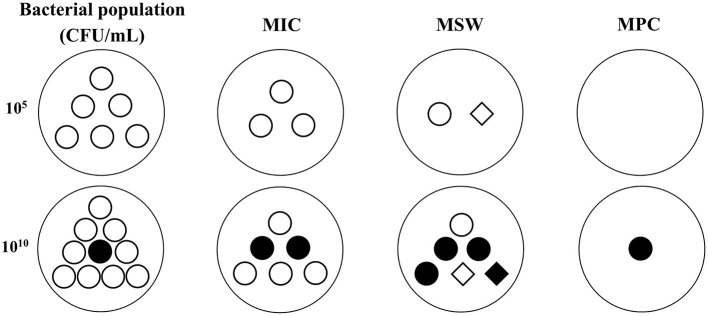
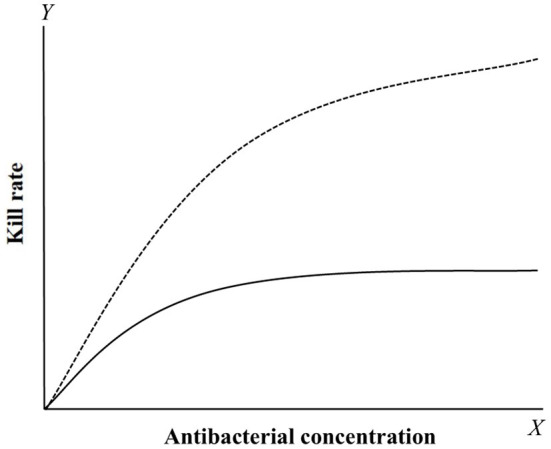
Pharmacokinetic/pharmacodynamic (PK/PD) integration models are used to investigate the antimicrobial activity characteristics of drugs targeting pathogenic bacteria through comprehensive analysis of the interactions between PK and PD parameters. PK/PD models have been widely applied in the development of new drugs, optimization of the dosage regimen, and prevention and treatment of drug-resistant bacteria. In PK/PD analysis, minimal inhibitory concentration (MIC) is the most commonly applied PD parameter. However, accurately determining MIC is challenging and this can influence the therapeutic effect. Therefore, it is necessary to optimize PD indices to generate more rational results. Researchers have attempted to optimize PD parameters using mutant prevention concentration (MPC)-based PK/PD models, multiple PD parameter-based PK/PD models, kill rate-based PK/PD models, and others. In this review, we discuss progress on PD parameters for PK/PD models to provide a valuable reference for drug development, determining the dosage regimen, and preventing drug-resistant mutations.
Keywords: MIC; PD parameter; PK/PD integration model; dosage regimen; kill rate; multi-drug resistance; mutant prevention concentration; time-kill curve.
Copyright © 2022 Zhang, Xie, Wang, Wang, Hu and Zhang.
Conflict of interest statement
The authors declare that the research was conducted in the absence of any commercial or financial relationships that could be construed as a potential conflict of interest.
Figures
Similar articles
-
The pharmacokinetic/pharmacodynamic paradigm for antimicrobial drugs in veterinary medicine: Recent advances and critical appraisal.J Vet Pharmacol Ther. 2021 Mar;44(2):172-200. doi: 10.1111/jvp.12917. Epub 2020 Oct 21. J Vet Pharmacol Ther. 2021. PMID: 33089523 Review.
-
New concept and a theoretical consideration of the mechanism-based pharmacokinetics/ pharmacodynamics (PK/PD) modeling for antimicrobial agents.Jpn J Antibiot. 2008 Oct;61(5):314-38. Jpn J Antibiot. 2008. PMID: 19260351
-
Pharmacokinetic-Pharmacodynamic Modeling of Enrofloxacin Against Escherichia coli in Broilers.Front Vet Sci. 2016 Jan 7;2:80. doi: 10.3389/fvets.2015.00080. eCollection 2015. Front Vet Sci. 2016. PMID: 26779495 Free PMC article.
-
Pharmacokinetic/pharmacodynamic (PK/PD) indices of antibiotics predicted by a semimechanistic PKPD model: a step toward model-based dose optimization.Antimicrob Agents Chemother. 2011 Oct;55(10):4619-30. doi: 10.1128/AAC.00182-11. Epub 2011 Aug 1. Antimicrob Agents Chemother. 2011. PMID: 21807983 Free PMC article.
-
Integration and modelling of pharmacokinetic and pharmacodynamic data to optimize dosage regimens in veterinary medicine.J Vet Pharmacol Ther. 2004 Dec;27(6):467-77. doi: 10.1111/j.1365-2885.2004.00613.x. J Vet Pharmacol Ther. 2004. PMID: 15601441 Review.
Cited by
-
Pharmacokinetics-Pharmacodynamics Modeling for Evaluating Drug-Drug Interactions in Polypharmacy: Development and Challenges.Clin Pharmacokinet. 2024 Jul;63(7):919-944. doi: 10.1007/s40262-024-01391-2. Epub 2024 Jun 18. Clin Pharmacokinet. 2024. PMID: 38888813 Review.
-
Comparative Minimum Inhibitory and Mutant Prevention Drug Concentrations for Pradofloxacin and Seven Other Antimicrobial Agents Tested against Bovine Isolates of Mannheimia haemolytica and Pasteurella multocida.Pathogens. 2024 May 9;13(5):399. doi: 10.3390/pathogens13050399. Pathogens. 2024. PMID: 38787251 Free PMC article.
-
Mutant Prevention Concentration, Frequency of Spontaneous Mutant Selection, and Mutant Selection Window-a New Approach to the In Vitro Determination of the Antimicrobial Potency of Compounds.Antimicrob Agents Chemother. 2023 May 17;67(5):e0137322. doi: 10.1128/aac.01373-22. Epub 2023 Apr 6. Antimicrob Agents Chemother. 2023. PMID: 37022162 Free PMC article.
-
Comparative In Vitro Killing by Pradofloxacin in Comparison to Ceftiofur, Enrofloxacin, Florfenicol, Marbofloxacin, Tildipirosin, Tilmicosin and Tulathromycin against Bovine Respiratory Bacterial Pathogens.Microorganisms. 2024 May 15;12(5):996. doi: 10.3390/microorganisms12050996. Microorganisms. 2024. PMID: 38792823 Free PMC article.
-
Designing Effective Drug Therapies Using a Multiobjective Spider-Wasp Optimizer.Biomimetics (Basel). 2025 Apr 2;10(4):219. doi: 10.3390/biomimetics10040219. Biomimetics (Basel). 2025. PMID: 40277618 Free PMC article.
References
Publication types
LinkOut - more resources
Full Text Sources