. 2022 Apr 29;130(9):1289-1305.
doi: 10.1161/CIRCRESAHA.121.320704. Epub 2022 Apr 11.

Myeloid Cell PKM2 Deletion Enhances Efferocytosis and Reduces Atherosclerosis

Affiliations

Myeloid Cell PKM2 Deletion Enhances Efferocytosis and Reduces Atherosclerosis

Prakash Doddapattar et al. Circ Res. .

Abstract

Background: The glycolytic enzyme PKM2 (pyruvate kinase muscle 2) is upregulated in monocytes/macrophages of patients with atherosclerotic coronary artery disease. However, the role of cell type-specific PKM2 in the setting of atherosclerosis remains to be defined. We determined whether myeloid cell-specific PKM2 regulates efferocytosis and atherosclerosis.

Methods: We generated myeloid cell-specific PKM2-/- mice on Ldlr (low-density lipoprotein receptor)-deficient background (PKM2mye-KOLdlr-/-). Controls were littermate PKM2WTLdlr-/- mice. Susceptibility to atherosclerosis was evaluated in whole aortae and cross sections of the aortic sinus in male and female mice fed a high-fat Western diet for 14 weeks, starting at 8 weeks.

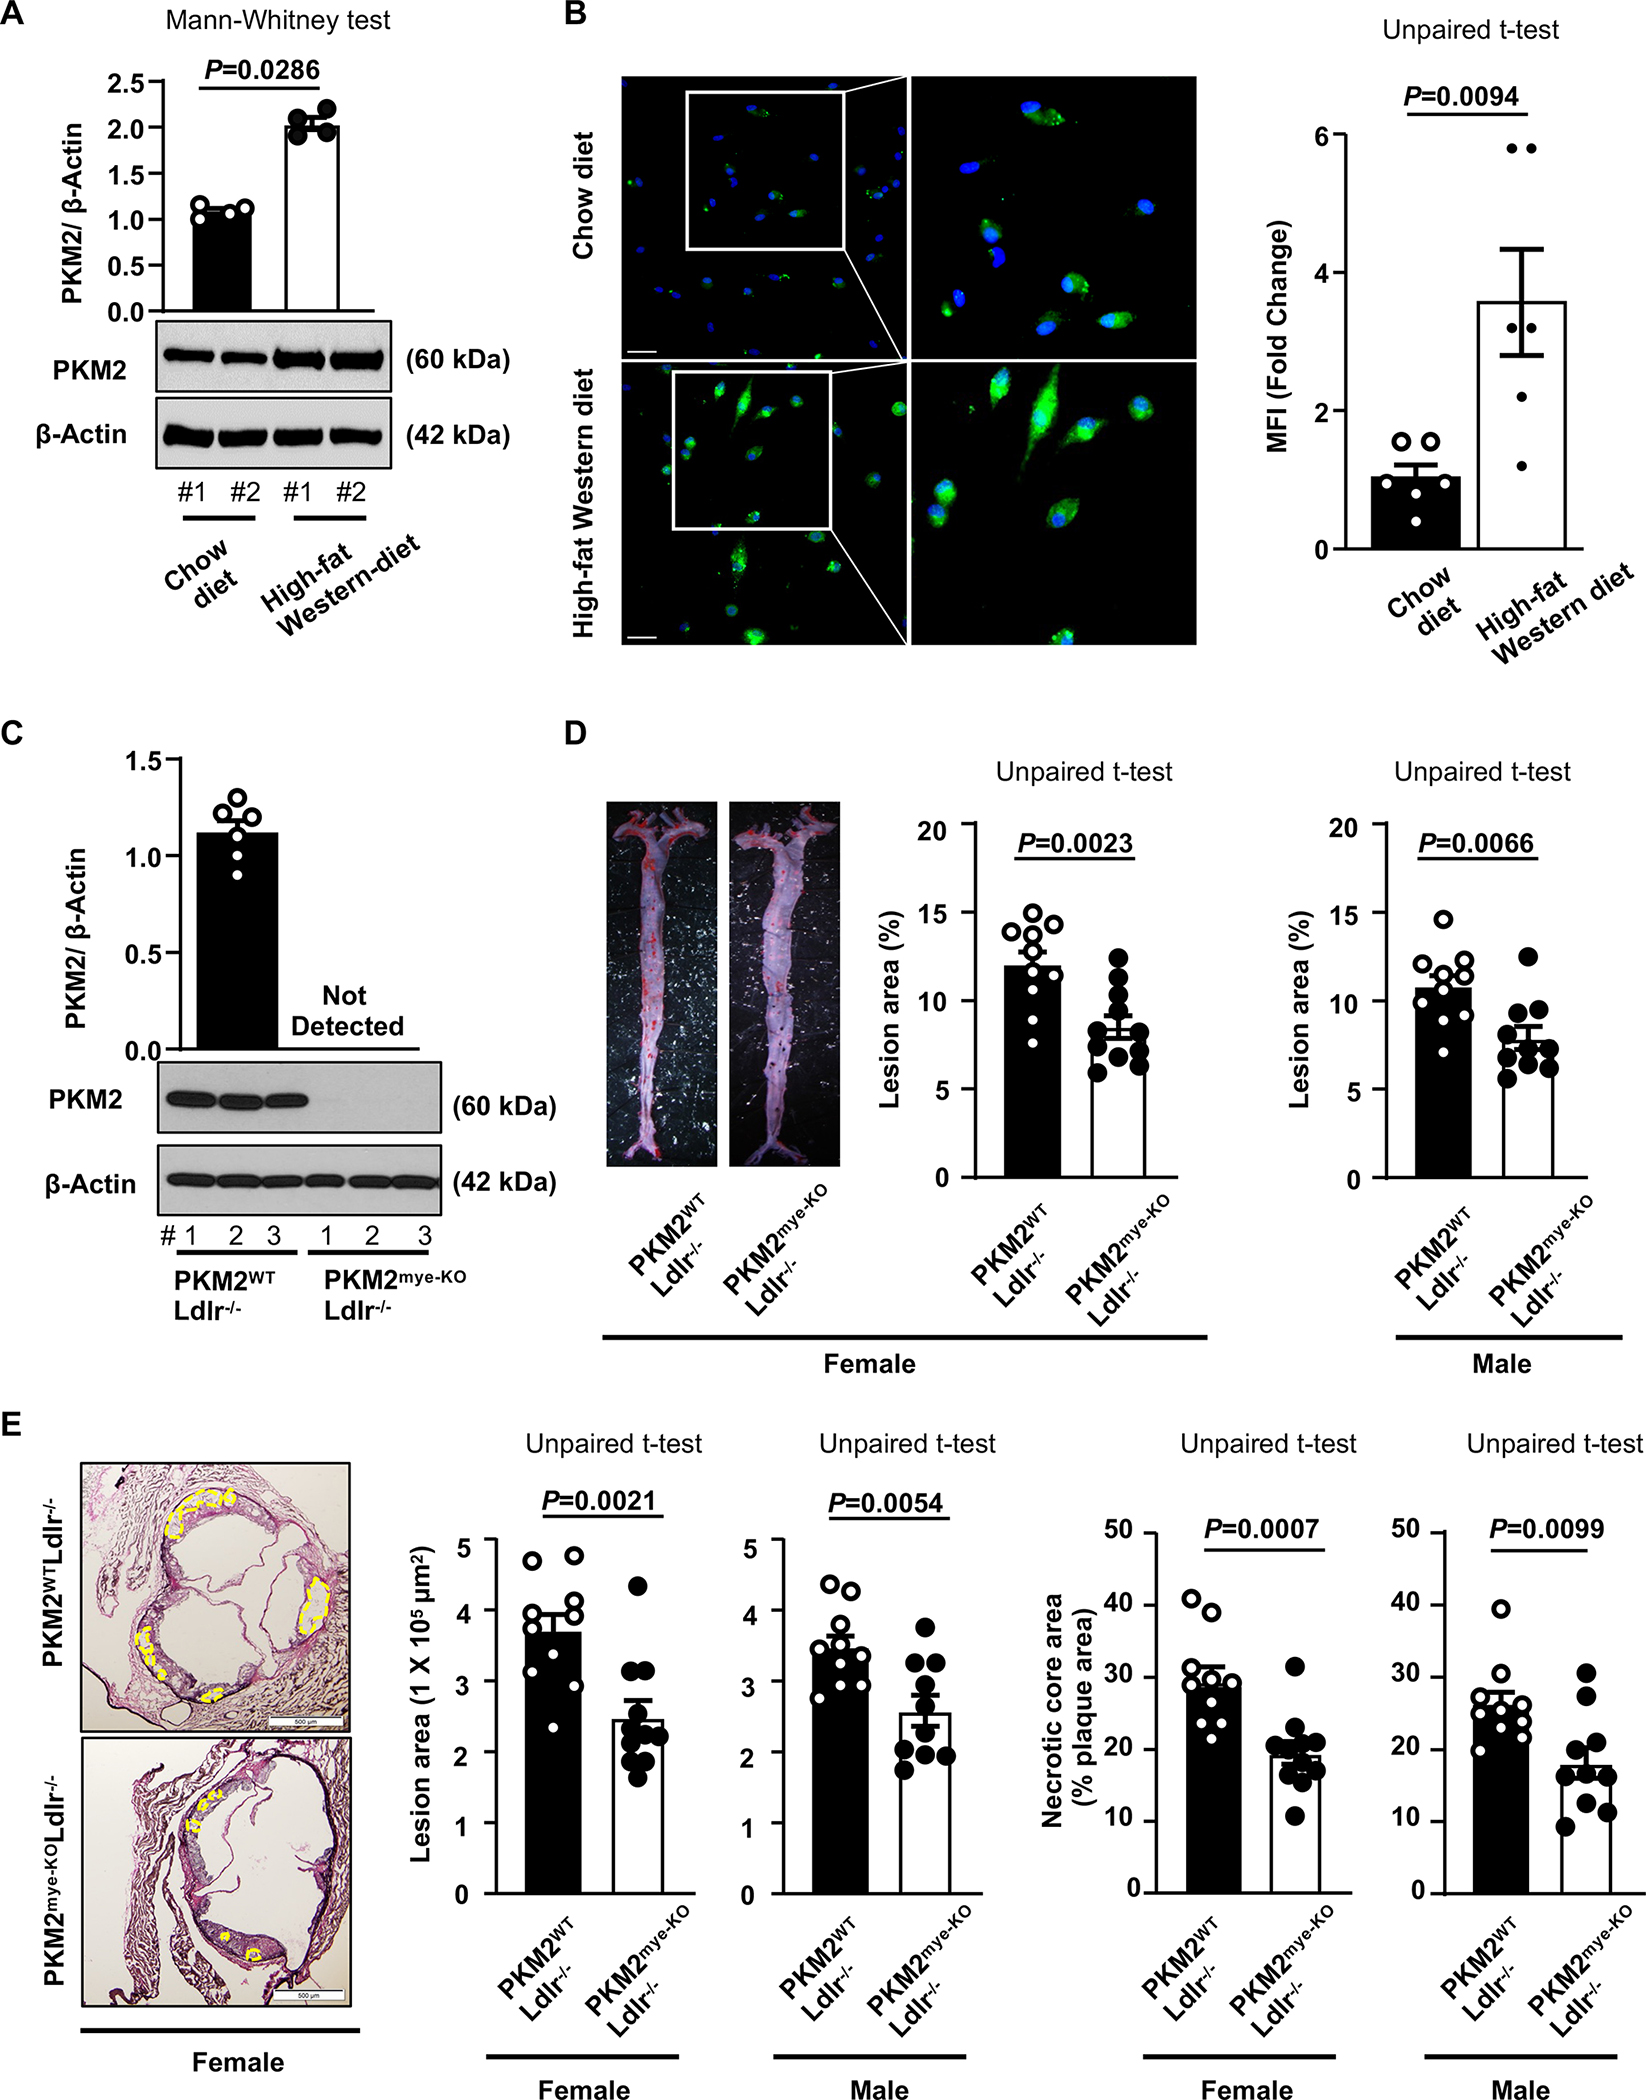
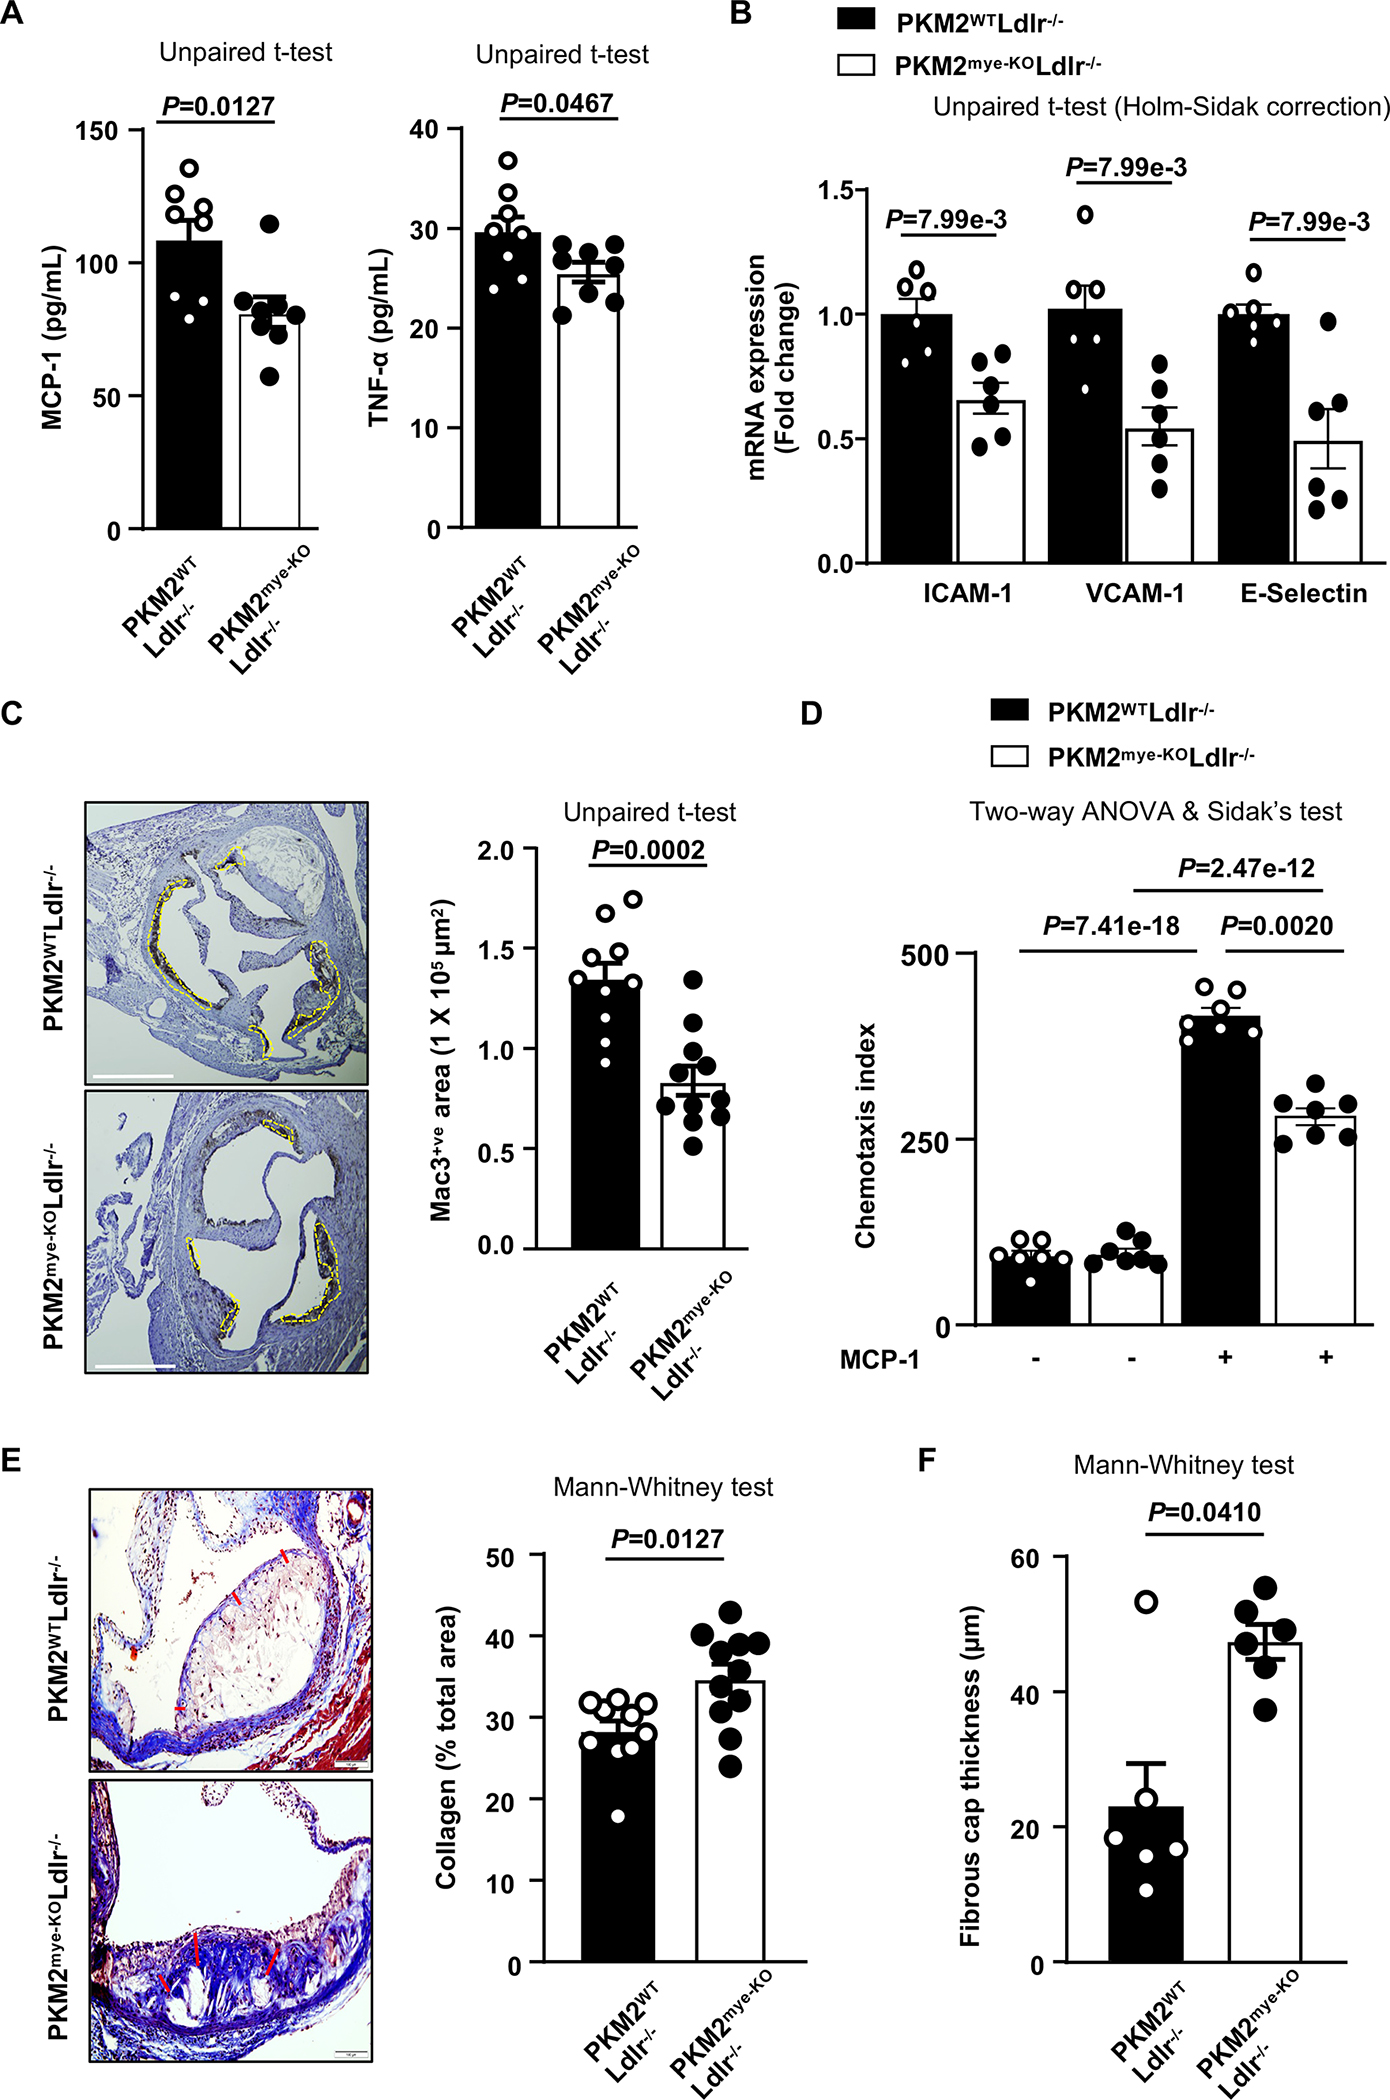
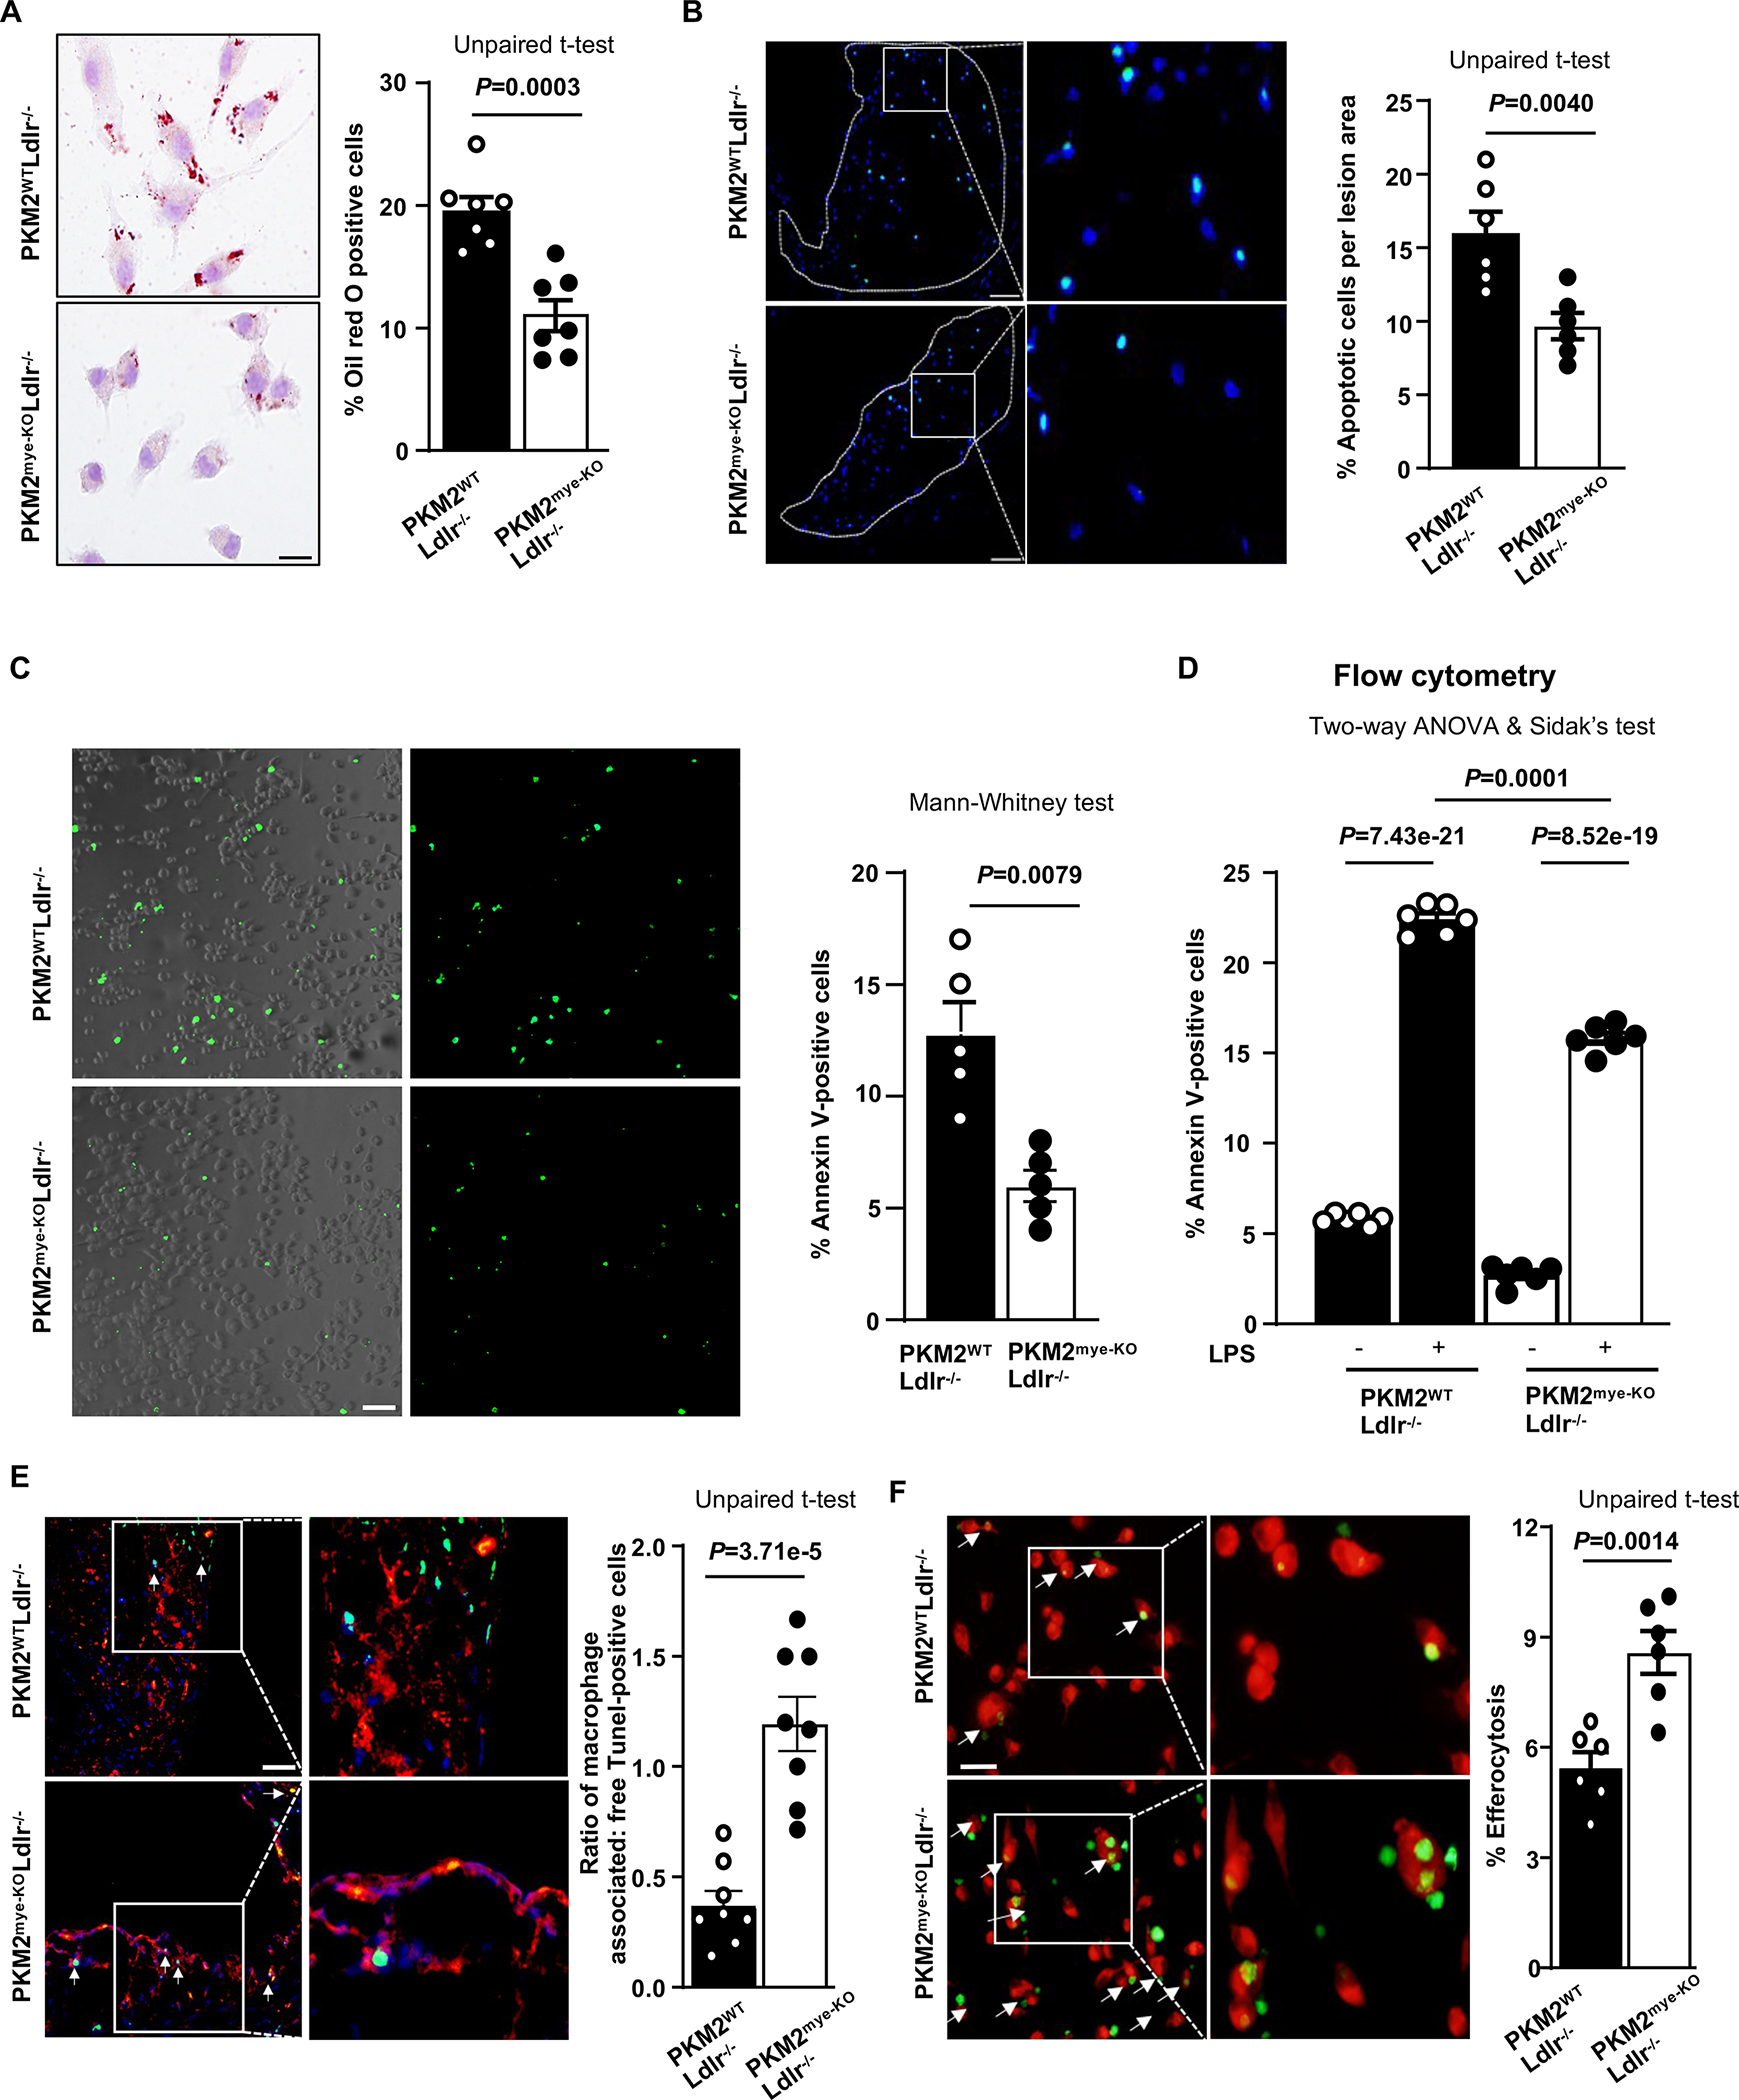
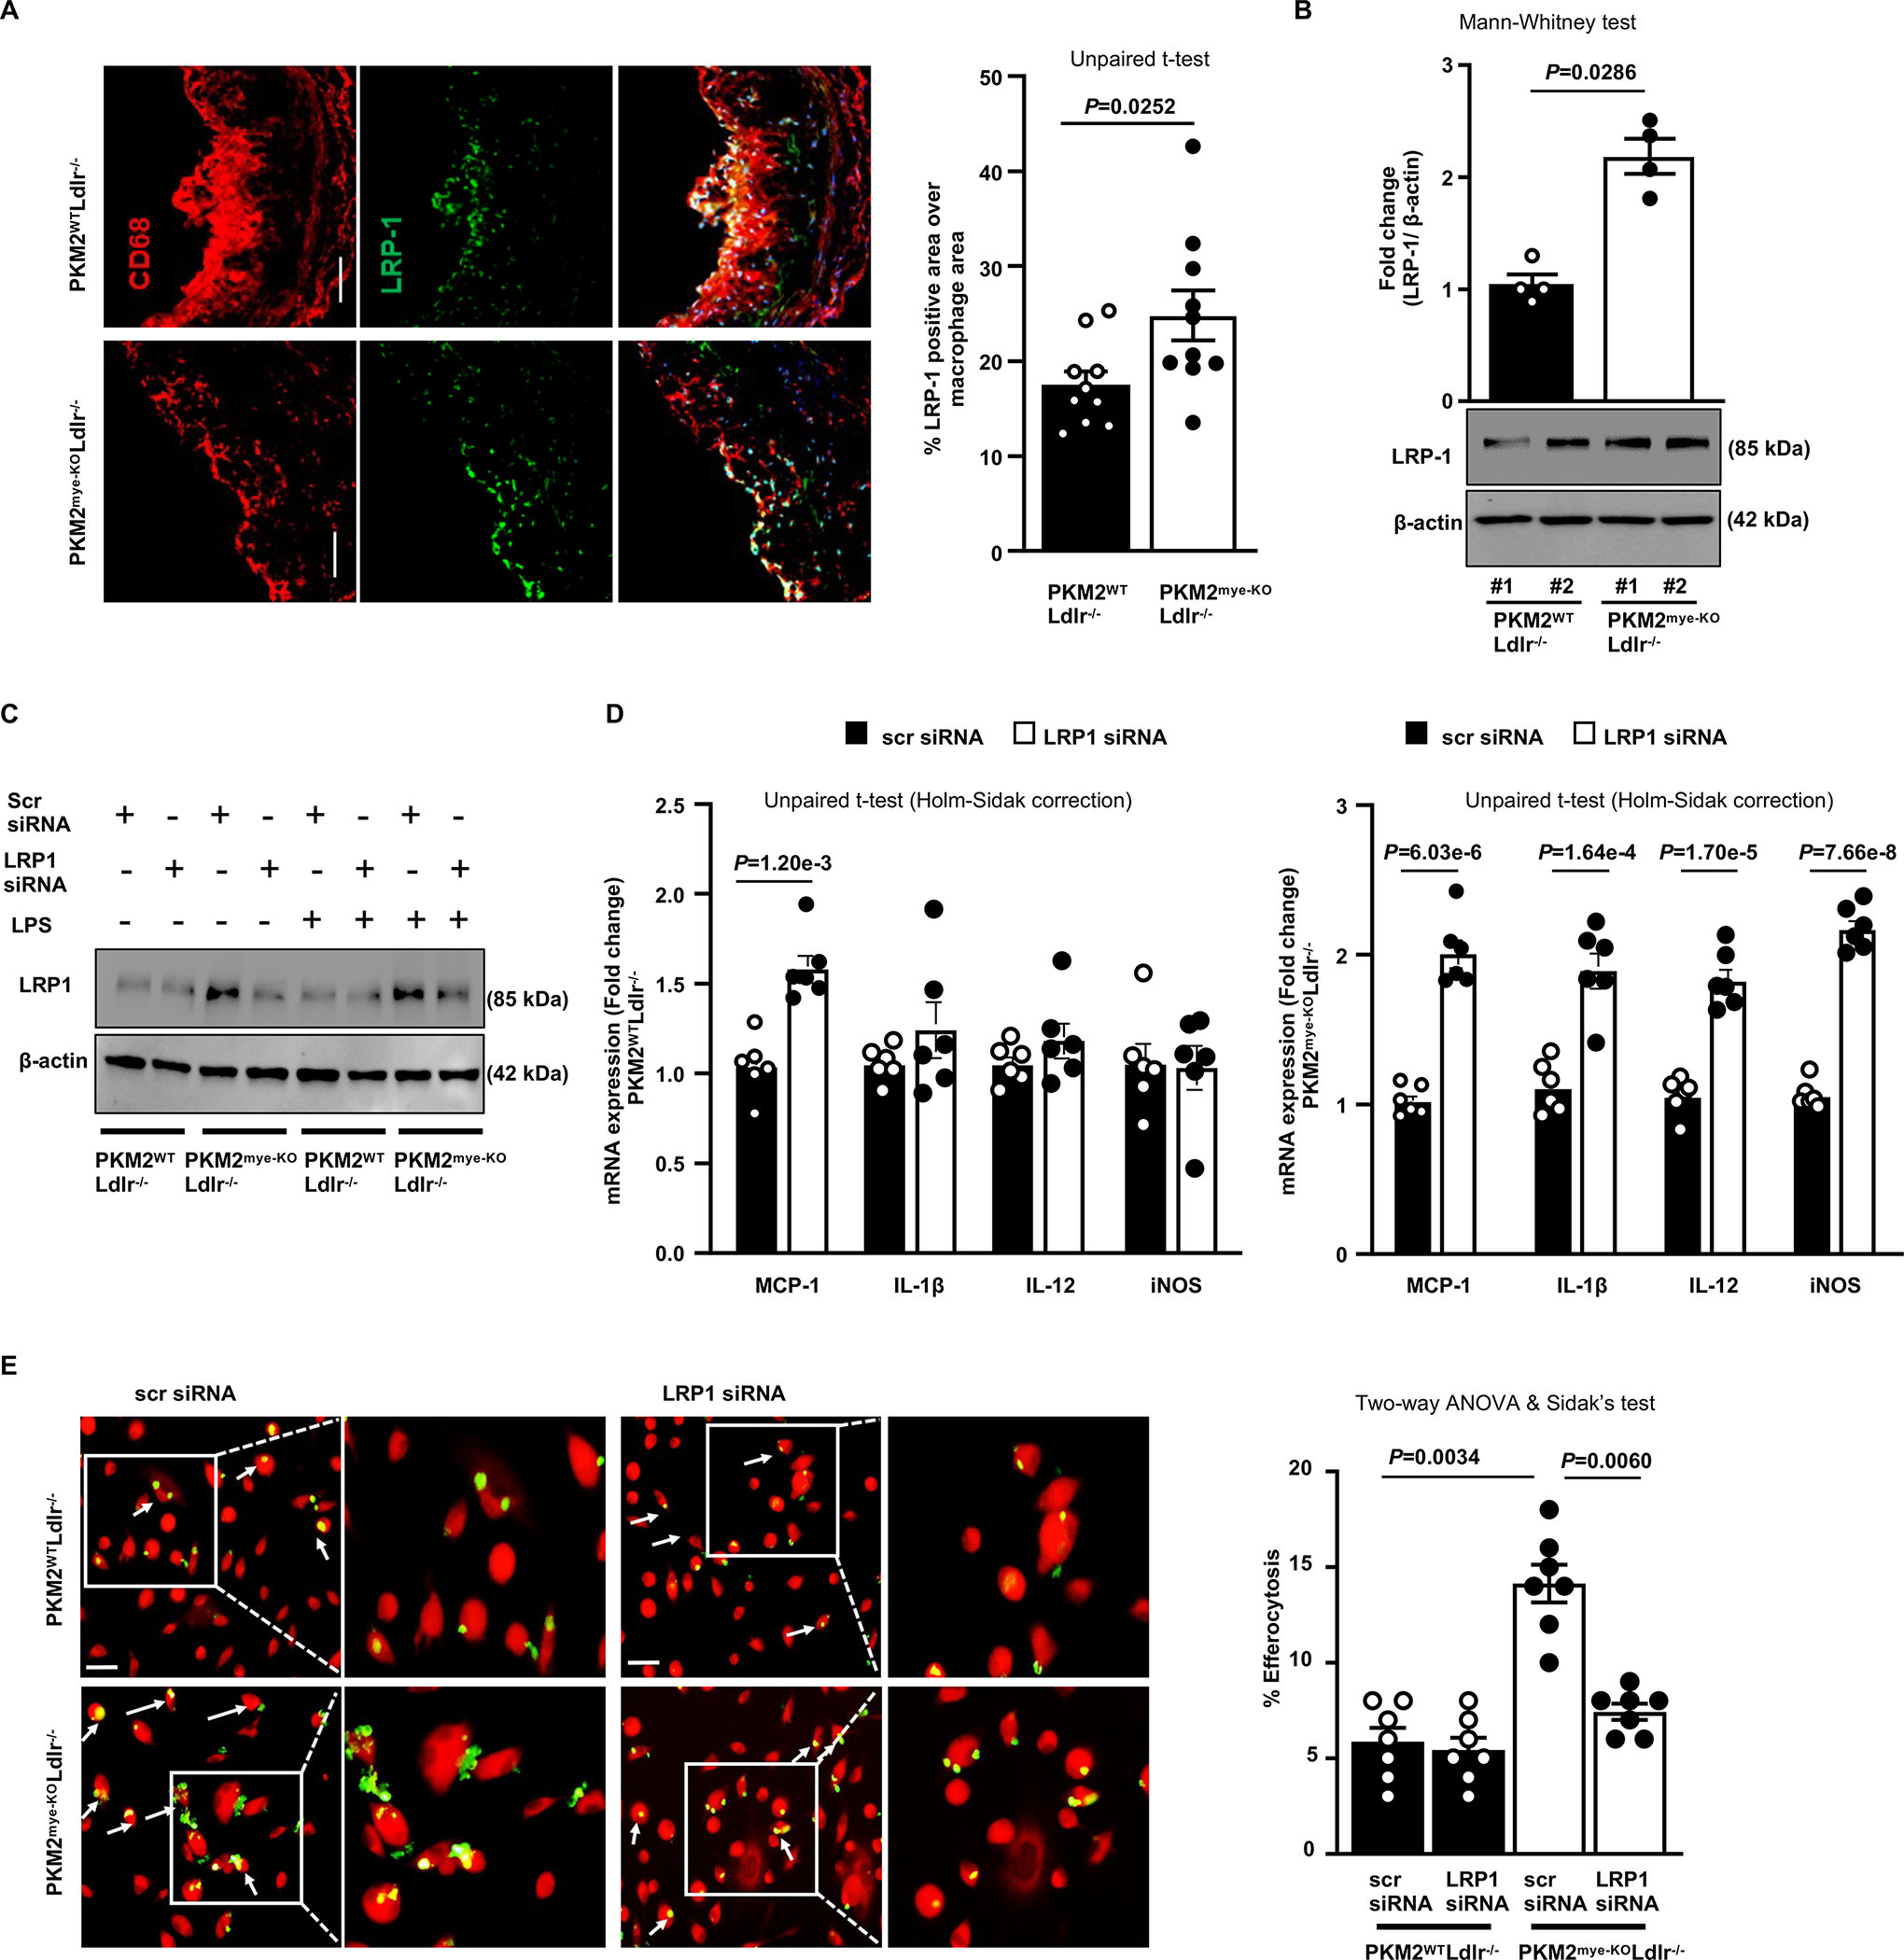
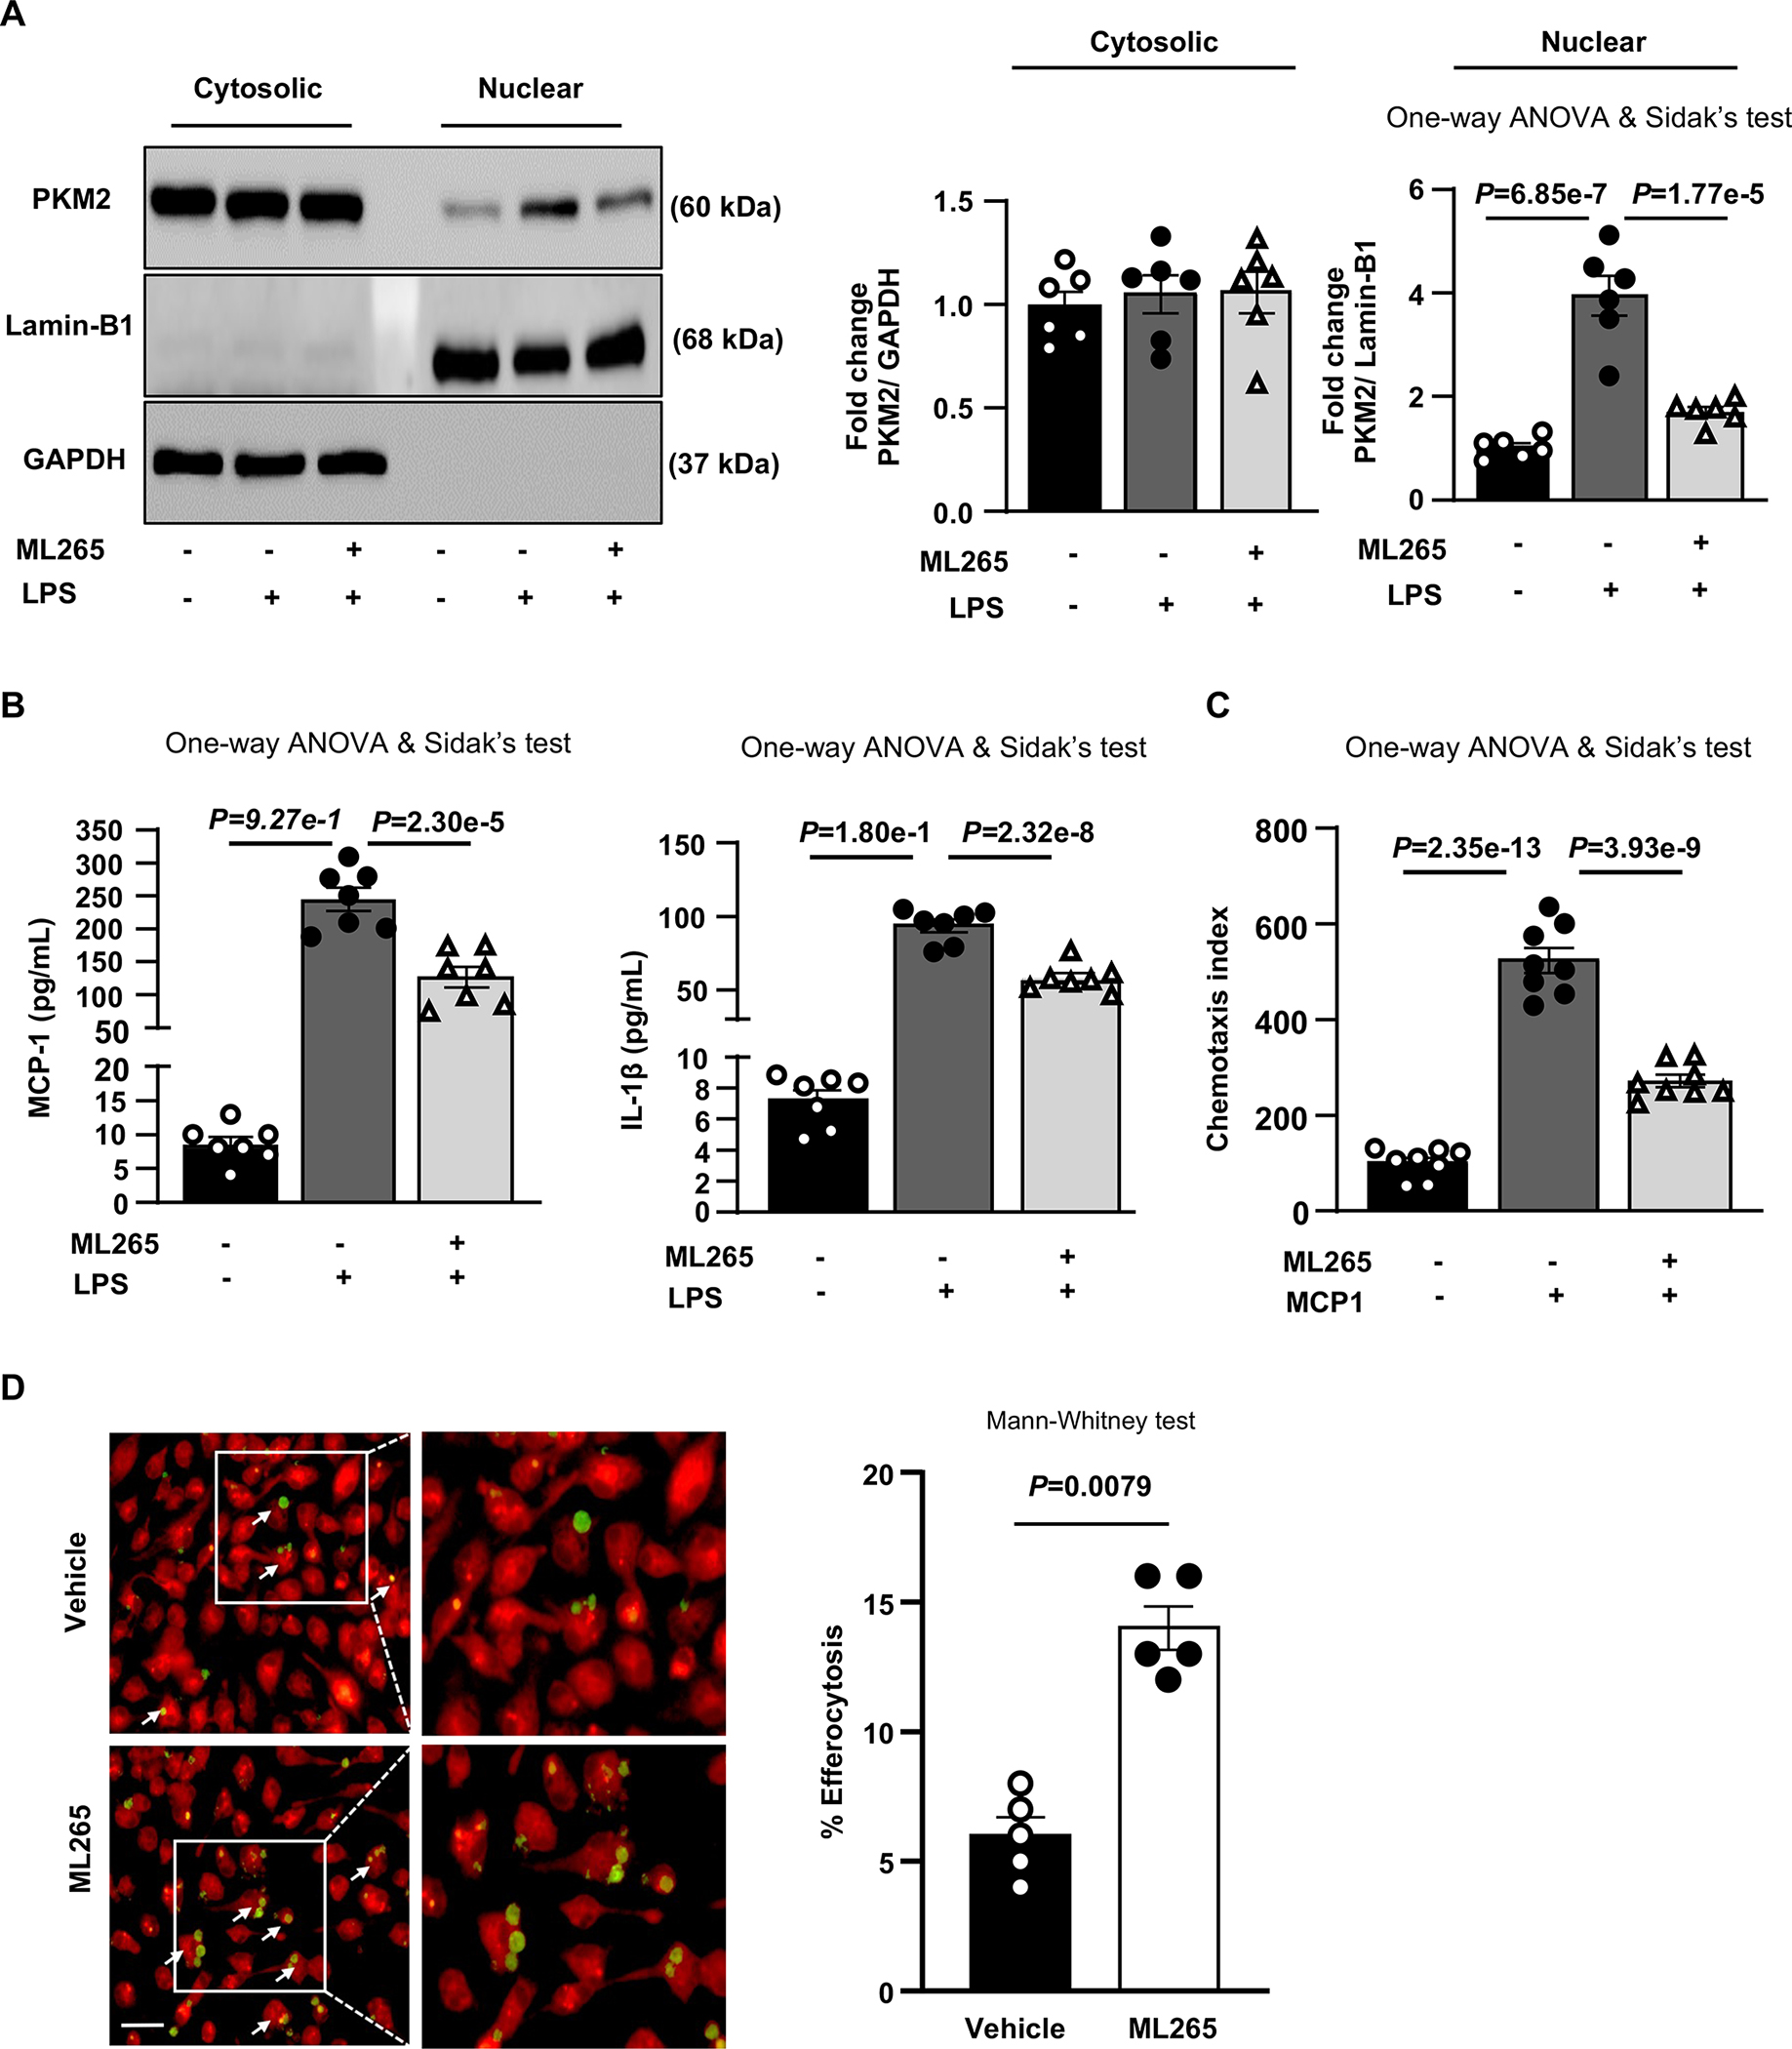
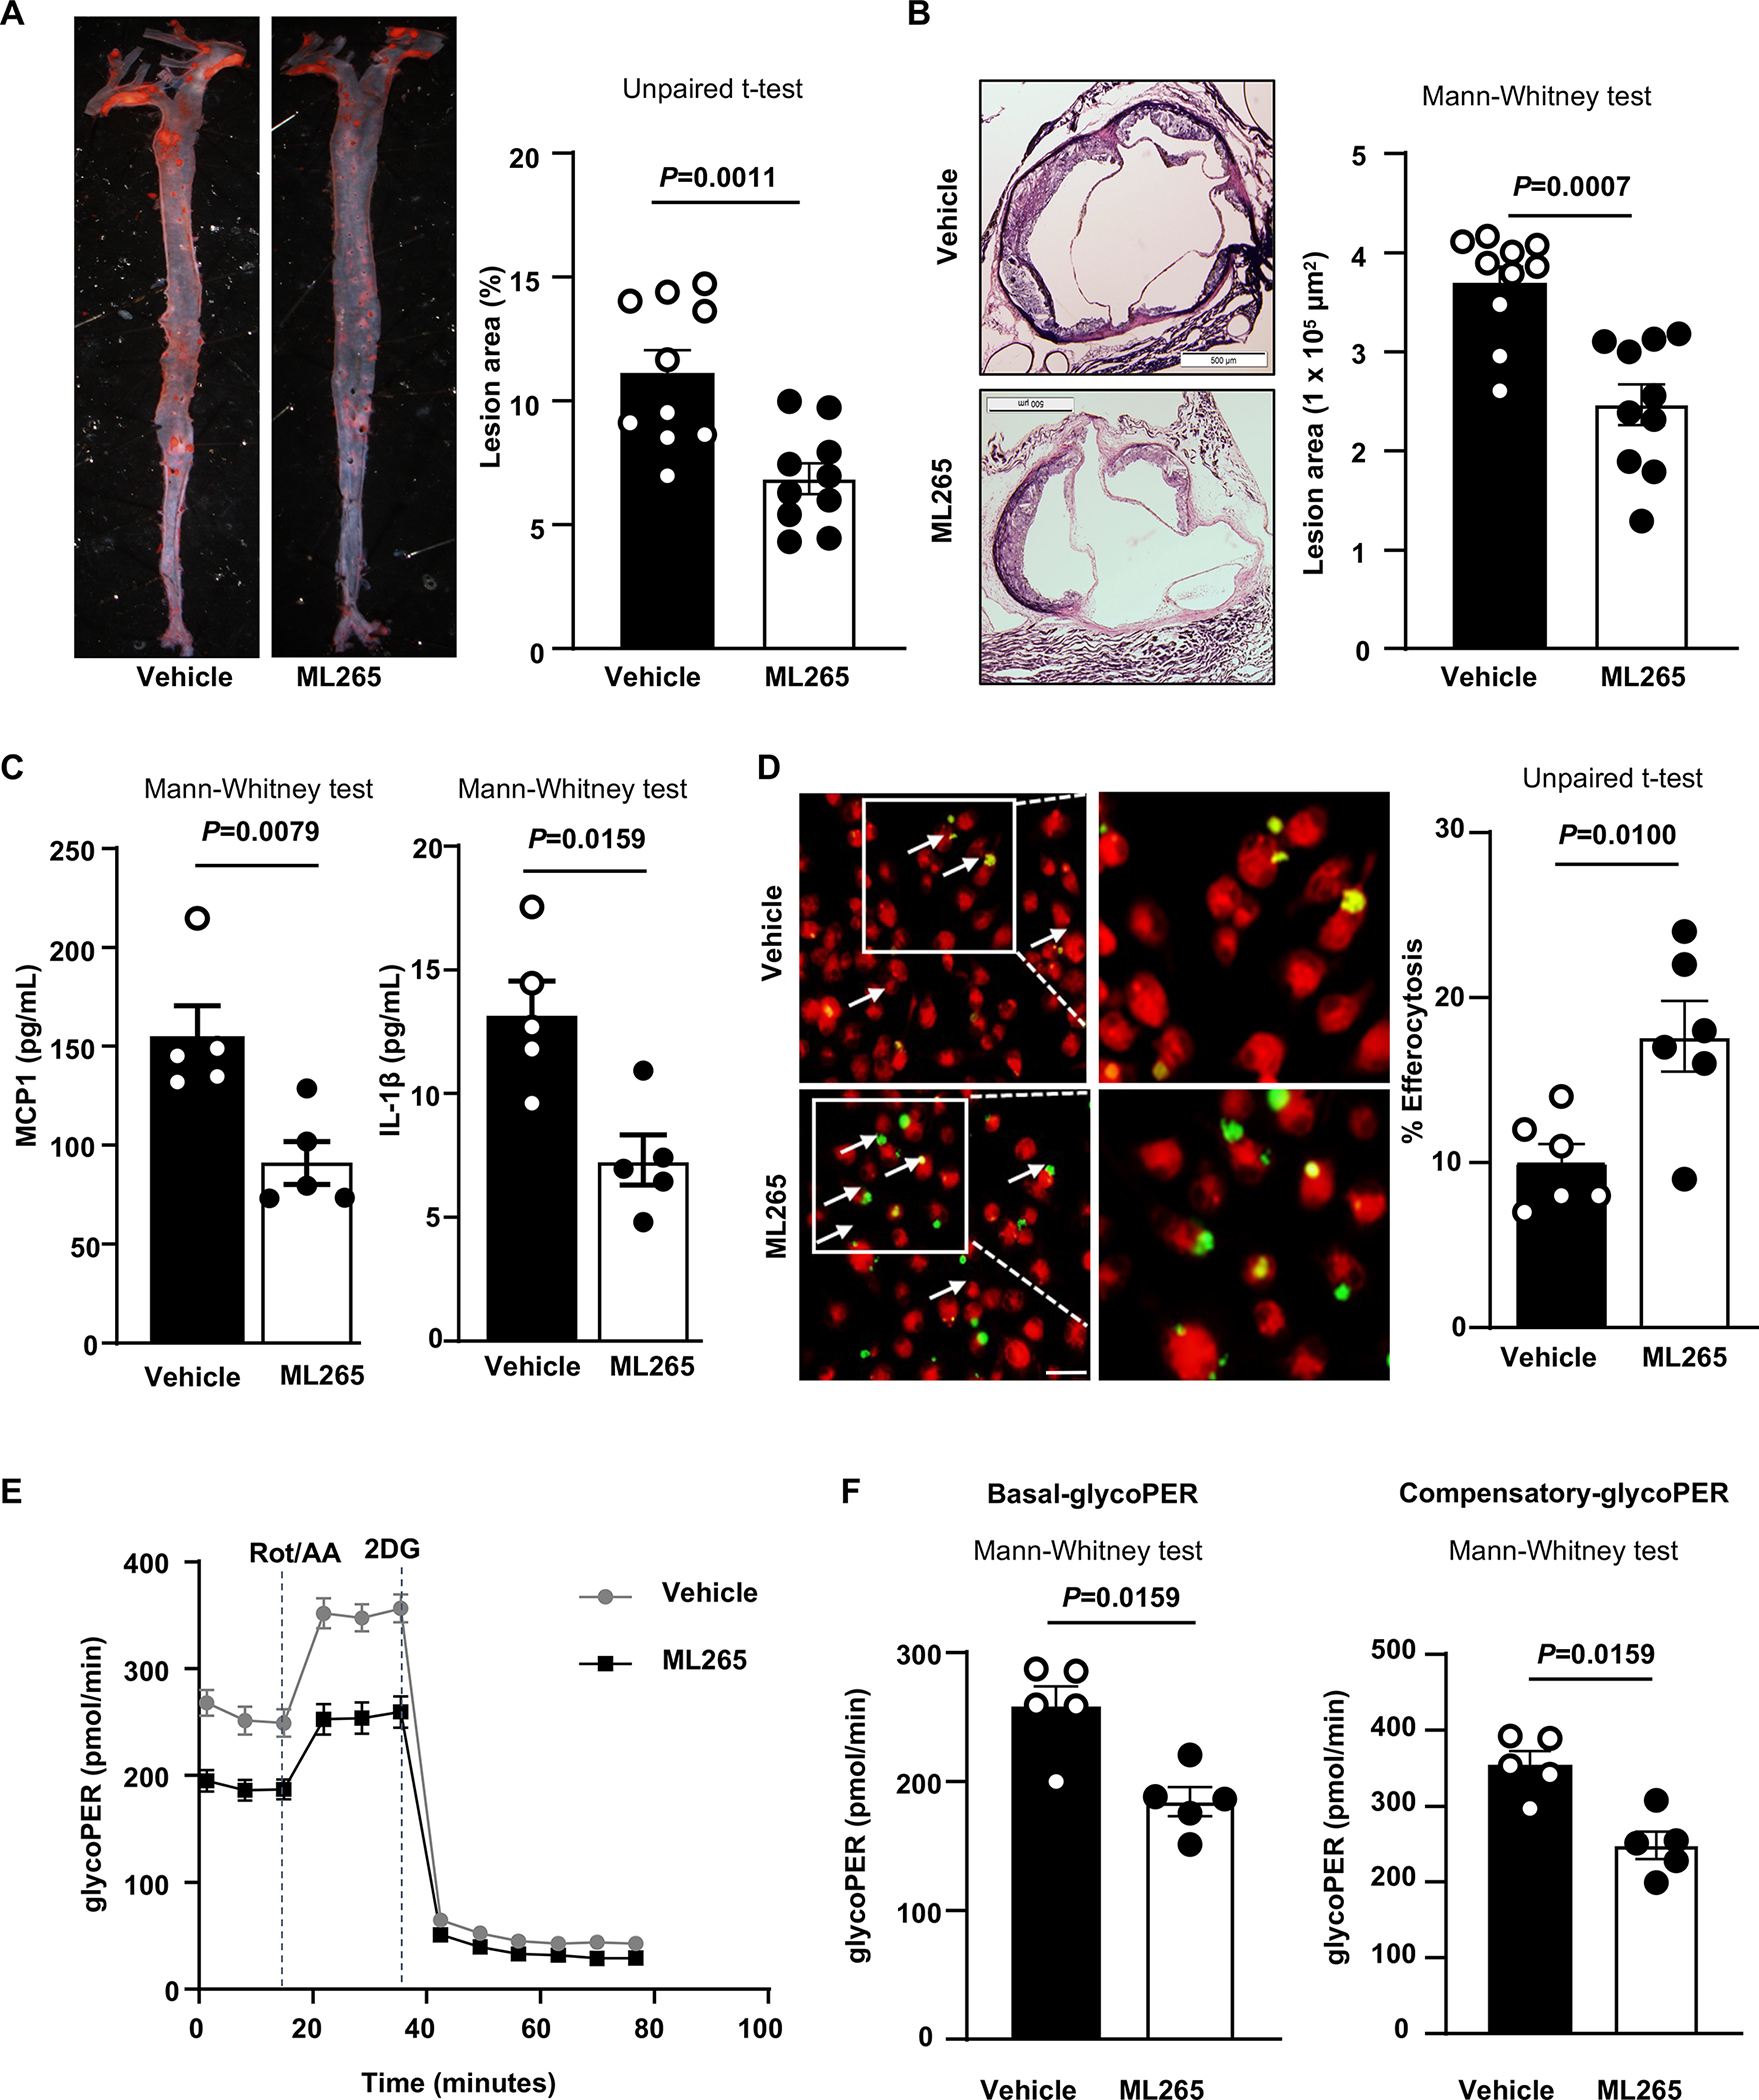
Results: PKM2 was upregulated in macrophages of Ldlr-/- mice fed a high-fat Western diet compared with chow diet. Myeloid cell-specific deletion of PKM2 led to a significant reduction in lesions in the whole aorta and aortic sinus despite high cholesterol and triglyceride levels. Furthermore, we found decreased macrophage content in the lesions of myeloid cell-specific PKM2-/- mice associated with decreased MCP-1 (monocyte chemoattractant protein 1) levels in plasma, reduced transmigration of macrophages in response to MCP-1, and impaired glycolytic rate. Macrophages isolated from myeloid-specific PKM2-/- mice fed the Western diet exhibited reduced expression of proinflammatory genes, including MCP-1, IL (interleukin)-1β, and IL-12. Myeloid cell-specific PKM2-/- mice exhibited reduced apoptosis concomitant with enhanced macrophage efferocytosis and upregulation of LRP (LDLR-related protein)-1 in macrophages in vitro and atherosclerotic lesions in vivo. Silencing LRP-1 in PKM2-deficient macrophages restored inflammatory gene expression and reduced efferocytosis. As a therapeutic intervention, inhibiting PKM2 nuclear translocation using a small molecule reduced glycolytic rate, enhanced efferocytosis, and reduced atherosclerosis in Ldlr-/- mice.

Conclusions: Genetic deletion of PKM2 in myeloid cells or limiting its nuclear translocation reduces atherosclerosis by suppressing inflammation and enhancing efferocytosis.

Keywords: atherosclerosis; gene expression; inflammation; macrophages; pyruvate kinase.


Figures

Figure 1.
Figure 1.. Myeloid cell-specific PKM2−/− mice exhibit reduced atherosclerosis.
A, Representative Western blot and quantification of PKM2 levels in peritoneal macrophages from Ldlr−/− mice fed a chow diet (n=4) or high-fat “Western” diet (n=4) for 14 weeks. Loading control:β-actin. #1, 2, represents individual mouse. B, Left panels show representative immunofluorescence staining of PKM2 (green) from peritoneal macrophages of Ldlr−/− mice fed a chow diet (n=6) or high-fat “Western” diet (n=6) for 14 weeks. Nuclei are counterstained with Hoechst (blue). The boxed region is magnified. The right panel shows the mean fluorescence intensity (MFI). Scale bars, 50 μm. C, Western blot analysis of PKM2 from the peritoneal macrophages (n=6, 6). #1, 2, 3 represents individual mouse. D, Left panels show representative photomicrographs and right panels show quantification of en face lesion area in the whole aortae of female (n=10, 11) or male (n=10, 10) mice fed a high-fat Western-diet for 14 weeks. E, Left panels show representative photomicrographs, middle panels show quantification of cross-sectional lesion area in aortic sinuses, and right panels show acellular (demarcated) necrotic area. Female (n=10, 11), Male (n=10, 10). Scale bar, 500 μm. Results were presented with mean ± SEM. Statistical analysis as indicated in the figure panels.
Figure 2.
Figure 2.. Chimeric mice lacking PKM2 in myeloid cells exhibit reduced atherosclerosis.
Lethally irradiated 6-week-old Ldlr−/− mice were reconstituted with bone marrow from either PKM2mye-KO or littermate PKM2WT mice. Mice were placed on a high-fat “Western” diet for additional 12 weeks beginning at the 10 weeks of age. A, Representative photomicrographs and quantification of en face lesion area in the whole aortae. Female (n=10, 12). Male (n=10, 10). B, Representative photomicrographs and quantification of cross-sectional lesion area in aortic sinuses. The acellular necrotic area is marked (yellow dotted line). Scale bar, 500 μm. Female (n=10, 12). Male (n=10, 10). Results were presented with mean ± SEM. Statistical analysis as indicated in the figure panels.
Figure 3.
Figure 3.. Deletion of PKM2 in myeloid cells suppresses inflammation, chemotaxis, accumulation of macrophages in lesions, and promotes collagen deposition.
All the mice were females. A, Quantification of pro-inflammatory cytokines in plasma (n=8, 8). B, Real-time quantitative PCR analysis of ICAM-1, VCAM-1 and E-Selectin genes from the RNA isolated from whole aortae (n=6, 6). C, Representative photomicrographs and mac3-positive cells quantification in aortic sinuses (n=10, 11). Scale bar, 500 μm. D, Chemotaxis index for transmigrated bone marrow-derived macrophages (n=7, 7). E, Representative photomicrographs and quantification of collagen deposition (Masson’s Trichrome staining) in aortic sinuses (n=10, 11). Scale bar, 100 μm. F, Fibrous cap (demarcated by the red line) was calculated as the thickness of fibrous tissue overlying the necrotic core (n=6, 6). Results were presented with mean ± SEM. Statistical analysis as indicated in the figure panels.
Figure 4.
Figure 4.. PKM2 deficient macrophages exhibit reduced pro-inflammatory response and reduced glycolytic activity.
All the mice were females. A, Real-time quantitative PCR analysis of pro-inflammatory and anti-inflammatory genes in primary elicited macrophages of mice fed a high-fat “Western” diet (n=7, 7). B, Bone marrow-derived macrophages (BMDMs) from wild-type Ldlr−/− mice were unstimulated (n=7) or stimulated with 100 ng/mL LPS (n=7) or 10 ng/mL IL-4 (n=7) for 24 hrs and nuclear and cytosolic PKM2 protein levels were analyzed by immunoblotting. Loading control: Lamin-B1 and GAPDH. C, BMDMs were stimulated with LPS for 4 hours. Representative immunoblots and densitometric analysis of phospho and total STAT3 in nuclear proteins fraction. Loading control: Lamin-B1. Unstimulated (n=7, 7). LPS-treated (n=7, 7). D, Glycolytic proton efflux rate (glycoPER) levels in untreated and LPS-treated (100 ng/ml) BMDMs (100,000 cells per well) were assessed by Seahorse extracellular flux analyzer. The basal respiration values were noted for 15 mins before injecting the Rot/AA (0.5 μM). Finally, 2-DG was injected, and values were measured for 40 mins. Left panel shows glycoPER curve, whereas right panel shows basal and compensatory glycolysis rate. Unstimulated, (n=10, 10). LPS-treated (n=10, 10). Results were presented with mean ± SEM. Statistical analysis as indicated in the figure panels.
Figure 5.
Figure 5.. Deletion of PKM2 in macrophages suppresses foam cell formation and enhances macrophage efferocytosis in vitro and in lesions.
All the mice were females. A, Representative photomicrographs and quantification of ox-LDL (oxidized low-density lipoprotein; 40 μg/mL, 24 hours)-treated BMDMs, stained with Oil Red O (n=7, 7). Scale bar, 50 μM. B, The left panels show representative TUNEL-positive cells (green) counterstained with Hoechst (blue) per plaque area. The right panel shows the quantification of percentage TUNEL-positive cells to a total number of cells per plaque area (n=6, 6). The boxed region is magnified. Scale bars, 50 μm. C, Annexin V staining using BMDMs determined the percentage of apoptotic cells (n=5, 5). Scale bar, 100 μm. D, Flow cytometry analysis of percent of apoptotic macrophages positive for Annexin V after 24 hours in the presence or absence of LPS (100 ng/mL) (n=6, 6). E, Quantification of the ratio of macrophage-associated TUNEL-positive versus free TUNEL-positive cells in aortic sections (white arrows) (n=8, 8). The boxed region is magnified. Scale bar, 100 μm. F, Fluorescent images of labeled macrophages (red) with apoptotic thymocytes (green). Percent efferocytosis was quantified as the number of macrophages with engulfed apoptotic cells as a percentage of total macrophages (n=6, 6). The boxed region is magnified. Scale bar, 20 μM. Results were presented with mean ± SEM. Statistical analysis as indicated in the figure panels.
Figure 6.
Figure 6.. PKM2 deficiency in macrophages suppresses inflammation and enhances efferocytosis by upregulating LRP-1.
All the mice were females and fed a high-fat western diet for 14 weeks. A, The left panels show representative double immunostaining for macrophage (CD68; Red) and LRP-1 (green) in aortic sinuses. The right panel shows quantification of LRP-1 positive area in the macrophages (n=10, 10). Scale bar, 50 μm. B, Representative immunoblots and densitometric analysis of LRP-1 and β-actin in whole-cell lysates from macrophages (n=4, 4). C, BMDMs were transfected with either scrambled siRNA (10 nM) or LRP1 siRNA (10 nM). Representative Western blot of LRP1 levels in BMDMs upon LRP1 siRNA transfection in the presence or absence of LPS (100 ng/mL). Scrambled siRNA was used as a negative control. D, Real-time quantitative PCR analysis of pro-inflammatory genes in BMDMs respectively upon LPS (100 ng/mL) treatment for 24 hours (n=6, 6). E, Fluorescent images of CMTPX-labeled macrophages (red) with CFDA SE-labeled apoptotic thymocytes (green). Percent efferocytosis was quantified as the number of macrophages with engulfed apoptotic cells as a percentage of total macrophages (n=7, 7). The boxed region is magnified. Scale bar, 20 μM. Results were presented with mean ± SEM. Statistical analysis as indicated in the figure panels.
Figure 7.
Figure 7.. Limiting PKM2 nuclear translocation inhibits pro-inflammatory cytokines, reduces chemotaxis and enhances efferocytosis.
BMDMs were pretreated with vehicle or ML-265 (100 μM) for 1 hour and further stimulated with LPS (100 ng/ml; 24 hours) or MCP-1 (50 ng/mL; overnight) as indicated. A, Representative immunoblots and densitometric analysis of PKM2, Lamin-B1, and GAPDH in cytosolic and nuclear protein fractions (n=6, 6). B, Quantification of MCP-1 and IL-1β levels in cell culture supernatants (n=7, 7). C, Chemotaxis index for migrated cells upon MCP-1 treatment (n=8, 8). D, Elicited peritoneal macrophages were pretreated with vehicle (n=5) or ML-265 (n=5) for 1 hour and then cocultured with CFDA SE labeled (green) apoptotic wild-type mouse thymocytes and labeled with CMTPX (red) for the next 2 hours. Percent efferocytosis was quantified as the number of macrophages with engulfed apoptotic cells as a percentage of total macrophages. Scale bar, 20 μM. The boxed region is magnified. Results were presented with mean ± SEM. Statistical analysis are mentioned in the figure panels.
Figure 8.
Figure 8.. ML265 treatment reduces atherosclerosis.
Female Ldlr−/− mice were randomized to receive either vehicle or ML265 (50 mg/kg) orally daily and placed on the Western diet for 14 weeks, starting at 8 weeks of age. A, Left panels show representative photomicrographs, and right panels show quantification of en face lesion area in the whole aortae (n=10, 10). B, Left panels show representative photomicrographs and right panels show quantification of cross-sectional lesion area in aortic sinuses (n=10, 10). Scale bar, 500 μm. C, Quantification of pro-inflammatory cytokines in plasma (n=5, 5). D, In a subset of Ldlr−/− mice that received either vehicle (n=6) or ML265 (n=6) and fed a Western diet for 14 weeks, wild-type CFDA-SE labeled thymocytes (green) were injected 2 hours prior to harvesting elicited peritoneal macrophages. Harvested cells were labeled with CMTPX (red), and percent efferocytosis was quantified as the number of macrophages with engulfed apoptotic cells as a percentage of total macrophages. Scale bar, 20μM. E, Elicited macrophages were isolated from a vehicle and ML265-treated mice fed a WTD for 14 weeks. Cells (100,000 per well) were plated and treated for 30 minutes in seahorse media. The curve shows glycolytic proton efflux rate (glycoPER). F, The basal and compensatory glycoPER rate derived from E (n=5, 5). Results were presented with mean ± SEM. Statistical analysis as indicated in the figure panels.

References

    1. Zernecke A, Winkels H, Cochain C, Williams JW, Wolf D, Soehnlein O, Robbins CS, Monaco C, Park I, McNamara CA, Binder CJ, Cybulsky MI, Scipione CA, Hedrick CC, Galkina EV, Kyaw T, Ghosheh Y, Dinh HQ, Ley K. Meta-analysis of leukocyte diversity in atherosclerotic mouse aortas. Circ Res. 2020;127:402–426 - PMC - PubMed
    1. Brophy ML, Dong Y, Tao H, Yancey PG, Song K, Zhang K, Wen A, Wu H, Lee Y, Malovichko MV, Sithu SD, Wong S, Yu L, Kocher O, Bischoff J, Srivastava S, Linton MF, Ley K, Chen H. Myeloid-specific deletion of epsins 1 and 2 reduces atherosclerosis by preventing lrp-1 downregulation. Circ Res. 2019;124:e6–e19 - PMC - PubMed
    1. Voll RE, Herrmann M, Roth EA, Stach C, Kalden JR, Girkontaite I. Immunosuppressive effects of apoptotic cells. Nature. 1997;390:350–351 - PubMed
    1. Overton CD, Yancey PG, Major AS, Linton MF, Fazio S. Deletion of macrophage ldl receptor-related protein increases atherogenesis in the mouse. Circ Res. 2007;100:670–677 - PubMed
    1. Yancey PG, Blakemore J, Ding L, Fan D, Overton CD, Zhang Y, Linton MF, Fazio S. Macrophage lrp-1 controls plaque cellularity by regulating efferocytosis and akt activation. Arterioscler Thromb Vasc Biol. 2010;30:787–795 - PMC - PubMed

Publication types