. 2022;18(2):154-172.
doi: 10.1080/15502724.2021.1890115. Epub 2021 Apr 28.

Evaluating the Visibility of Architectural Features for People with Low Vision -A Quantitative Approach

Affiliations

Evaluating the Visibility of Architectural Features for People with Low Vision -A Quantitative Approach

William B Thompson et al. Leukos. 2022.

Abstract

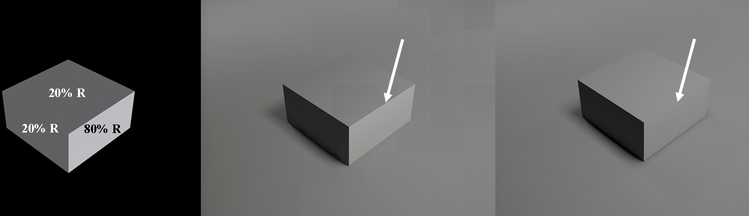
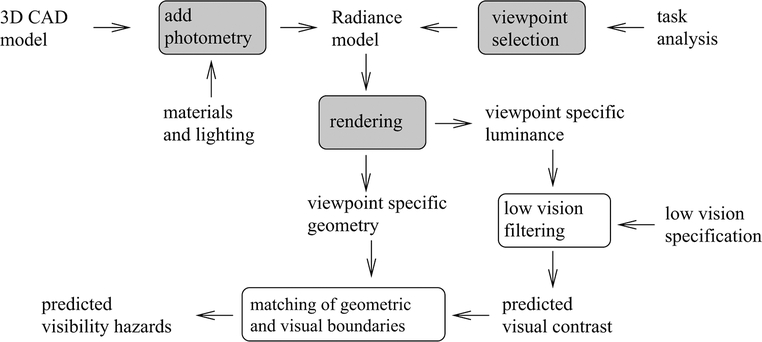
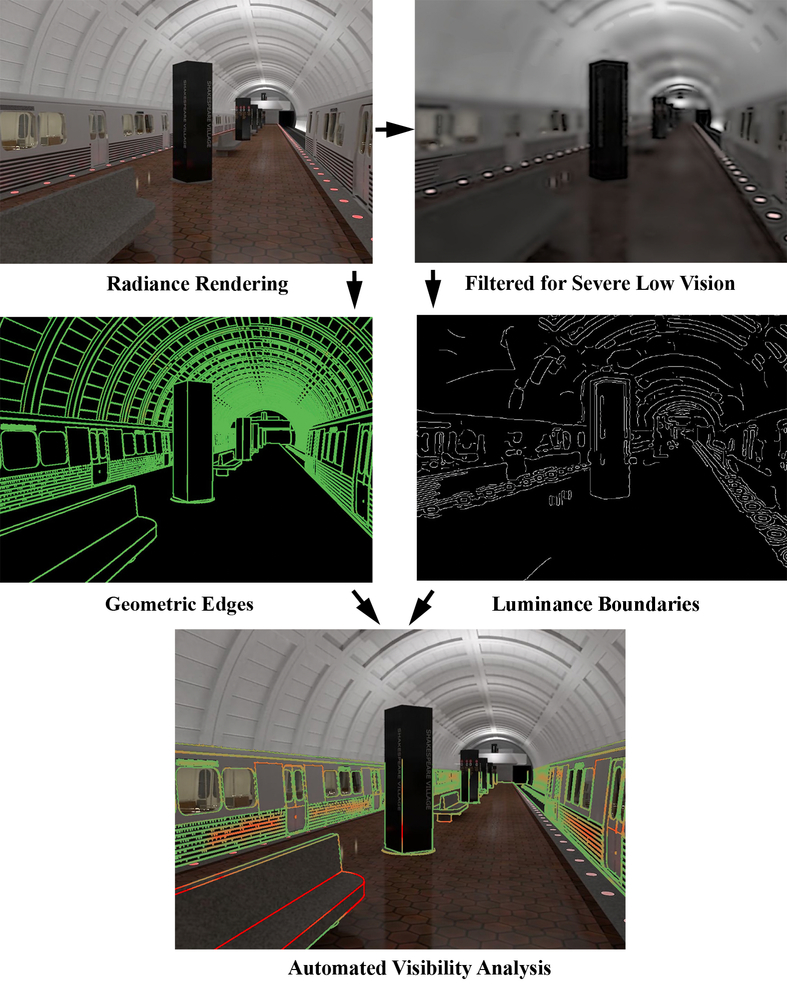
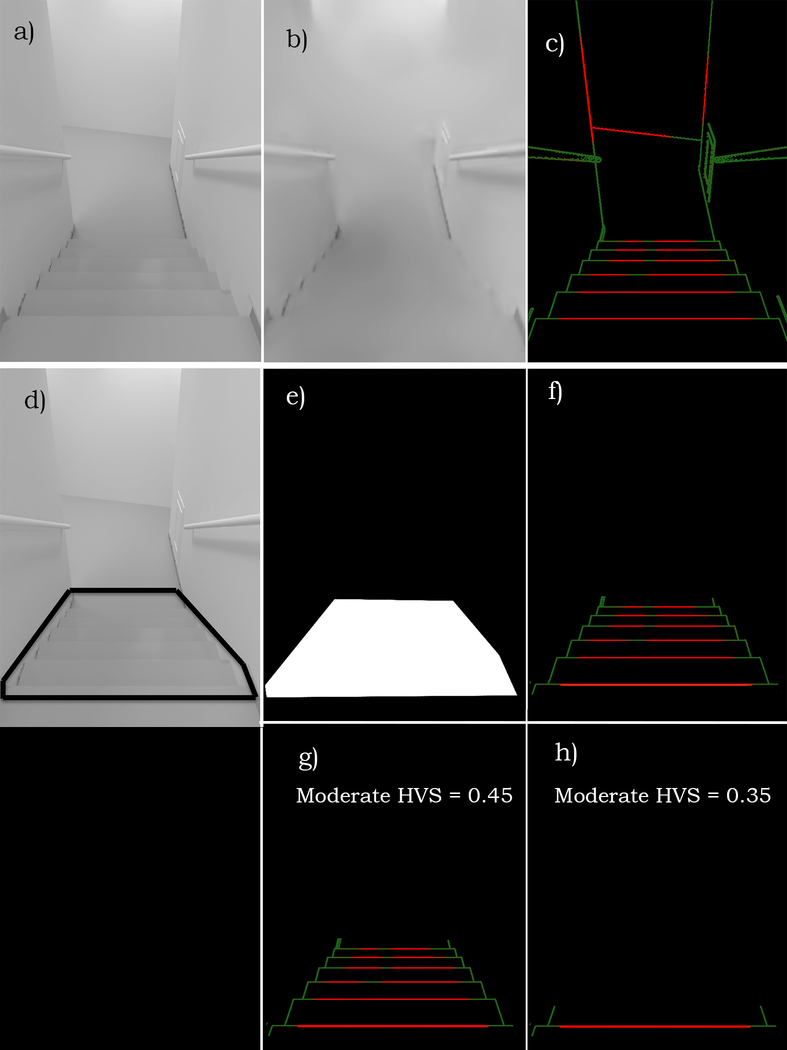
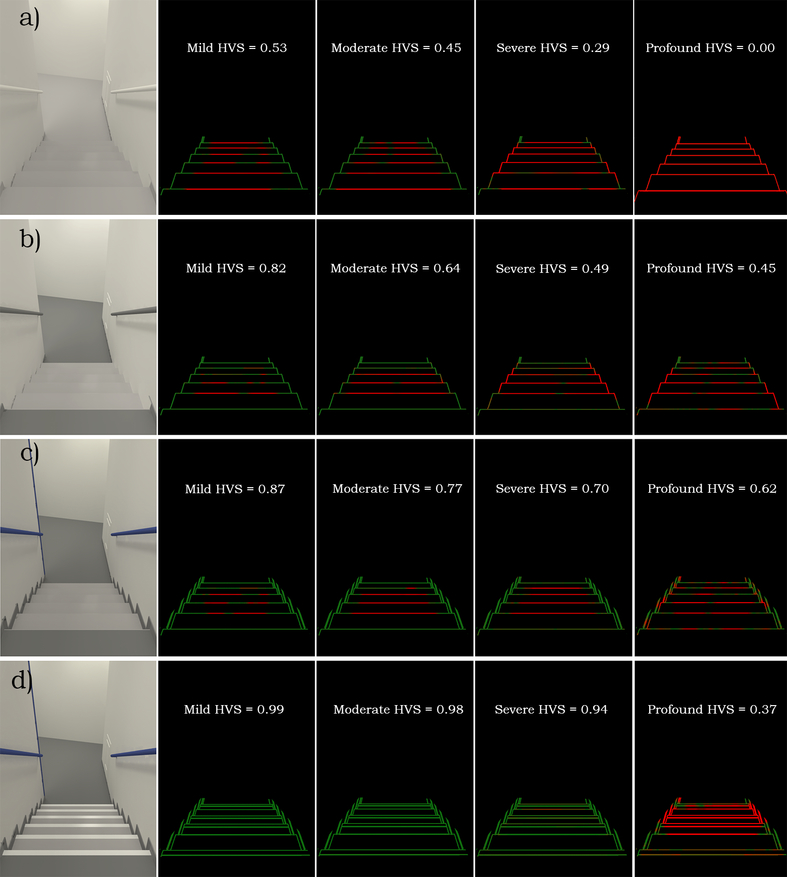
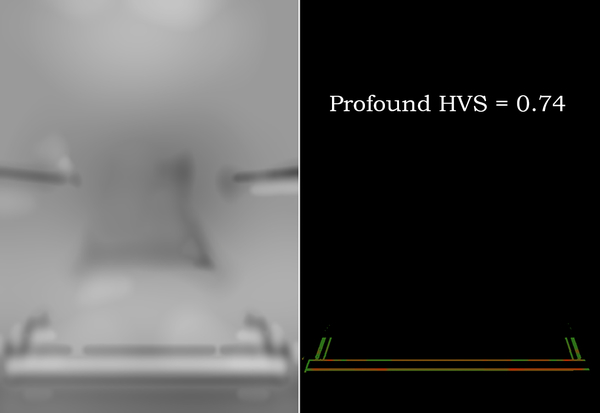
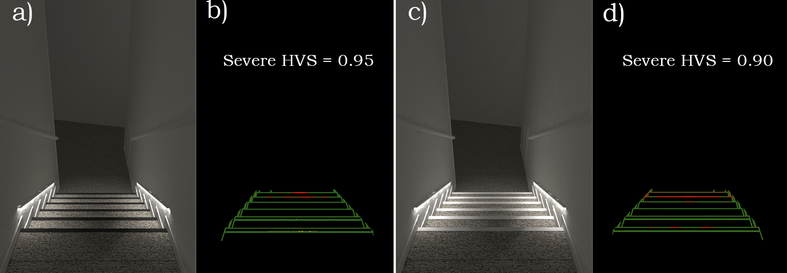
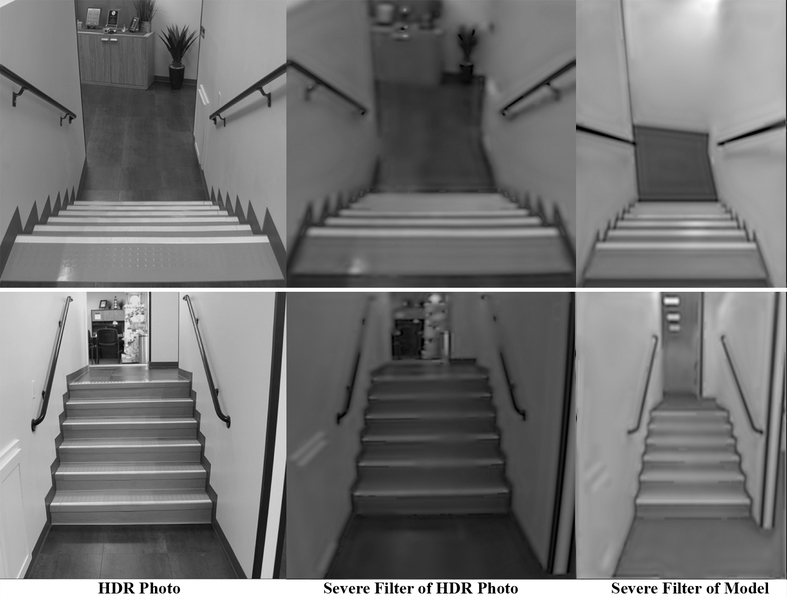
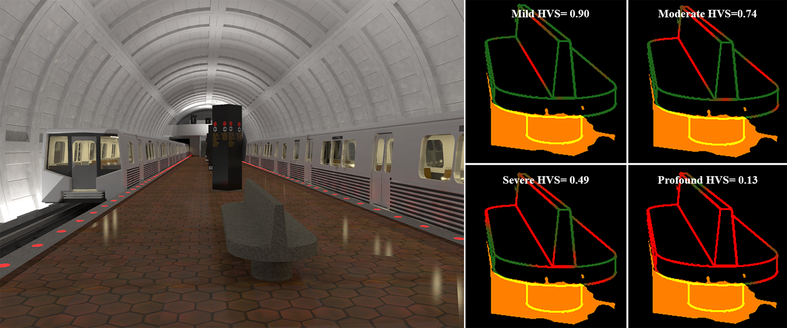
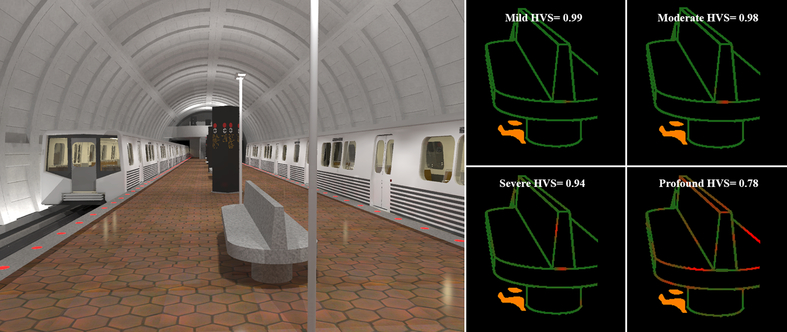
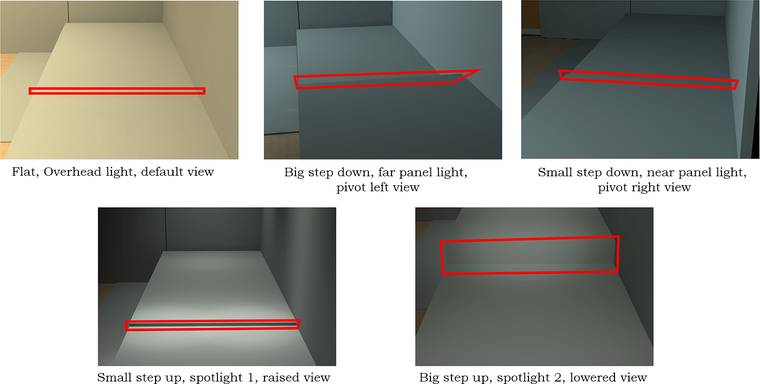
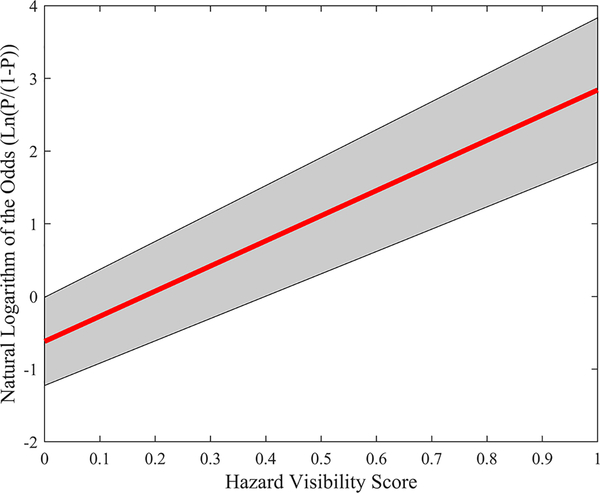
Most people with low vision rely on their remaining functional vision for mobility. Our goal is to provide tools to help design architectural spaces in which safe and effective mobility is possible by those with low vision---spaces that we refer to as visually accessible. We describe an approach that starts with a 3D CAD model of a planned space and produces labeled images indicating whether or not structures that are potential mobility hazards are visible at a particular level of low vision. There are two main parts to the analysis. The first, previously described, represents low-vision status by filtering a calibrated luminance image generated from the CAD model and associated lighting and materials information to produce a new image with unseen detail removed. The second part, described in this paper, uses both these filtered images and information about the geometry of the space obtained from the CAD model and related lighting and surface material specifications to produce a quantitative estimate of the likelihood of particular hazards being visible. We provide examples of the workflow required, a discussion of the novelty and implications of the approach, and a short discussion of needed future work.

Keywords: accessibility; architecture; lighting; low vision; mobility; universal design; visual acuity.


Figures

Figure 1.
Figure 1.
Illumination and reflectivity alone are not enough to predict visibility. Two surfaces under the same illumination but differing in reflectance by a factor of 4X can look the same.
Figure 2.
Figure 2.
Components of the analysis process. The discovery of hazards to low vision mobility requires many disparate processing steps.
Figure 3.
Figure 3.
A graphical representation of the processing steps.
Figure 4.
Figure 4.
Analysing low-vision visibility from a design model (a) An HDR computer graphics image of a stairway in the Lighthouse building, modelled with REVIT and rendered with RADIANCE. (b) The original image, filtered to simulate the visibility under moderate low vision. (c) The results of an automated visibility analysis, with red lines indicate geometric structure predicted to not be visible and the green lines indicate geometry predicted to be perceivable. (d) The designer can indicate the boundaries of a portion of the image of particular concern (a region-of-interest (ROI)), which limits where the analysis is performed. (e) Confirmation of the image pixels making up the ROI. (f) Finally, a visualized analysis of the location of mobility hazards, which might be missed if only reviewing the specified conditions of acuity and contrast sensitivity shown in figure b. We show below how to compute a numerical Hazard Visibility Score (HVS) that significantly aids in using this process to choose the optimal design option for the staircase and first step edge (g and h).
Figure 5.
Figure 5.
The computed HVS of the same portion of the stairway for four low vision settings. (a) Base level (same model as Figure 4). (b) Upper and lower floor surfaces made darker than (a). (c) Adding dark baseboards along the sides. (d) Adding a white tread grip strip.
Figure 6.
Figure 6.
Limiting HVS computation to the leading edge of the step.
Figure 7.
Figure 7.
Adding night-time lighting and carpet flooring.
Figure 8.
Figure 8.
Real stairway (left), photograph of real stairway filtered to simulate severe low vision (center), rendered image of stairway filtered to simulate severe low vision (right).
Figure 9.
Figure 9.
“As is” rendering of subway station with visibility analysis.
Figure 10.
Figure 10.
Subway station with exploratory lighting and material changes.
Figure 11.
Figure 11.
Five sample images from the stimulus set representing five variations in each design attribute: geometry (flat, large step down, small step down, small step up, large step up), lighting (overhead, far panel, near panel, spotlight 1 and 2), and viewpoint (default, pivot left, pivot right, raised, lowered). The ROI, outlined by a box in each panel, extended 0.5 degrees in visual angle around the step vertices. In the figure, the lines of the box marking ROI boundaries were thickened for clarity.
Figure 12.
Figure 12.
Visualization of logistic regression model fitted with aggregated data from ten low-vision subjects. The figure plots odds (Ln(P/(1-P)) against HVS. The central line is the fitted regression line, while the gray area marks the confidence interval.

References

    1. [ANSI-IES] American National Standards Institute / Illuminating Engineering Society. 2018. Recommended Practice for Design and Maintenance of Roadway and Parking Facility Lighting. New York (NY): Illuminating Engineering Society.
    1. [ANSI/IES] American National Standards Institute / Illuminating Engineering Society. 2016. ANSI/IES RP-28–16. Lighting and the visual environment for seniors and the low vision population. NEW YORK (NY): The Illuminating Engineering Society. 128 p.
    1. Barrow HG, Tenenbaum JM, Bolles RC, Wolf HC. 1977. Parametric correspondence and chamfer matching: two new techniques for image matching. IJCAI’77 Proc 5th Joint Conf Artif Intel (2) 659–663.
    1. Bourne RRA, et al. Magnitude, temporal trends, and projections of the global prevalence of blindness and distance and near vision impairment: a systematic review and meta-analysis. 2017. Lancet Glob Health. 5(9): PE888–E897. - PubMed
    1. Campbell FW, Robson JG.1968. Application of Fourier analysis to the visibility of gratings. J of Physiol 197(3):551–566. - PMC - PubMed

LinkOut - more resources