. 2022 Mar 24:16:812223.
doi: 10.3389/fnins.2022.812223. eCollection 2022.

Restricted Proliferation During Neurogenesis Contributes to Regionalisation of the Amphioxus Nervous System

Affiliations

Restricted Proliferation During Neurogenesis Contributes to Regionalisation of the Amphioxus Nervous System

Giacomo Gattoni et al. Front Neurosci. .

Abstract

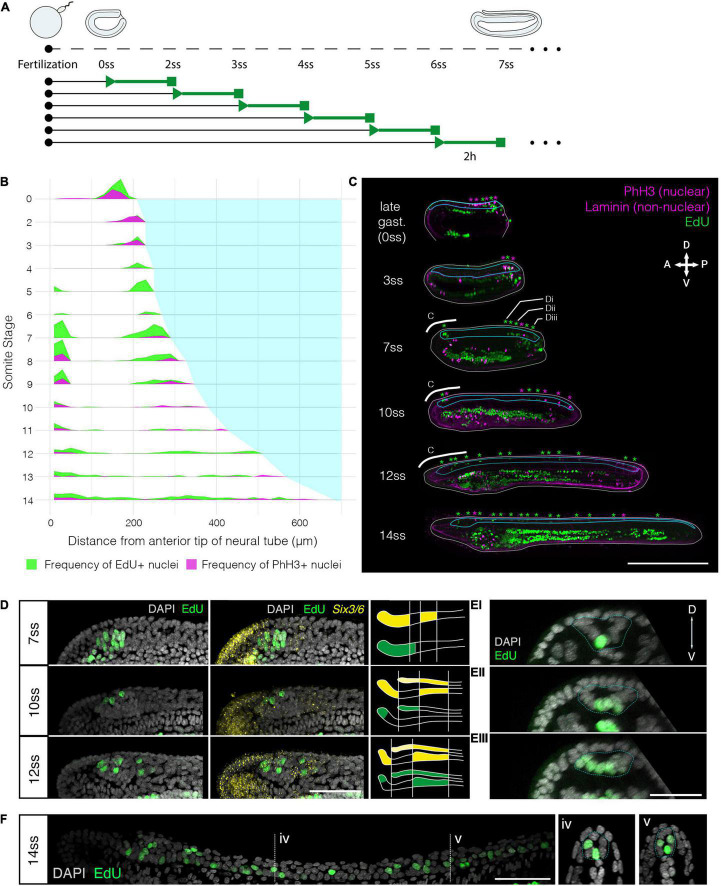
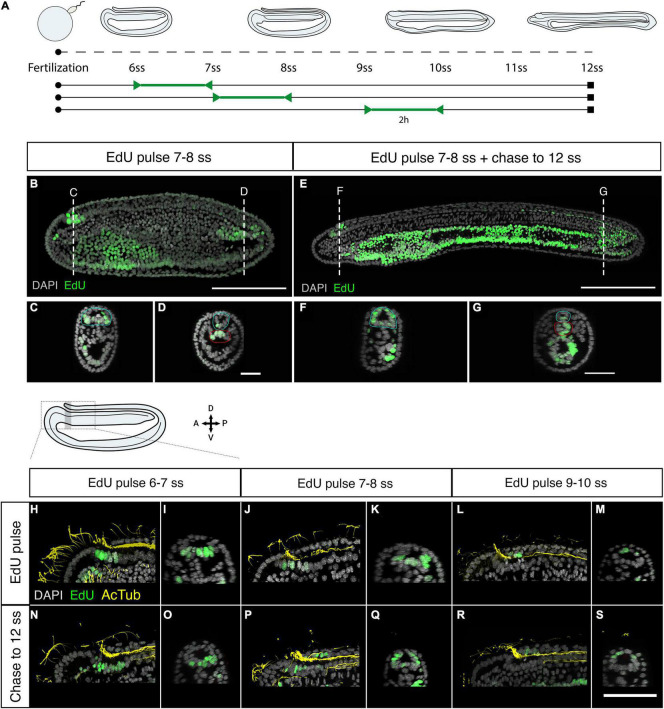
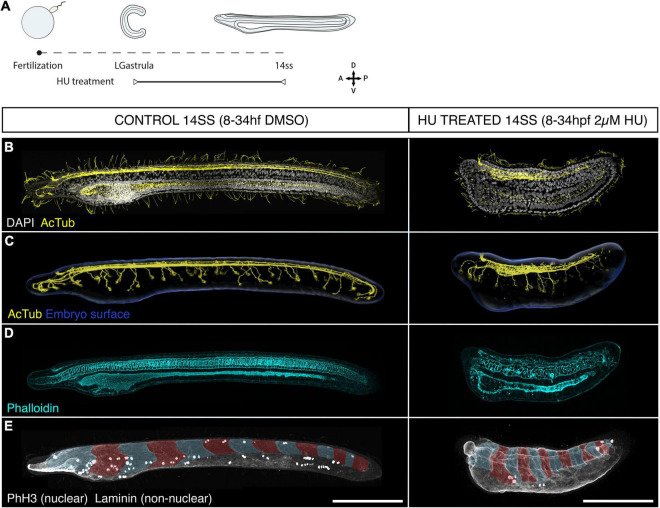
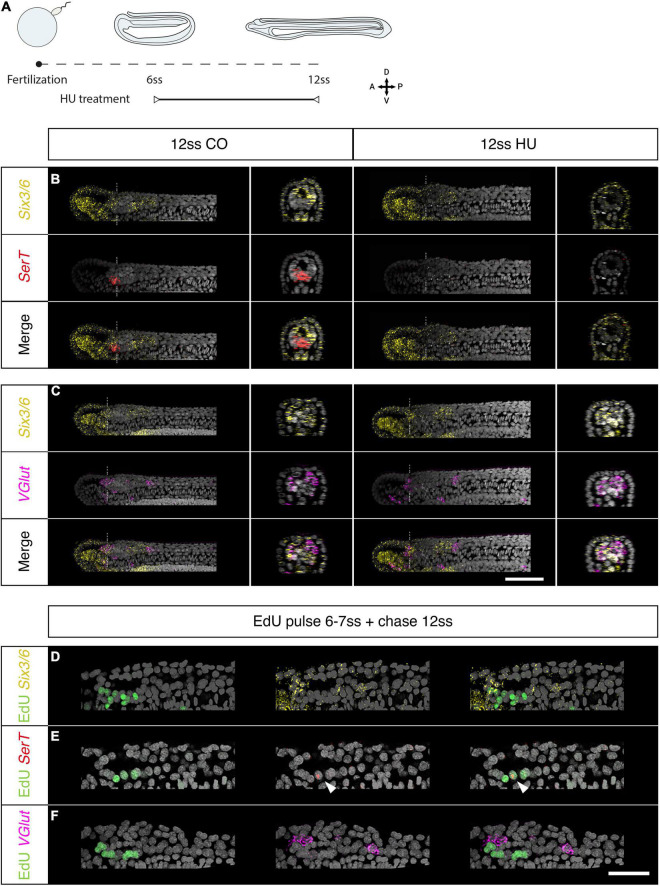
The central nervous system of the cephalochordate amphioxus consists of a dorsal neural tube with an anterior brain. Two decades of gene expression analyses in developing amphioxus embryos have shown that, despite apparent morphological simplicity, the amphioxus neural tube is highly regionalised at the molecular level. However, little is known about the morphogenetic mechanisms regulating the spatiotemporal emergence of cell types at distinct sites of the neural axis and how their arrangements contribute to the overall neural architecture. In vertebrates, proliferation is key to provide appropriate cell numbers of specific types to particular areas of the nervous system as development proceeds, but in amphioxus proliferation has never been studied at this level of detail, nor in the specific context of neurogenesis. Here, we describe the dynamics of cell division during the formation of the central nervous system in amphioxus embryos, and identify specific regions of the nervous system that depend on proliferation of neuronal precursors at precise time-points for their maturation. By labelling proliferating cells in vivo at specific time points in development, and inhibiting cell division during neurulation, we demonstrate that localised proliferation in the anterior cerebral vesicle is required to establish the full cell type repertoire of the frontal eye complex and the putative hypothalamic region of the amphioxus brain, while posterior proliferating progenitors, which were found here to derive from the dorsal lip of the blastopore, contribute to elongation of the caudal floor plate. Between these proliferative domains, we find that trunk nervous system differentiation is independent from cell division, in which proliferation decreases during neurulation and resumes at the early larval stage. Taken together, our results highlight the importance of proliferation as a tightly controlled mechanism for shaping and regionalising the amphioxus neural axis during development, by addition of new cells fated to particular types, or by influencing tissue geometry.

Keywords: EdU pulse-chase; HCR; amphioxus; axial progenitors; brain development; chordate evolution; neurogenesis; proliferation.


Conflict of interest statement

The authors declare that the research was conducted in the absence of any commercial or financial relationships that could be construed as a potential conflict of interest.

Figures

FIGURE 1
FIGURE 1
Cell division restricts to two polarised mitotic domains during neural tube morphogenesis. (A) Experimental design of EdU pulses experiments. Two hour EdU pulses are represented in green, while squares indicate time of fixation. The same approach was taken every 2 h for embryos up to the 14 ss stage. (B) Proliferation landscape for the neural tube, showing mean frequency of EdU-positive (EdU exposure for 2-h before fixation) and PhH3-positive nuclei in 20 μm bins of the anteroposterior axis at successive somite stages. “0-somite stage” refers to late gastrula 2-h before onset of somitogenesis. n = 114 embryos. (C) Mid-sagittal sections for representative embryos included in panel (A), showing distribution of EdU-positive and PhH3-positive nuclei in each tissue of the body axis, which are delineated by laminin immunostaining. White lines outline the whole embryo, light blue lines outline the neural tube. Asterisks mark location of EdU/PhH3-positive nuclei using the same colour code. Scale bar is 150 μm. (D) Lateral z-projections of the cerebral vesicle at 7, 10, and 12 somite stages, at the level indicated by thick white lines in panel (C), showing EdU incorporation and co-localisation with Six3/6, using HCR in situ hybridisation. Scale bar is 50 μm. Brain patterns are schematically represented and summarised on the right side of the panel in the same colour code. (E) Serial transverse sections through a 7-somite stage embryo at the posterior positions illustrated in panels (C,Ei–iii), showing the EdU detection profile. Neural tube is outlined with a dashed blue line. Scale bar is 30 μm. (F) Lateral projection of 14-somite stage embryo, with representative transverse sections at the indicated positions: iv and v, where the neural tube is outlined with a light blue dashed line. Scale bar is 50 μm.
FIGURE 2
FIGURE 2
Fate of proliferating cells tracked using EdU-pulse chases. (A) Experimental design of Edu pulse-chase experiments. Two-hour EdU pulses are represented in green, after which embryos were raised (chase) to 12 ss and then fixed (square). (B) Detection of EdU-pulse between 7–8 ss with cross section details shown for the anterior (C), and the posterior (D) neural proliferative domains. (E) Chase of an embryo pulsed at 7–8 ss, as shown in panel (B), to 12 ss revealing that while anterior EdU-positive cells remain in the brain (F) posterior positive cells spread through one-third of the posterior floor plate (G). In cross sections the blue circle highlights the neural tissue while the red circle defines the chordoneural hinge (D) and the notochord (G). Scale bar is 100 μm for lateral views and 30 μm for cross-sections. (H,I) EdU pulses at 6–7 ss marked ventral brain cells, as shown in lateral (H) and sagittal (I) planes, which remained ventral in the cerebral vesicle of 12 ss embryos, as shown in lateral (N) and sagittal (O) planes of the brain. (J–M) At later stages lateral and dorsal proliferating cells in the brain, as shown by Edu pulses between 7–8 ss [Panel (J): lateral plane; (K) sagittal plane] and 9–10 ss [Panel (L): lateral plane; (M) sagittal plane] contributed to progressively dorsal cell populations, as shown in embryos at 12 ss in lateral (P,R) and sagittal (Q,S) planes. EdU in green, acetylated tubulin in yellow. Scale bar is 50 μm.
FIGURE 3
FIGURE 3
Cell division is dispensable for body plan patterning but required for establishing a normal geometry. (A) Experimental design of hydroxyurea (HU) treatments. (B–E) Control embryos (treated with DMSO) and embryos treated with 2 μM HU are shown side by side in lateral z-projections. (B) The general morphology of these embryos is shown through immunostaining with acetylated tubulin (cilia and axonal scaffold) and DAPI (nuclei). (C) The structure of the axonal scaffold is shown by segmentation of the acetilated tubulin channel from embryos in panel (A). (D) Phalloidin (actin) staining in the same embryos reveals the presence of a notochord and a ventral endoderm. (E) Immunostaining with laminin and PhH3 reveals the presence of an equal number of somites in both control and treated embryos (false-colouredin blue and read overlay), and the efficacy of the treatment to arrest proliferation, which results in a significant loss of PHH3-positive nuclei in HU-treated embryos. Scale bars are 150 μm for both control and treated embryos. HU-treated phenotype representative of n = 13 embryos imaged.
FIGURE 4
FIGURE 4
Brain proliferation is required to establish the neuronal type repertoire in the amphioxus larva. (A–C) Expression of neurotransmitter markers in control and Hydroxyurea (HU)-treated embryos at 12 ss through HCR. (A) Experimental design of HU treatments. (B) SerT expression in control embryos is localised at the border of the anterior Six3/6 domain but disappears following HU treatment. (C) In the neural tube, VGlut is expressed in anterior-most cells within the anterior Six3/6 domain and caudal to the posterior Six3/6 domain. This pattern remains the same in HU-treated embryos. Scalebar is 50 μm. (D–F) Brain expression of neurotransmitter markers in embryos pulsed with EdU at 6–7 ss and chased to 12 ss. (D) EdU is detected in a few cells within the anterior Six3/6 domain. (E) SerT-positive neurons are labelled with EdU. (F) VGlut expression is not detected in EdU-positive cells. Scalebar is 30 μm. Six3/6 in yellow, SerT in red, VGlut in magenta, EdU in green.
FIGURE 5
FIGURE 5
Otp expression and brain proliferation during neurulation. (A) Co-detection of Otp and Six3/6 expression through HCR in situ hybridisation and EdU incorporation. (Ai) At 7 ss Otp is expressed in five clusters of cells in the trunk region (asterisks). Expression is strong in the posterior three clusters but very low in the anterior two clusters (asterisk in insets). (Aii) At 10 ss, a pair of Otp positive neurons appear in the posterior Six3/6 domain of cerebral vesicle (arrowhead in insets), but proliferation is still restricted to the anterior cerebral vesicle. (Aiii) At 12 ss two ventro-lateral clusters of Otp-positive cells are visible in the anterior cerebral vesicle. At this stage, cell division starts in the posterior cerebral vesicle; the posterior Otp-positive pair is not proliferating but cells adjacent to them are labelled by EdU (insets). (Aiv) At 14 ss, the number of posterior Otp-positive neurons increases (arrowhead). Asterisks in all insets show the first Otp cluster in the trunk. Patterns of Six3/6 and Otp co-expression are schematically representated at the bottom of each panel for every developmental stage. Scale bar is 50 μm; 20 μm for insets. (B–G) Cross section of 12 and 14 ss embryos showing the anterior ventro-lateral (B,D), posterior medial (C,E), and trunk (F,G) Otp cells. Scalebar: 20 μm (H) 12 ss embryos EdU-pulsed at 7 ss show co-localization of EdU and Otp (arrowheads) at the level of D in panel (Aiv). (I) Inhibition of cell division with 2 μM hydroxyurea leads to a loss of the ventro-lateral Otp clusters in the Six3/6-negative domain, while the posterior medial Otp cells are not affected. Scale bar is 50 μm. EdU in magenta, Six3/6 in yellow, Otp in green.
FIGURE 6
FIGURE 6
Axial progenitor fates are spatially regionalised across the late blastopore lip. (A–C) Distribution of EdU- and PhH3-positive nuclei after an EdU pulse between 10 and 12 hpf, shown in orthogonal coronal (A), sagittal (B), and transverse sections (C) intersecting at the level of the blastopore (as indicated by the yellow lines). Scale bars are 30 μm. (D–F) Distribution of EdU-positive nuclei after an EdU pulse between 12 and 14 hpf, shown in a coronal (D), sagittal (E), and transverse sections (F) intersecting at the level of the blastopore (as indicated by the yellow lines). Compass shows orientation of each plane in panels (A–F). (G) Maximum projection through the blastopore in an embryo pulsed with EdU between 10 and 12 hpf, as shown in panel (C), marking proliferative cells in the dorsal and upper-lateral lips. (H) Maximum projection through the sagittal midline of an embryo EdU pulsed at 10–12 hpf, as shown in panel (G), showing contribution of EdU-positive cells in the dorsal blastopore lip to neural tube, notochord and somites. (I) Transverse section through posterior body of embryo shown in panel (H), showing tissue-specificity of EdU-positive cells. (J) Maximum projection through the blastopore in an embryo pulsed with EdU 12–14 hpf, as shown in panel (F), showing proliferating cells in the ventral and lower-lateral lips. (K) Maximum projection through the sagittal midline of an embryo EdU pulsed at 12–14 hpf, as shown in panel (J), revealing the contribution of proliferating cells to the posterior somites. (L) Transverse section through posterior body of embryo shown in panel (K), showing tissue-specificity of EdU-positive cells. Scalebars are 50 μm. (M) Schematic of approach used to quantify EdU labelling in pulse-chased specimens as a frequency curve across normalised AP length, following quantification in 10 evenly-sized bins. (N) Stacked area graphs for each pulse-chase condition and tissue. n = 6 embryos per condition. EdU in green, PhH3 (nuclear) and laminin in magenta, acetylated tubulin in red. fp, floor plate; s, somites; n, notochord; ve, ventral endoderm.
FIGURE 7
FIGURE 7
Contributions of cell proliferation to nervous system and axial development. During neurulation, cell division is restricted to the anterior and posterior poles of the neural plate. (A) Anteriorly, the brain develops following a ventral to dorsal proliferative gradient. Ventral proliferation is required to specify Row2 serotonergic neurons of the frontal eye and hypothalamic-like Otp-positive neurons. (B) Posteriorly, early proliferating cells in the dorsal blastoporal region contribute to the floor plate, notochord, and somites, while progenitors in the ventral and lateral regions of the blastopore divide later and are incorporated into the posterior somites.

Similar articles

Cited by

References

    1. Albuixech-Crespo B., López-Blanch L., Burguera D., Maeso I., Sánchez-Arrones L., Moreno-Bravo J. A., et al. (2017). Molecular regionalization of the developing amphioxus neural tube challenges major partitions of the vertebrate. brain. PLoS Biol. 15:e2001573. 10.1371/journal.pbio.2001573 - DOI - PMC - PubMed
    1. Allaway K. C., Muñoz W., Tremblay R., Sherer M., Herron J., Rudy B., et al. (2020). Cellular birthdate predicts laminar and regional cholinergic projection topography in the forebrain. Elife 9:e63249. 10.7554/ELIFE.63249 - DOI - PMC - PubMed
    1. Ando H., Sato T., Ito T., Yamamoto J., Sakamoto S., Nitta N., et al. (2019). Cereblon control of zebrafish brain size by regulation of neural stem cell proliferation. iScience 15 95–108. 10.1016/j.isci.2019.04.007 - DOI - PMC - PubMed
    1. Andrews T. G., Gattoni G., Busby L., Schwimmer M. A., Benito-Gutiérrez È. (2020). “Hybridization chain reaction for quantitative and multiplex imaging of gene expression in amphioxus embryos and adult tissues,” in In Situ Hybridization Protocols, eds Nielsen B. S., Jones J. (Berlin: Springer Nature; ), 179–194. 10.1007/978-1-0716-0623-0 - DOI - PMC - PubMed
    1. Andrews T. G. R., Pönisch W., Paluch E., Steventon B. J., Benito-Gutiérrez È. (2021). Single-cell morphometrics reveals ancestral principles of notochord development. Development 148:dev199430. 10.1242/dev.199430 - DOI - PMC - PubMed

LinkOut - more resources