Review
. 2022 Mar 25:16:796129.
doi: 10.3389/fnins.2022.796129. eCollection 2022.

Imaging Synaptic Density: The Next Holy Grail of Neuroscience?

Affiliations
Review

Imaging Synaptic Density: The Next Holy Grail of Neuroscience?

Maria Elisa Serrano et al. Front Neurosci. .

Abstract

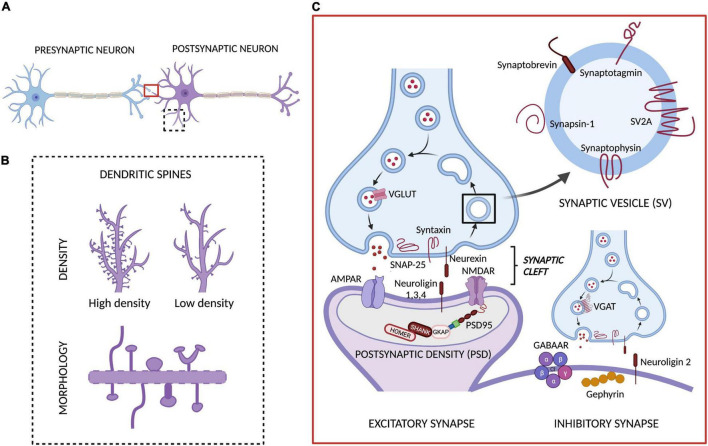
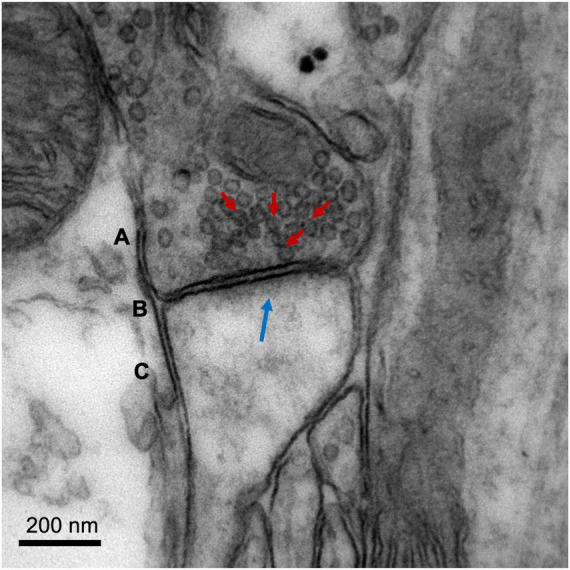
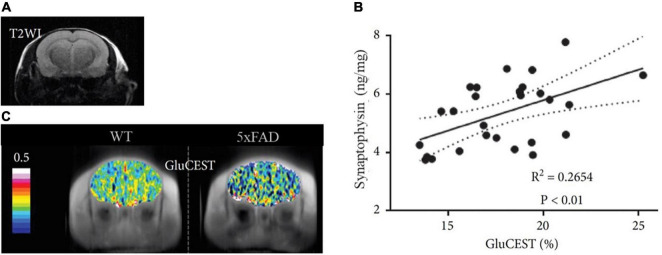
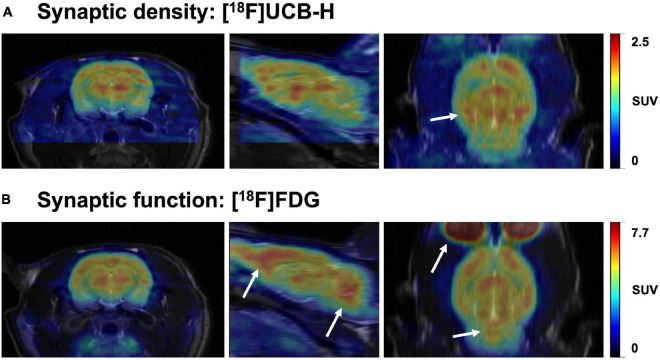
The brain is the central and most complex organ in the nervous system, comprising billions of neurons that constantly communicate through trillions of connections called synapses. Despite being formed mainly during prenatal and early postnatal development, synapses are continually refined and eliminated throughout life via complicated and hitherto incompletely understood mechanisms. Failure to correctly regulate the numbers and distribution of synapses has been associated with many neurological and psychiatric disorders, including autism, epilepsy, Alzheimer's disease, and schizophrenia. Therefore, measurements of brain synaptic density, as well as early detection of synaptic dysfunction, are essential for understanding normal and abnormal brain development. To date, multiple synaptic density markers have been proposed and investigated in experimental models of brain disorders. The majority of the gold standard methodologies (e.g., electron microscopy or immunohistochemistry) visualize synapses or measure changes in pre- and postsynaptic proteins ex vivo. However, the invasive nature of these classic methodologies precludes their use in living organisms. The recent development of positron emission tomography (PET) tracers [such as (18F)UCB-H or (11C)UCB-J] that bind to a putative synaptic density marker, the synaptic vesicle 2A (SV2A) protein, is heralding a likely paradigm shift in detecting synaptic alterations in patients. Despite their limited specificity, novel, non-invasive magnetic resonance (MR)-based methods also show promise in inferring synaptic information by linking to glutamate neurotransmission. Although promising, all these methods entail various advantages and limitations that must be addressed before becoming part of routine clinical practice. In this review, we summarize and discuss current ex vivo and in vivo methods of quantifying synaptic density, including an evaluation of their reliability and experimental utility. We conclude with a critical assessment of challenges that need to be overcome before successfully employing synaptic density biomarkers as diagnostic and/or prognostic tools in the study of neurological and neuropsychiatric disorders.

Keywords: GluCEST; PET; SV2A; electron microscopy; immunohistochemistry; synaptic density.


Conflict of interest statement

The authors declare that the research was conducted in the absence of any commercial or financial relationships that could be construed as a potential conflict of interest.

Figures

FIGURE 1
FIGURE 1
Chemical synapse and targets for measuring synaptic density. (A) The main components of the bipartite synapse: a presynaptic and a postsynaptic neuron, separated by a synaptic cleft. In this synapse we have highlighted the two main targets involved in the methods currently available to quantify or assess synaptic density levels: (B) the dendritic spines (whose density and morphology are typically evaluated with different ex vivo methods) and (C) the proteins involved in synaptic transmission, including synaptic vesicle (SV), presynaptic and postsynaptic proteins present in excitatory and inhibitory synapses (which are quantified through ex vivo and in vivo methods). Adapted from “Synaptic Cleft (Horizontal),” by BioRender.com (2021). Retrieved from https://app.biorender.com/biorender-templates.
FIGURE 2
FIGURE 2
Image of a cortical glutamatergic synapse of an adult C57BL/6 mouse. The image was obtained on a Jeol 1010 transmission electron microscope (Jeol, Tokyo, Japan) at 80,000× magnification. (A) Presynaptic neuron, with synaptic vesicles indicated with red arrows. (B) Synaptic cleft. (C) Dendritic spine of a postsynaptic neuron, with postsynaptic density (electron-dense zone juxtaposed to the postsynaptic membrane) indicated with a blue arrow. Image courtesy of Nuria García Font, see García-Font et al. (2019) for more information about the methodology.
FIGURE 3
FIGURE 3
Representative hippocampal labeling of the synaptic vesicle protein synaptotagmin-1 in a control (A) and (B) epilepsy [kainic acid rat model of temporal lobe epilepsy (Levesque and Avoli, 2013)]. Both images were obtained using the polyclonal rabbit anti-Syt1 (Abcam, Cambridge, MA; Cat#ab131551); dilution 1:100 (overnight, 4°C). The secondary antibody was donkey anti-Rabbit Alexa Fluor488-conjugated (Thermo Fisher Scientific, Oregon, United States; Cat#A-21206); dilution 1:500 (45 min, RT). DAPI was used to counterstain (blue). The images were obtained with a scanning laser microscope (Leica TCS SP5 with AOBS, Leica Microsystems IR GmbH, Germany) with a 20 × magnification and similar exposure time. Note a decrease in synaptotagmin-1 labeling in the epileptic rat (3 months after kainic acid administration), compared to the control. Images were obtained at GIGA-CRC in vivo imaging and the GIGA-Imaging platform, ULiège (Belgium).
FIGURE 4
FIGURE 4
SV2A autoradiography with [3H]UCB-J, performed in an adult C57BL/6 mouse. (A,B) Two representative autoradiographs showing [3H]UCB-J labeling. (C) 3H standard for quantification (ART-123A American Radiolabeled Chemicals Inc., United States). Slices (20 μm) were mounted onto a glass slide (Superfrost™) and incubated with 3 nM [3H]UCB-J (Novandi Chemistry AB, Sweden). Once dried, the slide was placed into light-tight cassettes with the radioactive standard slide and a hyperfilm (Amersham 8 × 10 in Hyperfilm Scientific Laboratory Supplies, United Kingdom). Films were exposed for 2 weeks before being developed in a Protex Ecomax film developer (Protec GmbH & Co, Germany). Images acquired at BRAIN Centre, King’s College London, London, United Kingdom.
FIGURE 5
FIGURE 5
Representative images of GluCEST MRI of a 5xFAD and a WT mouse. (A) Structural T2-weighted image (T2WI) in the coronal plane. (B) GluCEST maps of the corresponding T2WI showing reduced GluCEST effects in an aged (7-month old) 5xFAD mouse compared with the WT. (C) Correlation between GluCEST and Synaptophysin concentration. Figure extracted and modified from Igarashi et al. (2020).
FIGURE 6
FIGURE 6
Representative brain images comparing synaptic density and function in the same rat. The images represent the uptake of two radiotracers: (A) [18F]UCB-H (concentration of SV2A protein, synaptic density marker) and (B) [18F]FDG (glucose metabolism, synaptic function marker). Both images were acquired 40-60 min after intravenous radiotracer injection (36 and 20 MBq, respectively). Scans were performed 24h apart, followed by a T2-weighted MR image to allow a better comparison between both PET scans through manual rigid-body co-registration with PMOD software. The white arrows represent the main differences in uptake between both radiotracers. While synaptic density and function are similar in multiple brain areas, regions such as the prefrontal cortex and cerebellum seem to have relatively higher glucose metabolism (synaptic function) than concentration of SV2A (synaptic density). Images obtained at GIGA-CRC in vivo imaging, ULiège (Belgium).

Similar articles

Cited by

References

    1. Acton P. D., Zhuang H., Alavi A. (2004). Quantification in PET. Radiol. Clin. North Am. 42 1055–1062. 10.1016/j.rcl.2004.08.010 - DOI - PubMed
    1. Aksenov D. P., Li L., Miller M. J., Iordanescu G., Wyrwicz A. M. (2015). Effects of anesthesia on BOLD signal and neuronal activity in the somatosensory cortex. J. Cerebral Blood Flow Metab. 35 1819–1826. 10.1038/jcbfm.2015.130 - DOI - PMC - PubMed
    1. Ali F., Gerhard D. M., Sweasy K., Pothula S., Pittenger C., Duman R. S., et al. (2020). Ketamine disinhibits dendrites and enhances calcium signals in prefrontal dendritic spines. Nat. Commun. 11:72. 10.1038/s41467-019-13809-8 - DOI - PMC - PubMed
    1. Antonucci F., Corradini I., Fossati G., Tomasoni R., Menna E., Matteoli M. (2016). SNAP-25, a known presynaptic protein with emerging postsynaptic functions. Front. Syn. Neurosci. 8:e07. 10.3389/fnsyn.2016.00007 - DOI - PMC - PubMed
    1. Ayberk Kurt M., Ilker Kafa M., Dierssen M., Ceri Davies D. (2004). Deficits of neuronal density in CA1 and synaptic density in the dentate gyrus, CA3 and CA1, in a mouse model of Down syndrome. Brain Res. 1022, 101–109. 10.1016/j.brainres.2004.06.075 - DOI - PubMed

LinkOut - more resources