. 2022 Mar 25:16:816814.
doi: 10.3389/fncel.2022.816814. eCollection 2022.

Identification of Neuronal Cells in Sciatic Nerves of Adult Rats

Affiliations

Identification of Neuronal Cells in Sciatic Nerves of Adult Rats

Yisheng Liu et al. Front Cell Neurosci. .

Abstract

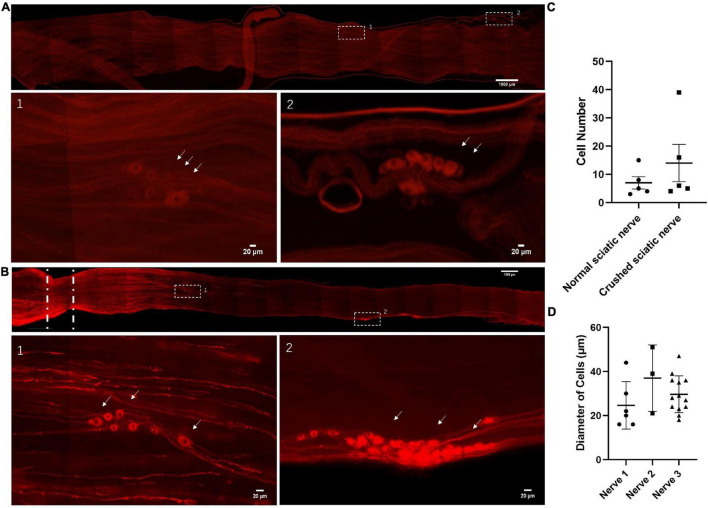
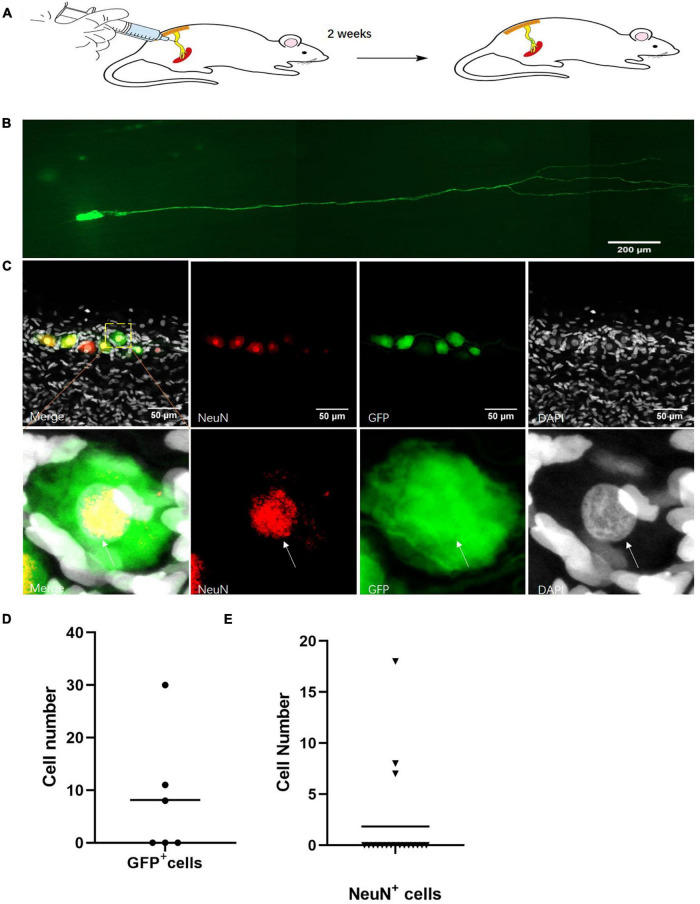
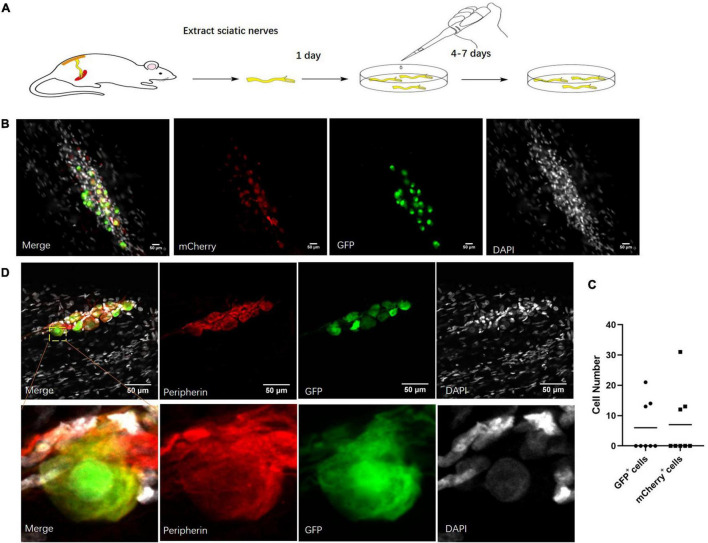
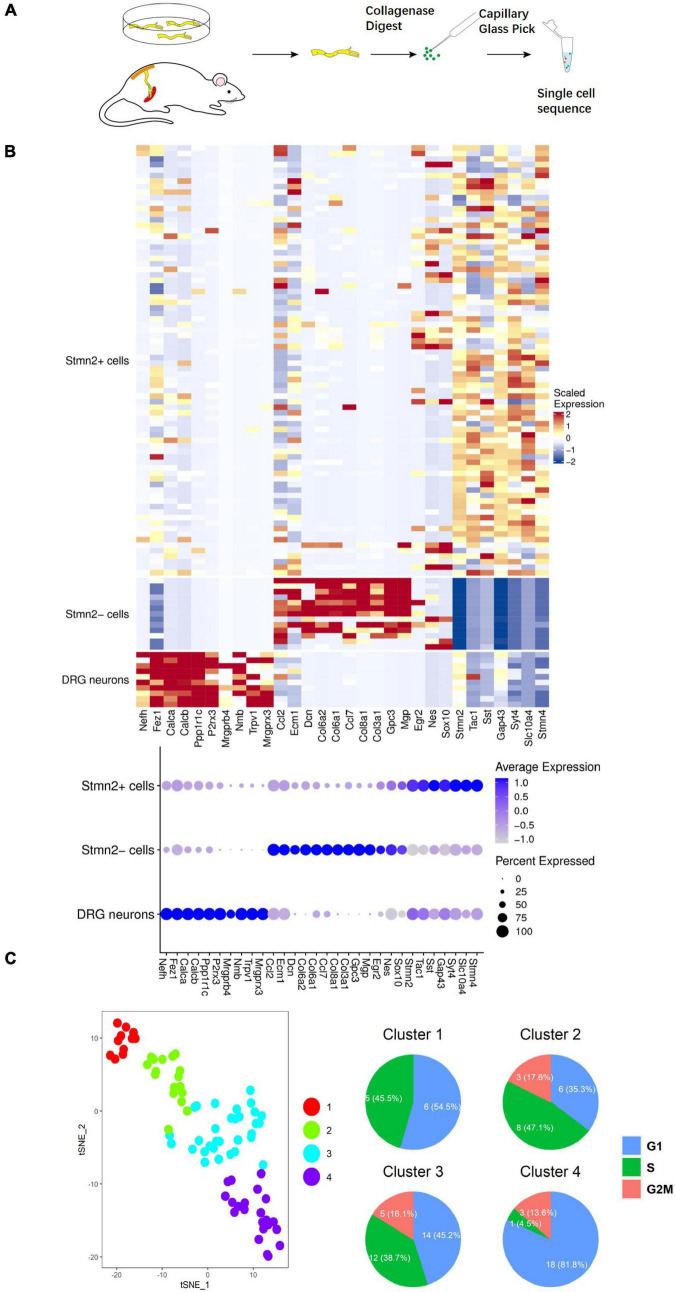
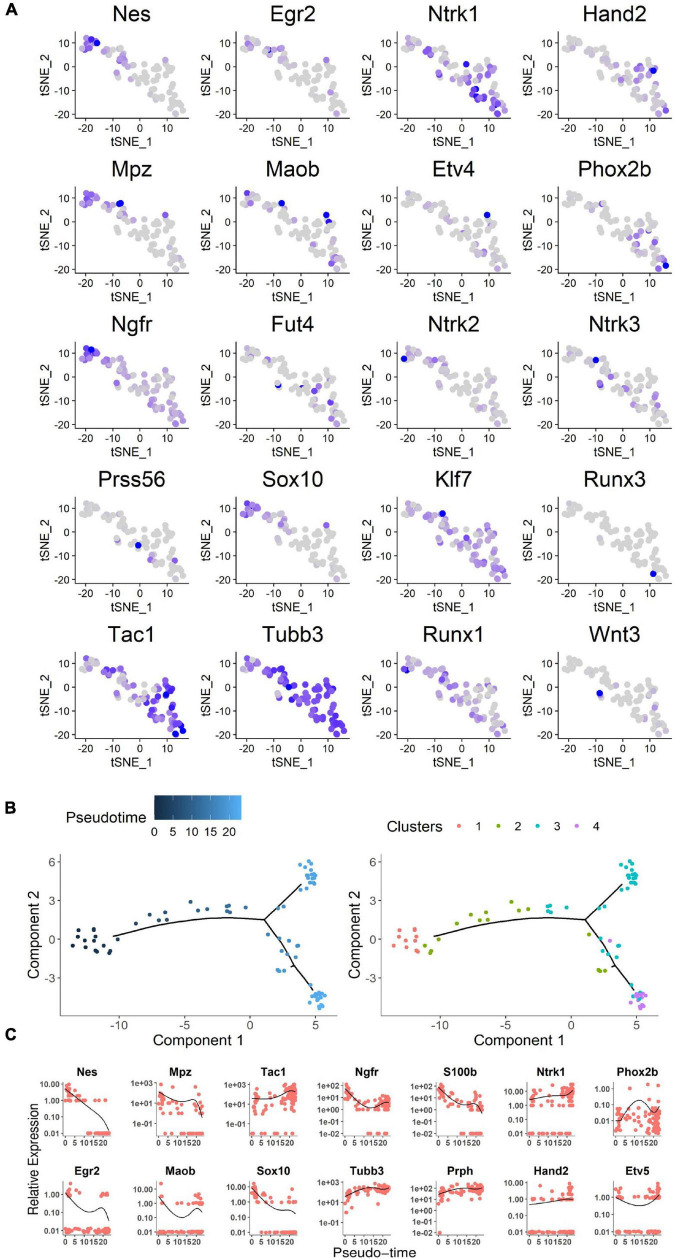
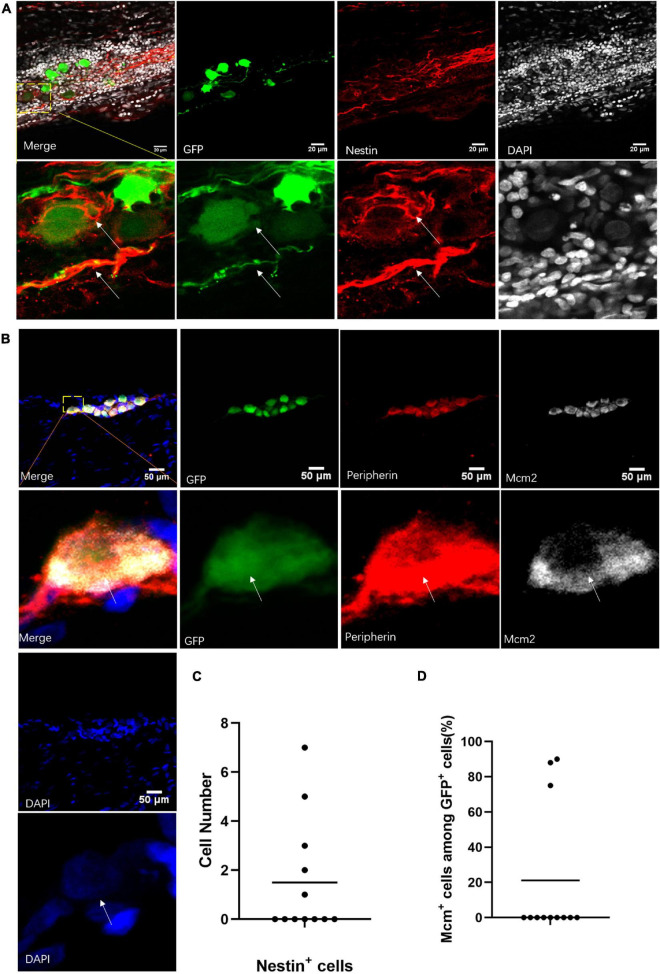
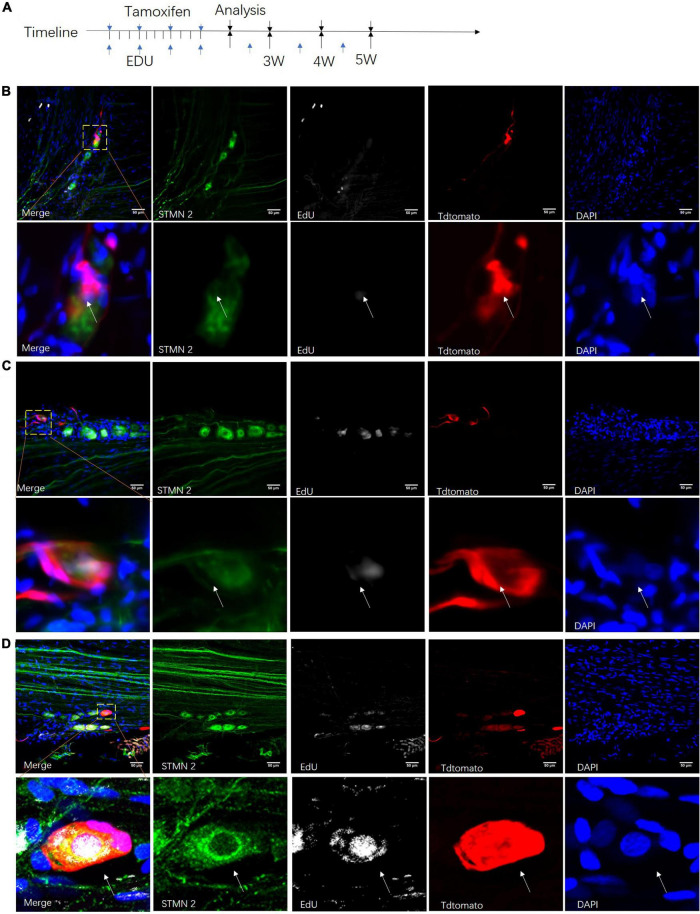
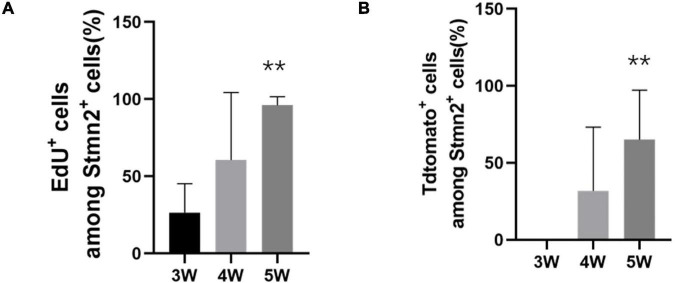
Prior research generally confirms that there are no neuronal cell bodies in the adult sciatic nerve. However, we occasionally find some neuronal cells in adult rat sciatic nerves, either intact or crush-injured. By whole-mount staining and optical imaging of the hyalinized sciatic nerves for Stmn2 (a specific marker for neuronal cells), we found those neuronal cells with irregular distribution in the sciatic nerves in both crushed model and normal rats. We investigated the identity of those cells and established a cultured sciatic nerve model. Immunohistochemistry evidence both in vivo and in vitro illustrated that some of those cells are mature neurons in sciatic nerves. With single-cell sequencing of neuronal cells in adeno-associated virus (AAV)-infected sciatic nerves, we identified that some of those cells are a kind of neuronal stem-like cells. Then we constructed a Nestin-CreERT 2 rat line and traced those cells with fluorescence labeling which was induced by tamoxifen. Interesting, we proved that neuronal stem-like cells could proliferate by combination of EdU incorporation with staining in the sciatic nerves of transgenic rats. Together, the discovery of neuronal cells in adult sciatic nerves will make us aware of the distribution of neurons in the peripheral nervous system. Especially our data suggest that neuronal stem-like cells could proliferate in the sciatic nerves of adult rats.

Keywords: crushed sciatic nerve; neuronal cell bodies; neuronal stem-like cells; sciatic nerve culture; single-cell sequencing; transgenic rat model.


Conflict of interest statement

The authors declare that the research was conducted in the absence of any commercial or financial relationships that could be construed as a potential conflict of interest.

Figures

FIGURE 1
FIGURE 1
Identification of neuronal cells in the sciatic nerves of adult rats. (A) Neuronal cells in the intact sciatic nerves of adult rats. The nerves were hyalinized using ScaleS and stained for Stmn2 (red). n = 18 (totally), n = 5 (sciatic nerves with neuronal cells). Scale bar: upper = 1000 μm, lower = 20 μm. (B) Neuronal cells in the crushed sciatic nerves of adult rats. Lower panels show high-magnification images of the boxed regions in the upper panel. The sciatic nerves were hyalinized using ScaleS and stained for Stmn2 (red). The white lines indicated the crush site. n = 16 (totally), n = 5 (sciatic nerves with neuronal cells). Scale bar: upper = 1000 μm, lower = 20 μm. (C) The quantification of Stmn2+ cell number in the normal sciatic nerves and crushed sciatic nerves. The circle points represent the number of Stmn2+ cells of a normal sciatic nerve. The square points represent the number of Stmn2+ cells of a crushed sciatic nerve (Normal sciatic nerves: n = 5 of 18 which contain neuronal cells, crushed sciatic nerves: n = 5 of 16 which contain neuronal cells; p > 0.05; unpaired t test). (D) The quantification of diameters of Stmn2+ cells in the sciatic nerves (n = 3; p > 0.05; one-way ANOVA with Dunnett’s multiple comparisons test). The white arrow points to the positive cells.
FIGURE 2
FIGURE 2
Identification of neurons in the sciatic nerves of adult rats. (A) Sciatic nerve infection model. hSYN-promoter GFP AAV2/9 virus was injected into the rat sciatic nerves for 2 weeks. n = 12. (B) Neuronal cells marked by GFP in vivo. Cells expressing GFP (green) in the sciatic nerves of adult rats. n = 6 (sciatic nerve with GFP marked neuronal cells). Scale bar, 200 μm. (C) The quantification of GFP+ cell number in sciatic nerves of virus infected rats. hSYN-promoter GFP AAV 2/9 virus was injected into the sciatic nerves. The circle points represented the cell number of GFP+ cells in the virus-infected sciatic nerve (n = 6 of 12 which contain the GFP+ cells). (D) Neurons labeled by AAV2/9 virus in sciatic nerves of adult rats in vivo. Two weeks after injection of hSYN-promoter GFP AAV2/9 virus, immunofluorescence staining for NeuN (red) and DAPI (gray) in GFP (green)-labeled cells in the sciatic nerves. n = 18 (total sciatic nerves with GFP+ neuronal cells), n = 3 (sciatic nerves with NeuN marked GFP+ neuronal cells). Scale bar, 50 μm. (E) The quantification of NeuN+ cells number in the sciatic nerve of virus injected rats. The sciatic nerves of those rats are infected by hSYN-promoter GFP AAV2/9 virus (n = 18). The triangular points represent the cell number of NeuN+ cells in a sciatic nerve with GFP+ cells (n = 3). The white arrow points to the positive cells.
FIGURE 3
FIGURE 3
Neuronal cells marked by virus in cultured sciatic nerves. (A) Sciatic nerve culture model. The sciatic nerves of adult rats were cultured in a defined serum-free medium. n = 8 (totally). (B) Cultured sciatic nerves infected by CMV-promoter mCherry AAV2/9 virus and hSYN-promoter GFP AAV2/9 virus for 2 weeks. Distribution of CMV-promoter GFP+ cells (green) and hSYN-promoter mCherry+ cells (red) in the cultured sciatic nerves. n = 3 (sciatic nerves with GFP+ mCherry+ cells). Scale bar, 50 μm. (C) The quantification of GFP+ cells and mCherry+ cell number in the cultured sciatic nerves which were infected by CMV-promoter mCherry AAV2/9 virus and hSYN-promoter GFP AAV2/9 virus. The circle points represented the number of GFP+ cells. The triangular points represented the number of mCherry+ cells (n = 3 of 8 which contain the GFP+ mCherry+ cells). (D) Virus-labeled cells are neuronal cells. Immunofluorescence staining for Peripherin (red) and DAPI (gray) was performed in cultured adult rat sciatic nerves with GFP (green)-labeled cells after 2 weeks infection of the hSYN-promoter GFP AAV2/9 virus. n = 4 (all the GFP+ cells could be stained by Peripherin). Scale bar, 50 μm.
FIGURE 4
FIGURE 4
Single-cell sequencing of the neuronal cells marked by AAV2/9 virus in sciatic nerves of adult rats. (A) Single cell acquisition model of virus-labeled neuronal cells. (B) Single-cell sequencing of virus-marked cells. Single-cell sequencing of neuronal cells was conducted after 2 weeks of hSYN-promoter AAV2/9 virus infection. The hot map represents the transcriptome similarities between 78 GFP+ Stmn2+ cells, 13 GFP+ Stmn2 cells, and 10 DRG cells. GFP+ cells were dissected from nerves injected with hSYN-promoter GFP AAV2/9 virus. DRG neurons were dissected from adult rat DRGs in vivo. A total of 84 cells from cultured sciatic nerves, seven cells from virus-injected sciatic nerves in vivo, and 10 cells from DRG neurons. (C) t-SNE map represents the subcluster analysis of the 78 GFP+ cells that expressed high levels of Stmn2. The four colors represent four different clusters. The pie diagrams represented the cell cycle analysis of those cells. A total of 74 cells from cultured sciatic nerves and four cells from virus-injected sciatic nerves in vivo. See also Supplementary Figure 1.
FIGURE 5
FIGURE 5
Analysis of neuronal cell single-cell sequencing data. (A) Expression profile of neural crest differentiation-related genes in the t-SNE map. Blue gradient represented the level of gene expression. (B) Expression profile of representative genes along the pseudo-time. Cells were ordered on the x pseudo-time axis by development of neural stem cells. Relevant gene expression was shown on the y axis as transcript counts (the black line was the running mean of expression with a window size of all cells). Each dot represents a cell. As show on the right, cells are highlighted in the same subcluster color gradient as in Figure 4C. (C) The pseudo-time genes expression level based on expression gradient. The chosen genes were representative examples of pseudo-timed differential expression along the transition from proliferation to differentiation for neural crest stem cells, progenitors, and neurons. See also Supplementary Figure 1.
FIGURE 6
FIGURE 6
Neuronal stem-like cells in sciatic nerves of adult rats. (A) Stem cell marker staining of neuronal cells in sciatic nerves after virus injection. Immunofluorescent staining for Nestin (red) and DAPI (gray) of GFP+ (green) neuronal cells after infection of hSYN-promoter GFP AAV2/9 virus. n = 12 (GFP+ sciatic nerves), n = 5 (Nestin+ sciatic nerves). Scale bar, 20 μm. (B) Neuronal cells in a phase of division. Confocal images of immunostaining of Mcm2 (gray), Peripherin (red), and DAPI (blue) in GFP+ (green) neuronal cells. The sciatic nerves were infected by hSYN-promoter GFP AAV2/9 virus. n = 12 (sciatic nerves with GFP+ neuronal cells), n = 3 (Mcm2+ sciatic nerves). Scale bar, 50 μm. (C) The quantification of the number of Nestin+ cells in the sciatic nerves with neuronal cells. The sciatic nerves with neuronal cells were infected by hSYN-promoter GFP AAV2/9 virus (n = 5 of 12 which contain Nestin+ cells, the other without Nestin+ cells). (D) The quantification of the percentage of Mcm2+ cells among all GFP+ neuronal cells in the sciatic nerves. The cultured sciatic nerves were infected by hSYN-promoter GFP AAV2/9 virus. The circle points represent the percentage of Mcm2+ cells among GFP+ cells (n = 3). The white arrow points to the positive cells.
FIGURE 7
FIGURE 7
Proliferation of neuronal stem-like cells in the sciatic nerves of transgenic rats. (A) Adult Nestin-CreERT2::Tdtomato rats were given injections of tamoxifen and EdU at different time points for clonal lineage-tracing analysis. (B–D) Confocal images of Stmn2-labeled cells (green) co-labeled with TdTomato (red), EdU (gray), and DAPI (blue) after tamoxifen and EdU injection for 3–5 weeks. Scale bar, 50 μm. n = 5 for each time point. The white arrow points to the positive cells.
FIGURE 8
FIGURE 8
The quantification of proliferation of the neuronal stem-like cells. (A) The quantification of the percentage of EdU+ cells among all Stmn2+ cells in the sciatic nerve. Values represent mean ± SEM (n = 5 sciatic nerves for each time point; **p < 0.05; one-way ANOVA with Dunnett’s multiple comparisons test). (B) Quantification of the proportion of TdTomato+ cells among all Stmn2+ cells in the sciatic nerve. Values represent mean ± SEM (n = 5 sciatic nerves for each time point; **p < 0.05; one-way ANOVA with Dunnett’s multiple comparisons test).

Similar articles

Cited by

References

    1. Altman J. (1962). Are new neurons formed in the brains of adult mammals? Science 135 1127–1128. 10.1126/science.135.3509.1127 - DOI - PubMed
    1. Aquino J. B. (2017). Uncovering the In Vivo Source of Adult Neural Crest Stem Cells. Stem Cells Dev. 26 303–313. 10.1089/scd.2016.0297 - DOI - PubMed
    1. Baggiolini A., Varum S., Mateos J. M., Bettosini D., John N., Bonalli M., et al. (2015). Premigratory and migratory neural crest cells are multipotent in vivo. Cell Stem Cell 16 314–322. 10.1016/j.stem.2015.02.017 - DOI - PubMed
    1. Blondel V. D., Guillaume J. L., Lambiotte R., Lefebvre E. (2008). Fast unfolding of communities in large networks. J. Stat. Mech. Theory E. 2008:P10008 10.1103/PhysRevE.83.036103 - DOI - PubMed
    1. Bronner M. E., Simoes-Costa M. (2016). The Neural Crest Migrating into the Twenty-First Century. Curr. Top Dev. Biol. 116 115–134. 10.1016/bs.ctdb.2015.12.003 - DOI - PMC - PubMed

LinkOut - more resources