

Human Nmnat1 Promotes Autophagic Clearance of Amyloid Plaques in a Drosophila Model of Alzheimer's Disease
- PMID: 35401143
- PMCID: PMC8988035
- DOI: 10.3389/fnagi.2022.852972
Human Nmnat1 Promotes Autophagic Clearance of Amyloid Plaques in a Drosophila Model of Alzheimer's Disease
Abstract
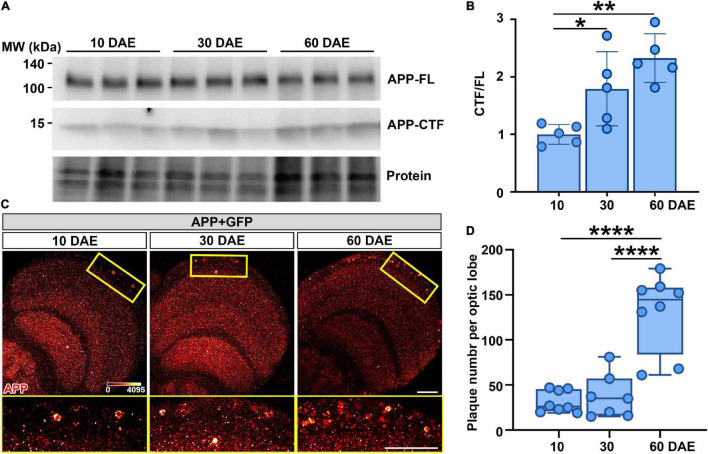
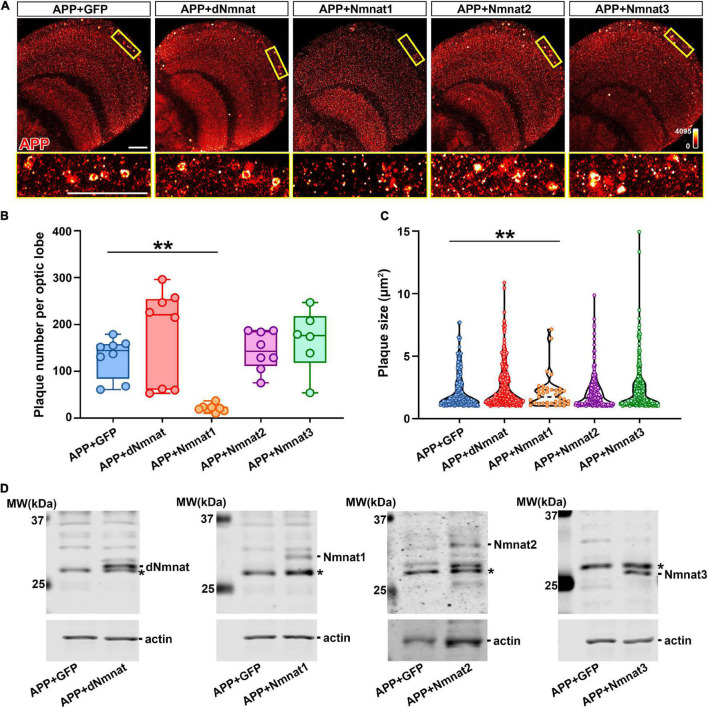
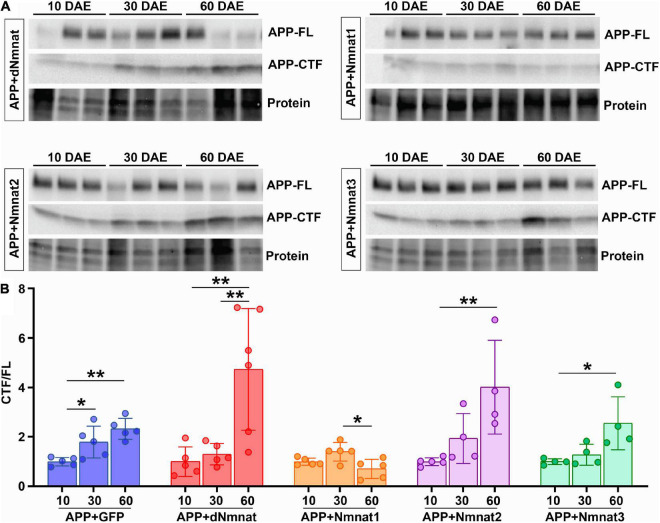
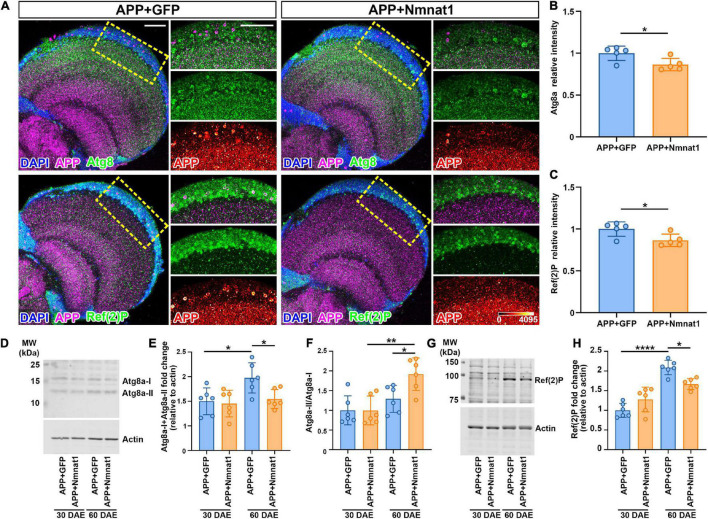
Alzheimer's disease (AD) is a progressive neurodegenerative disease characterized by irreversible cognitive decline with limited therapeutic approaches. We characterized a Drosophila model of amyloid pathology that expresses human amyloid-beta precursor protein (APP695) and β-site APP cleaving enzyme (BACE) in the nervous system. Our model recapitulates in vivo the age-dependent accumulation of BACE-derived C-terminal fragment (CTF) and amyloid plaques in the brain, one of the key pathological hallmarks of AD. Using this model, we assessed the effects on plaque formation of Nicotinamide mononucleotide adenylyltransferase (Nmnat), an evolutionarily conserved nicotinamide adenine dinucleotide (NAD+) synthase involved in cellular metabolism and neuroprotection. We compared the effects of overexpression of Drosophila Nmnat (dNmnat), human Nmnat1 (hNmnat1), human Nmnat2 (hNmnat2), and human Nmnat3 (hNmnat3), and observed that hNmnat1 has the highest efficacy in reducing amyloid aggregation and APP-CTF accumulation. Interestingly, we demonstrated that overexpression of hNmnat1 reduces amyloid plaques by promoting autophagic clearance. Our findings uncover a role of hNmnat1 in amyloid clearance and suggest an exciting neuroprotective potential of hNmnat1 in amyloid pathology.
Keywords: APP; Drosophila; NAD; aggregates; autophagy.
Copyright © 2022 Zhu, Lobato, Zhai and Pinto.
Conflict of interest statement
The authors declare that the research was conducted in the absence of any commercial or financial relationships that could be construed as a potential conflict of interest.
Figures
Similar articles
-
Nmnat restores neuronal integrity by neutralizing mutant Huntingtin aggregate-induced progressive toxicity.Proc Natl Acad Sci U S A. 2019 Sep 17;116(38):19165-19175. doi: 10.1073/pnas.1904563116. Epub 2019 Sep 4. Proc Natl Acad Sci U S A. 2019. PMID: 31484760 Free PMC article.
-
Impaired autophagy and APP processing in Alzheimer's disease: The potential role of Beclin 1 interactome.Prog Neurobiol. 2013 Jul-Aug;106-107:33-54. doi: 10.1016/j.pneurobio.2013.06.002. Epub 2013 Jul 1. Prog Neurobiol. 2013. PMID: 23827971 Review.
-
Alzheimer's disease.Subcell Biochem. 2012;65:329-52. doi: 10.1007/978-94-007-5416-4_14. Subcell Biochem. 2012. PMID: 23225010 Review.
-
Application of optogenetic Amyloid-β distinguishes between metabolic and physical damages in neurodegeneration.Elife. 2020 Mar 31;9:e52589. doi: 10.7554/eLife.52589. Elife. 2020. PMID: 32228858 Free PMC article.
-
Fibrillar Aβ triggers microglial proteome alterations and dysfunction in Alzheimer mouse models.Elife. 2020 Jun 8;9:e54083. doi: 10.7554/eLife.54083. Elife. 2020. PMID: 32510331 Free PMC article.
Cited by
-
Inhibitors of NAD+ Production in Cancer Treatment: State of the Art and Perspectives.Int J Mol Sci. 2024 Feb 8;25(4):2092. doi: 10.3390/ijms25042092. Int J Mol Sci. 2024. PMID: 38396769 Free PMC article. Review.
-
NAD+ metabolism is a key modulator of bacterial respiratory epithelial infections.Nat Commun. 2023 Oct 2;14(1):5818. doi: 10.1038/s41467-023-41372-w. Nat Commun. 2023. PMID: 37783679 Free PMC article.
-
Predicting early Alzheimer's with blood biomarkers and clinical features.Sci Rep. 2024 Mar 13;14(1):6039. doi: 10.1038/s41598-024-56489-1. Sci Rep. 2024. PMID: 38472245 Free PMC article.
-
Drosophila melanogaster as a model to study autophagy in neurodegenerative diseases induced by proteinopathies.Front Neurosci. 2023 May 18;17:1082047. doi: 10.3389/fnins.2023.1082047. eCollection 2023. Front Neurosci. 2023. PMID: 37274187 Free PMC article. Review.
References
-
- Anderson R. M., Barger J. L., Edwards M. G., Braun K. H., O’Connor C. E., Prolla T. A. (2008). Dynamic regulation of PGC-1α localization and turnover implicates mitochondrial adaptation in calorie restriction and the stress response. Aging Cell 7 101–111. 10.1111/j.1474-9726.2007.00357.x - DOI - PMC - PubMed
Grants and funding
LinkOut - more resources
Full Text Sources
Molecular Biology Databases