

Musicianship-Related Structural and Functional Cortical Features Are Preserved in Elderly Musicians
- PMID: 35401149
- PMCID: PMC8990841
- DOI: 10.3389/fnagi.2022.807971
Musicianship-Related Structural and Functional Cortical Features Are Preserved in Elderly Musicians
Abstract
Background: Professional musicians are a model population for exploring basic auditory function, sensorimotor and multisensory integration, and training-induced neuroplasticity. The brain of musicians exhibits distinct structural and functional cortical features; however, little is known about how these features evolve during aging. This multiparametric study aimed to examine the functional and structural neural correlates of lifelong musical practice in elderly professional musicians.
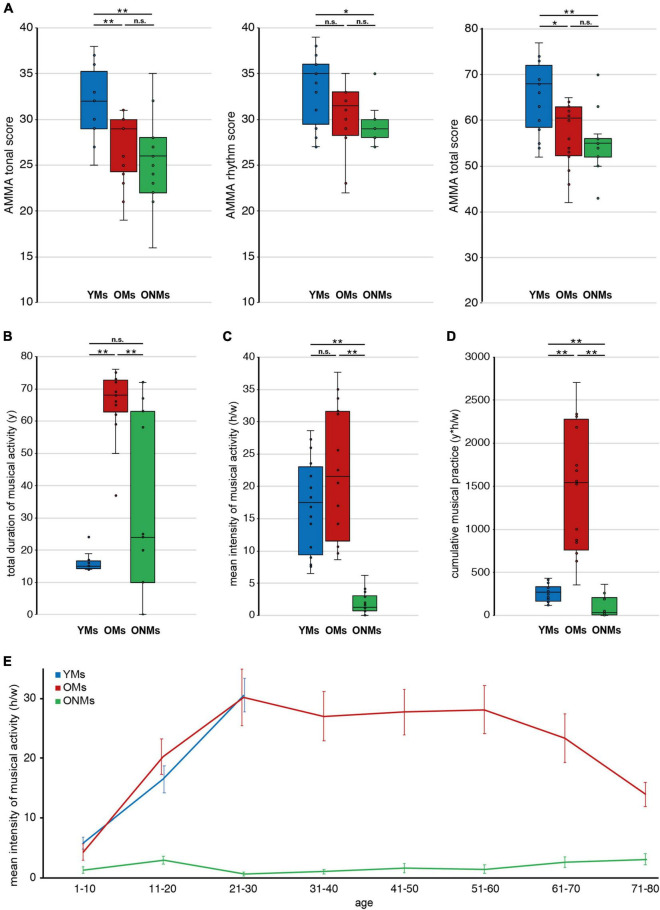
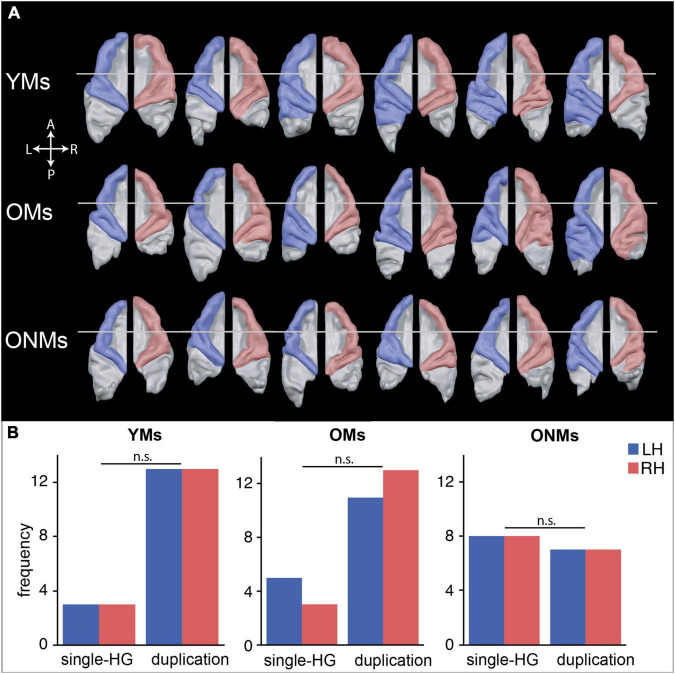
Methods: Sixteen young musicians, 16 elderly musicians (age >70), and 15 elderly non-musicians participated in the study. We assessed gray matter metrics at the whole-brain and region of interest (ROI) levels using high-resolution magnetic resonance imaging (MRI) with the Freesurfer automatic segmentation and reconstruction pipeline. We used BrainVoyager semiautomated segmentation to explore individual auditory cortex morphotypes. Furthermore, we evaluated functional blood oxygenation level-dependent (BOLD) activations in auditory and non-auditory regions by functional MRI (fMRI) with an attentive tone-listening task. Finally, we performed discriminant function analyses based on structural and functional ROIs.
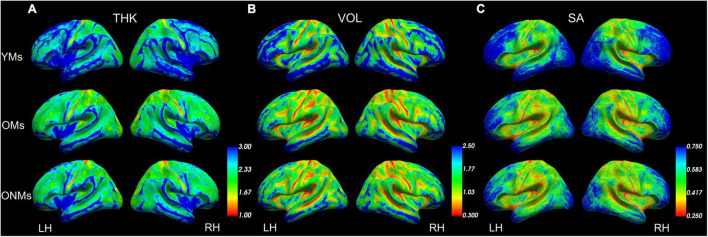
Results: A general reduction of gray matter metrics distinguished the elderly from the young subjects at the whole-brain level, corresponding to widespread natural brain atrophy. Age- and musicianship-dependent structural correlations revealed group-specific differences in several clusters including superior, middle, and inferior frontal as well as perirolandic areas. In addition, the elderly musicians exhibited increased gyrification of auditory cortex like the young musicians. During fMRI, the elderly non-musicians activated predominantly auditory regions, whereas the elderly musicians co-activated a much broader network of auditory association areas, primary and secondary motor areas, and prefrontal and parietal regions like, albeit weaker, the young musicians. Also, group-specific age- and musicianship-dependent functional correlations were observed in the frontal and parietal regions. Moreover, discriminant function analysis could separate groups with high accuracy based on a set of specific structural and functional, mainly temporal and occipital, ROIs.
Conclusion: In conclusion, despite naturally occurring senescence, the elderly musicians maintained musicianship-specific structural and functional cortical features. The identified structural and functional brain regions, discriminating elderly musicians from non-musicians, might be of relevance for the aging musicians' brain. To what extent lifelong musical activity may have a neuroprotective impact needs to be addressed further in larger longitudinal studies.
Keywords: aging; auditory cortex; elderly; fMRI; functional; musicians; musicianship; structural.
Copyright © 2022 Rus-Oswald, Benner, Reinhardt, Bürki, Christiner, Hofmann, Schneider, Stippich, Kressig and Blatow.
Conflict of interest statement
The authors declare that the research was conducted in the absence of any commercial or financial relationships that could be construed as a potential conflict of interest.
Figures


Similar articles
-
Music listening engages specific cortical regions within the temporal lobes: differences between musicians and non-musicians.Cortex. 2014 Oct;59:126-37. doi: 10.1016/j.cortex.2014.07.013. Epub 2014 Aug 12. Cortex. 2014. PMID: 25173956
-
Subcortical and cortical correlates of pitch discrimination: Evidence for two levels of neuroplasticity in musicians.Neuroimage. 2017 Dec;163:398-412. doi: 10.1016/j.neuroimage.2017.07.057. Epub 2017 Jul 31. Neuroimage. 2017. PMID: 28774646
-
Musical Expertise Shapes Functional and Structural Brain Networks Independent of Absolute Pitch Ability.J Neurosci. 2021 Mar 17;41(11):2496-2511. doi: 10.1523/JNEUROSCI.1985-20.2020. Epub 2021 Jan 25. J Neurosci. 2021. PMID: 33495199 Free PMC article.
-
How Musical Training Shapes the Adult Brain: Predispositions and Neuroplasticity.Front Neurosci. 2021 Mar 10;15:630829. doi: 10.3389/fnins.2021.630829. eCollection 2021. Front Neurosci. 2021. PMID: 33776638 Free PMC article. Review.
-
Stimulus-dependent activations and attention-related modulations in the auditory cortex: a meta-analysis of fMRI studies.Hear Res. 2014 Jan;307:29-41. doi: 10.1016/j.heares.2013.08.001. Epub 2013 Aug 11. Hear Res. 2014. PMID: 23938208 Review.
Cited by
-
Music Engagement as a Source of Cognitive Reserve.Am J Alzheimers Dis Other Demen. 2023 Jan-Dec;38:15333175231214833. doi: 10.1177/15333175231214833. Am J Alzheimers Dis Other Demen. 2023. PMID: 37993973 Free PMC article. Review.
-
Efferent Control in Musicians: A Review.Audiol Res. 2023 Jan 6;13(1):76-85. doi: 10.3390/audiolres13010007. Audiol Res. 2023. PMID: 36648928 Free PMC article. Review.
-
Higher surface folding of the human premotor cortex is associated with better long-term learning capability.Commun Biol. 2024 May 25;7(1):635. doi: 10.1038/s42003-024-06309-z. Commun Biol. 2024. PMID: 38796622 Free PMC article.
-
Music interventions in 132 healthy older adults enhance cerebellar grey matter and auditory working memory, despite general brain atrophy.Neuroimage Rep. 2023 Mar 23;3(2):100166. doi: 10.1016/j.ynirp.2023.100166. eCollection 2023 Jun. Neuroimage Rep. 2023. PMID: 40568451 Free PMC article.
-
Neuroanatomical Disposition, Natural Development, and Training-Induced Plasticity of the Human Auditory System from Childhood to Adulthood: A 12-Year Study in Musicians and Nonmusicians.J Neurosci. 2023 Sep 13;43(37):6430-6446. doi: 10.1523/JNEUROSCI.0274-23.2023. Epub 2023 Aug 21. J Neurosci. 2023. PMID: 37604688 Free PMC article.
References
-
- Abdul-Kareem I. A., Stancak A., Parkes L. M., Al-Ameen M., Alghamdi J., Aldhafeeri F. M., et al. (2011). Plasticity of the superior and middle cerebellar peduncles in musicians revealed by quantitative analysis of volume and number of streamlines based on diffusion tensor tractography. Cerebellum 10 611–623. 10.1007/s12311-011-0274-1 - DOI - PubMed
LinkOut - more resources
Full Text Sources