

Destination and Specific Impact of Different Bile Acids in the Intestinal Pathogen Clostridioides difficile
- PMID: 35401433
- PMCID: PMC8989276
- DOI: 10.3389/fmicb.2022.814692
Destination and Specific Impact of Different Bile Acids in the Intestinal Pathogen Clostridioides difficile
Abstract
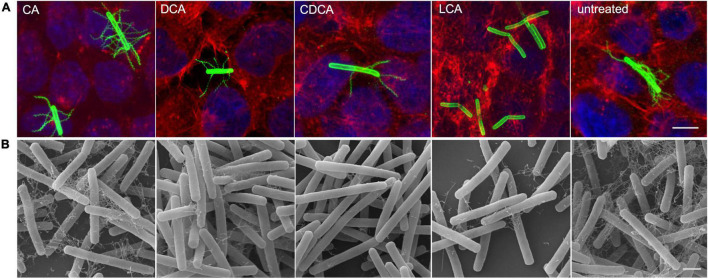
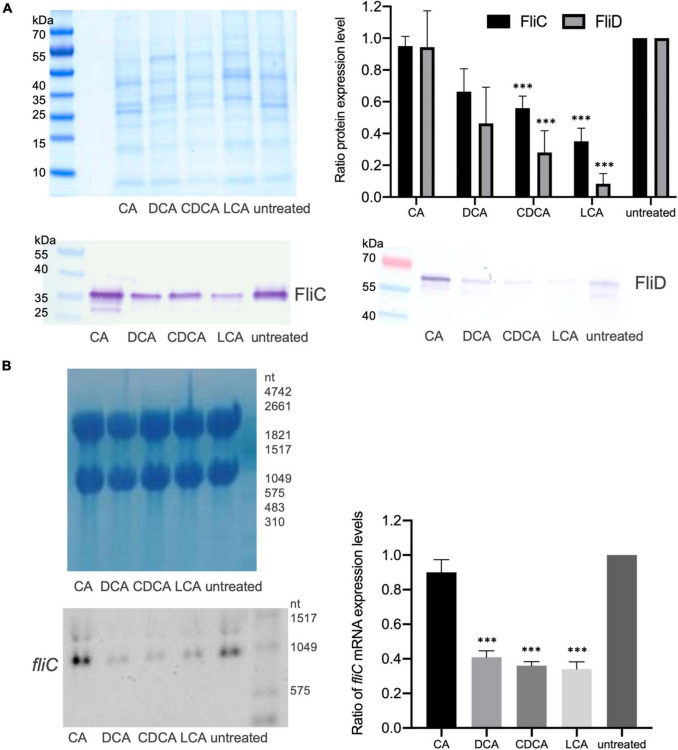
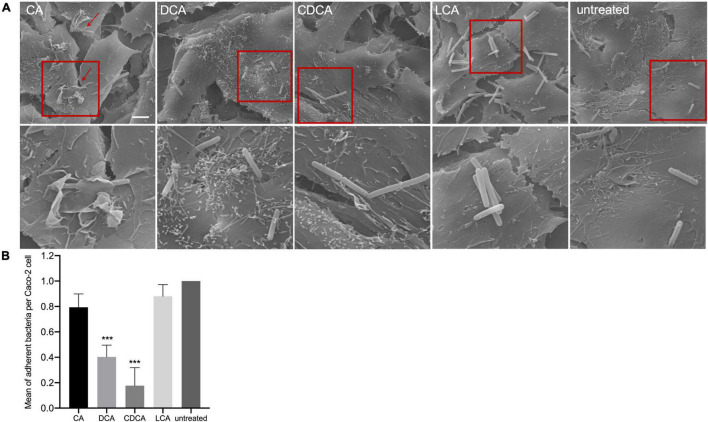
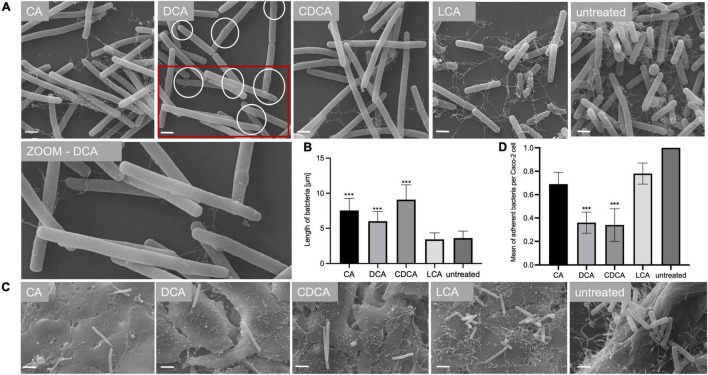
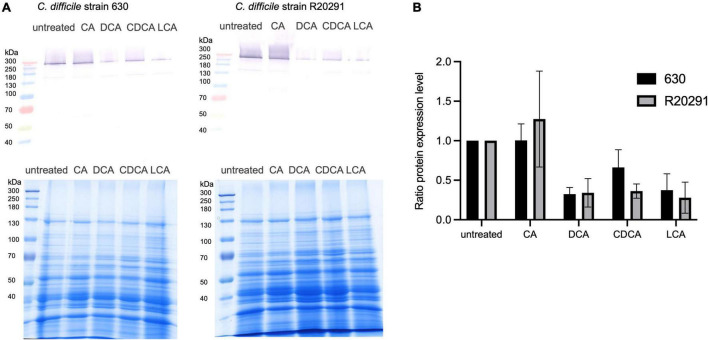
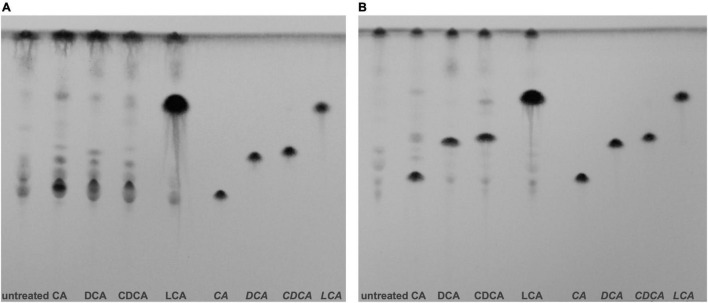
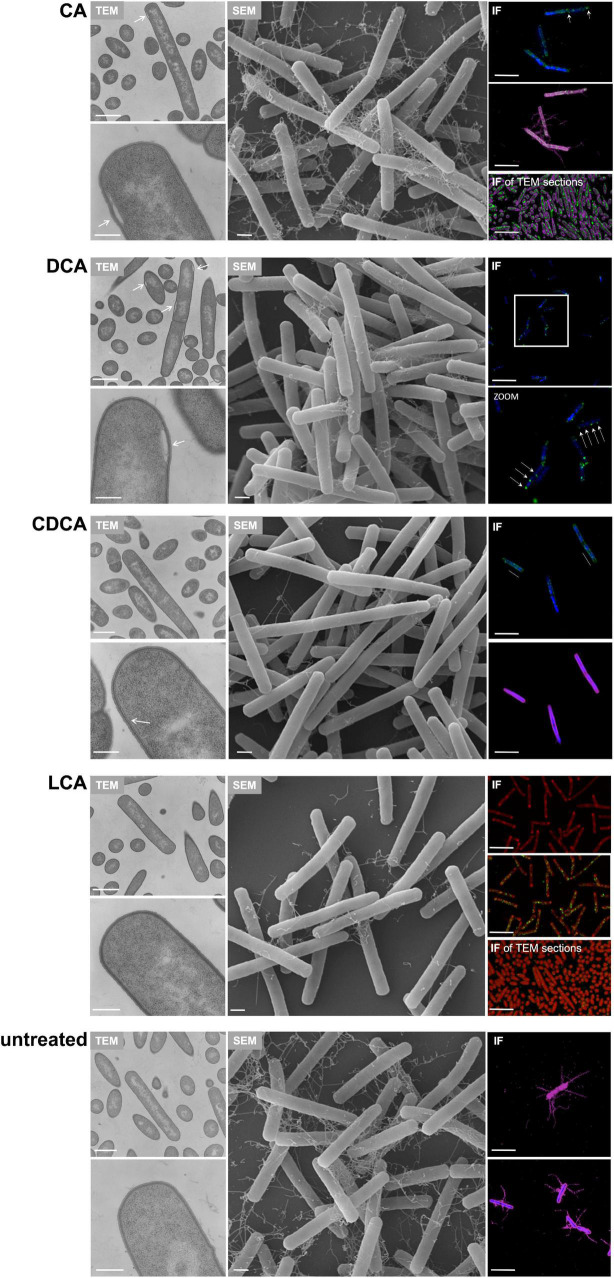
The anaerobic bacterium Clostridioides difficile represents one of the most problematic pathogens, especially in hospitals. Dysbiosis has been proven to largely reduce colonization resistance against this intestinal pathogen. The beneficial effect of the microbiota is closely associated with the metabolic activity of intestinal microbes such as the ability to transform primary bile acids into secondary ones. However, the basis and the molecular action of bile acids (BAs) on the pathogen are not well understood. We stressed the pathogen with the four most abundant human bile acids: cholic acid (CA), chenodeoxycholic acid (CDCA), deoxycholic acid (DCA) and lithocholic acid (LCA). Thin layer chromatography (TLC), confocal laser scanning microscopy (CLSM), and electron microscopy (EM) were employed to track the enrichment and destination of bile acids in the bacterial cell. TLC not only revealed a strong accumulation of LCA in C. difficile, but also indicated changes in the composition of membrane lipids in BA-treated cells. Furthermore, morphological changes induced by BAs were determined, most pronounced in the virtually complete loss of flagella in LCA-stressed cells and a flagella reduction after DCA and CDCA challenge. Quantification of both, protein and RNA of the main flagella component FliC proved the decrease in flagella to originate from a change in gene expression on transcriptional level. Notably, the loss of flagella provoked by LCA did not reduce adhesion ability of C. difficile to Caco-2 cells. Most remarkably, extracellular toxin A levels in the presence of BAs showed a similar pattern as flagella expression. That is, CA did not affect toxin expression, whereas lower secretion of toxin A was determined in cells stressed with LCA, DCA or CDCA. In summary, the various BAs were shown to differentially modify virulence determinants, such as flagella expression, host cell adhesion and toxin synthesis. Our results indicate differences of BAs in cellular localization and impact on membrane composition, which could be a reason of their diverse effects. This study is a starting point in the elucidation of the molecular mechanisms underlying the differences in BA action, which in turn can be vital regarding the outcome of a C. difficile infection.
Keywords: Clostridioides difficile; adhesion; bile acids; flagella; toxin A.
Copyright © 2022 Metzendorf, Lange, Lainer, Schlüter, Dittmann, Paul, Troitzsch and Sievers.
Conflict of interest statement
The authors declare that the research was conducted in the absence of any commercial or financial relationships that could be construed as a potential conflict of interest.
Figures
Similar articles
-
The microbial-derived bile acid lithocholate and its epimers inhibit Clostridioides difficile growth and pathogenicity while sparing members of the gut microbiota.J Bacteriol. 2023 Sep 26;205(9):e0018023. doi: 10.1128/jb.00180-23. Epub 2023 Sep 11. J Bacteriol. 2023. PMID: 37695856 Free PMC article.
-
Differential View on the Bile Acid Stress Response of Clostridioides difficile.Front Microbiol. 2019 Feb 18;10:258. doi: 10.3389/fmicb.2019.00258. eCollection 2019. Front Microbiol. 2019. PMID: 30833939 Free PMC article.
-
Individual bile acids have differential effects on bile acid signaling in mice.Toxicol Appl Pharmacol. 2015 Feb 15;283(1):57-64. doi: 10.1016/j.taap.2014.12.005. Epub 2015 Jan 9. Toxicol Appl Pharmacol. 2015. PMID: 25582706 Free PMC article.
-
Impact of Primary and Secondary Bile Acids on Clostridioides difficile Infection.Pol J Microbiol. 2022 Mar 14;71(1):11-18. doi: 10.33073/pjm-2022-007. Pol J Microbiol. 2022. PMID: 35635171 Free PMC article. Review.
-
Evaluation of gut dysbiosis using serum and fecal bile acid profiles.World J Clin Cases. 2022 Dec 6;10(34):12484-12493. doi: 10.12998/wjcc.v10.i34.12484. World J Clin Cases. 2022. PMID: 36579096 Free PMC article. Review.
Cited by
-
Bacteroides fragilis derived metabolites, identified by molecular networking, decrease Salmonella virulence in mice model.Front Microbiol. 2022 Nov 10;13:1023315. doi: 10.3389/fmicb.2022.1023315. eCollection 2022. Front Microbiol. 2022. PMID: 36466691 Free PMC article.
-
Clostridioides difficile Modifies its Aromatic Compound Metabolism in Response to Amidochelocardin-Induced Membrane Stress.mSphere. 2022 Oct 26;7(5):e0030222. doi: 10.1128/msphere.00302-22. Epub 2022 Aug 22. mSphere. 2022. PMID: 35993700 Free PMC article.
-
The gut-liver axis in hepatobiliary diseases.Inflamm Regen. 2024 Jan 8;44(1):2. doi: 10.1186/s41232-023-00315-0. Inflamm Regen. 2024. PMID: 38191517 Free PMC article. Review.
-
The microbial-derived bile acid lithocholate and its epimers inhibit Clostridioides difficile growth and pathogenicity while sparing members of the gut microbiota.J Bacteriol. 2023 Sep 26;205(9):e0018023. doi: 10.1128/jb.00180-23. Epub 2023 Sep 11. J Bacteriol. 2023. PMID: 37695856 Free PMC article.
-
Platelets promote human macrophages-mediated macropinocytosis of Clostridioides difficile.Front Cell Infect Microbiol. 2024 Jan 5;13:1252509. doi: 10.3389/fcimb.2023.1252509. eCollection 2023. Front Cell Infect Microbiol. 2024. PMID: 38249298 Free PMC article.
References
LinkOut - more resources
Full Text Sources
Research Materials