. 2022 Mar 24:13:867443.
doi: 10.3389/fimmu.2022.867443. eCollection 2022.

Monoallelic Heb/Tcf12 Deletion Reduces the Requirement for NOTCH1 Hyperactivation in T-Cell Acute Lymphoblastic Leukemia

Affiliations

Monoallelic Heb/Tcf12 Deletion Reduces the Requirement for NOTCH1 Hyperactivation in T-Cell Acute Lymphoblastic Leukemia

Diogo F T Veiga et al. Front Immunol. .

Abstract

Early T-cell development is precisely controlled by E proteins, that indistinguishably include HEB/TCF12 and E2A/TCF3 transcription factors, together with NOTCH1 and pre-T cell receptor (TCR) signalling. Importantly, perturbations of early T-cell regulatory networks are implicated in leukemogenesis. NOTCH1 gain of function mutations invariably lead to T-cell acute lymphoblastic leukemia (T-ALL), whereas inhibition of E proteins accelerates leukemogenesis. Thus, NOTCH1, pre-TCR, E2A and HEB functions are intertwined, but how these pathways contribute individually or synergistically to leukemogenesis remain to be documented. To directly address these questions, we leveraged Cd3e-deficient mice in which pre-TCR signaling and progression through β-selection is abrogated to dissect and decouple the roles of pre-TCR, NOTCH1, E2A and HEB in SCL/TAL1-induced T-ALL, via the use of Notch1 gain of function transgenic (Notch1ICtg) and Tcf12+/- or Tcf3+/- heterozygote mice. As a result, we now provide evidence that both HEB and E2A restrain cell proliferation at the β-selection checkpoint while the clonal expansion of SCL-LMO1-induced pre-leukemic stem cells in T-ALL is uniquely dependent on Tcf12 gene dosage. At the molecular level, HEB protein levels are decreased via proteasomal degradation at the leukemic stage, pointing to a reversible loss of function mechanism. Moreover, in SCL-LMO1-induced T-ALL, loss of one Tcf12 allele is sufficient to bypass pre-TCR signaling which is required for Notch1 gain of function mutations and for progression to T-ALL. In contrast, Tcf12 monoallelic deletion does not accelerate Notch1IC-induced T-ALL, indicating that Tcf12 and Notch1 operate in the same pathway. Finally, we identify a tumor suppressor gene set downstream of HEB, exhibiting significantly lower expression levels in pediatric T-ALL compared to B-ALL and brain cancer samples, the three most frequent pediatric cancers. In summary, our results indicate a tumor suppressor function of HEB/TCF12 in T-ALL to mitigate cell proliferation controlled by NOTCH1 in pre-leukemic stem cells and prevent NOTCH1-driven progression to T-ALL.

Keywords: E2A/TCF3; HEB/TCF12; LMO1; NOTCH1; SCL/TAL1; T-cell acute lymphoblastic leukemia; tumor suppressor genes.


Conflict of interest statement

The authors declare that the research was conducted in the absence of any commercial or financial relationships that could be construed as a potential conflict of interest.

Figures
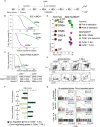
Figure 1
Figure 1
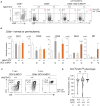
Pre-TCR signaling is functionally important for T-ALL progression. (A) Pre-TCR signalling and thymocytes development. (B, C) Kaplan-Meyer survival curves comparing disease development in the pre-TCR proficient (Cd3e+/+ ) and deficient (Cd3e-/- ) backgrounds in three models of T-ALL. (D) Principal component analysis of the transcriptomes of normal thymocyte subsets compared to SCL-LMO1-induced pre-leukemic and leukemic (T-ALL) thymocytes. (E) FACS phenotypes of SCLtgLMO1tg thymocytes from Cd3e+/+ and Cd3e-/- backgrounds at pre-leukemic and leukemic stages. (F) Gene set enrichment analysis (GSEA) correlates disease progression to stages of thymocyte differentiation. Up-regulated and down-regulated gene sets were computed at each stage of normal thymocyte development from ETP to DP using microarray data from the Immgen project (http://www.immgen.org/), and enrichment was tested during disease progression (pre-leukemia to leukemia). Dark green bars denote enrichment of the up-regulated signature, and yellow bars denote enrichment of down-regulated signatures. (G) GSEA analysis of β-selection, pre-TCR specific and CD8+ TCR specific gene signatures during disease progression. Left panels show the enrichment tests for up-regulated gene signatures, and right panels show enrichment of genes decreased by β-selection, pre-TCR and CD8+ TCR.
Figure 2
Figure 2
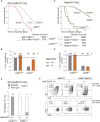
T-ALL progression associated with an inhibition of E proteins targets and downregulation of HEB protein. (A) Regulator analysis identified transcription factors associated to transcriptional repression during T-ALL progression and β-selection. Regulators are rank-ordered according to their enrichment scores. The bars display the downregulation significance (log10 adjusted P, Fisher’s exact test). Targets were extracted from ChIP-seq datasets (cell types in parenthesis). (B) GSEA analysis of genes activated by HEB and E2A targets during progression from pre-leukemic to leukemic state in Cd3e-deficient SCLtgLMO1tg T-ALL. (C) Binding site motif enrichment (MSig) within the proximal promoter regions of HEB target genes down-regulated between Cd3e-/- leukemic and pre-leukemic cells. (D) HEB and E2A protein levels during T-ALL progression measured by Western blotting. (E) Growth in vitro for primary T‐ALL samples (left panel). Western blot analysis of theindicated T-ALL samples (right panel).
Figure 3
Figure 3
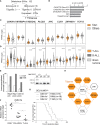
HEB restricts cell proliferation at the b‐selection checkpoint and acts as a tumor suppressor in T-ALL. (A) Effect of loss of one allele of Heb/Tcf12 or E2a/Tcf3 on the absolute numbers of thymocytes within the indicated subsets in a wt or SCLtgLMO1tg background. Shown are the average ± SD of at least 9 mice per group (5-6 weeks). Where not specified P value is compared to wild type control: **p = 0.0039, ***p < 0.002 and ****p < 0.0001. (B) Monoallelic Heb/Tcf12 deletion increased S/G2/M phase in Cd3e-deficientpre-leukemic DN3 thymocytes. Cell cycle analysis of Cd3e-deficient thymocytes in Heb/ Tcf12+/+ andHeb/Tcf12+/- backgrounds. *p value <0.01). (C) Kaplan-Meyer survival curves comparing E2a/Tcf3+/+ with E2a/Tcf3+/- backgrounds (left panel) as well as Heb/Tcf12+/+ and Heb/Tcf12+/- backgrounds in Cd3e-proficient SCLtgLMO1tg leukemias. In both panels, the +/+ genotypes are wild type littermates of +/- mice. N represents the numbers of mice and the median survival in days was computed from the survival curves. *p = 0.039 and ****p < 0.0001.
Figure 4
Figure 4
The SCL and LMO1 oncogenes favor the DN-DP transition at the leukemic stage despite the absence of pre-TCR/CD3 signaling: synergy with decreased Heb gene dosage. (A) FACS phenotypes of normal Cd3e-/- or pre-leukemic Cd3e-/-SCLtgLMO1tg thymocytes from Heb/Tcf12+/+ and Heb/Tcf12+/- backgrounds. Flow cytometry profiles for the CD4− CD8− DN populations are shown in Figure S4. (B) Absolute numbers of thymocytes within the indicated subsets in normal Cd3e-/- or pre-leukemic Cd3e-/-SCLtgLMO1tg in Heb/Tcf12+/+ and Heb/Tcf12+/- backgrounds. Shown are the average ± SD of at least 5 mice per group, taken at 4 weeks. Note the significant increase in the post-β selection DN4 and DP populations in SCLtgLMO1tgHeb/Tcf12+/- mice. (C) FACS phenotypes of Cd3e-proficient or deficient SCLtgLMO1tg leukemias from Heb/Tcf12+/+ and Heb/Tcf12+/- backgrounds. (D) T-ALL with a post-β-selection phenotype. Shown are the percentages of cells from each T-ALL with post-β-selection surface phenotypes (DN3-4, DN4, ISP, SP). n represents the numbers of mice analysed. * adj p=0.02. pvalue < 0.05; **p value < 0.005; ***p value < 0.0005; ****p value < 0.0001, ns, Non significant.
Figure 5
Figure 5
The SCL and LMO1 oncogenes but not the Notch1/IC9 oncogene reveal Heb/Tcf12 as a haplo-insufficient tumor suppressor in T-ALL. (A) Kaplan-Meyer survival curves comparing Cd3e-deficient SCLtgLMO1tg leukemias in Heb/Tcf12+/+ and Heb/Tcf12+/- backgrounds. Shown is the median survival in days. (B) T-ALL susceptibility of SCLtgLMO1tg mice in Cd3e-proficient (Cd3e+/+, Figure 3C) or deficient (Cd3e-/-, Figure 5A) backgrounds was calculated from the area under the curve (AUC) of the above Kaplan-Meyer graph over 365 days. Shown on top are the numbers of mice per group. (C, D) Kaplan-Meyer survival curves (C) and T-ALL susceptibility (D) comparing Notch1/IC9-induced leukemias in Heb/Tcf12+/+ and Heb/Tcf12+/- backgrounds that are Cd3e-deficient or Cd3e-proficient. (E) Presence of Notch1 activating mutations in Cd3e-proficient but not Cd3e-deficient SCLtgLMO1tg T-ALL. Shown are the percentage of T-ALL samples with an activating mutation in the Notch1 locus in Heb/Tcf12+/+ and Heb/Tcf12+/- backgrounds. Shown on top are the numbers of leukemias sequenced in each group. Only one Heb/Tcf12+/-Cd3e-deficient SCLtgLMO1tg T-ALL harbours a mutation affecting the PEST domain of Notch1. (F) Leukemic phenotypes of Cd3e-proficient or Cd3e-deficient Notch1tg leukemias from Heb/Tcf12+/+ and Heb/Tcf12+/- backgrounds **** pvalue<0.0001.
Figure 6
Figure 6
HEB controls a tumor suppressor network in T-ALL. (A) Strategy of tumor suppressor identification amongst HEB target genes that are mutated in Cd3e- /-SCLtgLMO1tg leukemic cells. (B) Enrichment in E boxes within the proximal promoter regions of HEB target genes. (C, D) Expression levels of the indicated TSGenes in TAL1+ vs other molecular subgroups in pediatric T-ALL dataset from Liu et al. (C) and in T-ALL, B-ALL and brain tumors from the Pediatric Cancer Genome Project cohort (D). (E) Chromatin immunoprecipitation of Cdkn1a promoter with HEB and E2A in DN thymocytes. The Rag1 promoter and Rag2 enhancer are included as positive controls (left panel) and RT-PCR analysis of Cdkn1a expression in DN and DP thymocytes in wt and Heb/Tcf12 knockout mice. Amplified bands were revealed by hybridization with an internal 32P-labeled oligonucleotide fragment (right panel). (F) Quantitative RT-PCR analysis of Cdkn1a expression in Cd3e-/- DN3 cells, pre-LSCs and leukemic cells. (G) Kaplan-Meyer survival curves of SCLtgLMO1tg T-ALL with partial and complete loss of Cdkn1a. (H) A tumor suppressor network downstream of HEB or E2A validated by chromatin immunoprecipitation. HEB is autoregulatory but not E2A. *p value < 0.01; ****p value < 0.0001

Similar articles

Cited by

References

    1. Hoang T, Lambert JA, Martin R. SCL/TAL1 in Hematopoiesis and Cellular Reprogramming. Curr Top Dev Biol (2016) 118:163–204. doi: 10.1016/bs.ctdb.2016.01.004 - DOI - PubMed
    1. Gerby B, Tremblay CS, Tremblay M, Rojas-Sutterlin S, Herblot S, Hebert J, et al. . SCL, LMO1 and Notch1 Reprogram Thymocytes Into Self-Renewing Cells. PLoS Genet (2014) 10(12):e1004768. doi: 10.1371/journal.pgen.1004768 - DOI - PMC - PubMed
    1. McCormack MP, Shields BJ, Jackson JT, Nasa C, Shi W, Slater NJ, et al. . Requirement for Lyl1 in a Model of Lmo2-Driven Early T-Cell Precursor ALL. Blood (2013) 122(12):2093–103. doi: 10.1182/blood-2012-09-458570 - DOI - PubMed
    1. Tremblay M, Tremblay CS, Herblot S, Aplan PD, Hebert J, Perreault C, et al. . Modeling T-Cell Acute Lymphoblastic Leukemia Induced by the SCL and LMO1 Oncogenes. Genes Dev (2010) 24(11):1093–105. doi: 10.1101/gad.1897910 - DOI - PMC - PubMed
    1. Cleveland SM, Smith S, Tripathi R, Mathias EM, Goodings C, Elliott N, et al. . Lmo2 Induces Hematopoietic Stem Cell-Like Features in T-Cell Progenitor Cells Prior to Leukemia. Stem Cells (2013) 31(5):882–94. doi: 10.1002/stem.1345 - DOI - PMC - PubMed

Publication types

MeSH terms

Substances

Grants and funding