

Age-Associated Seroprevalence of Coronavirus Antibodies: Population-Based Serosurveys in 2013 and 2020, British Columbia, Canada
- PMID: 35401521
- PMCID: PMC8984254
- DOI: 10.3389/fimmu.2022.836449
Age-Associated Seroprevalence of Coronavirus Antibodies: Population-Based Serosurveys in 2013 and 2020, British Columbia, Canada
Abstract
Background: Older adults have been disproportionately affected during the SARS-CoV-2 pandemic, including higher risk of severe disease and long-COVID. Prior exposure to endemic human coronaviruses (HCoV) may modulate the response to SARS-CoV-2 infection and contribute to age-related observations. We hypothesized that cross-reactive antibodies to SARS-CoV-2 are associated with antibodies to HCoV and that both increase with age.
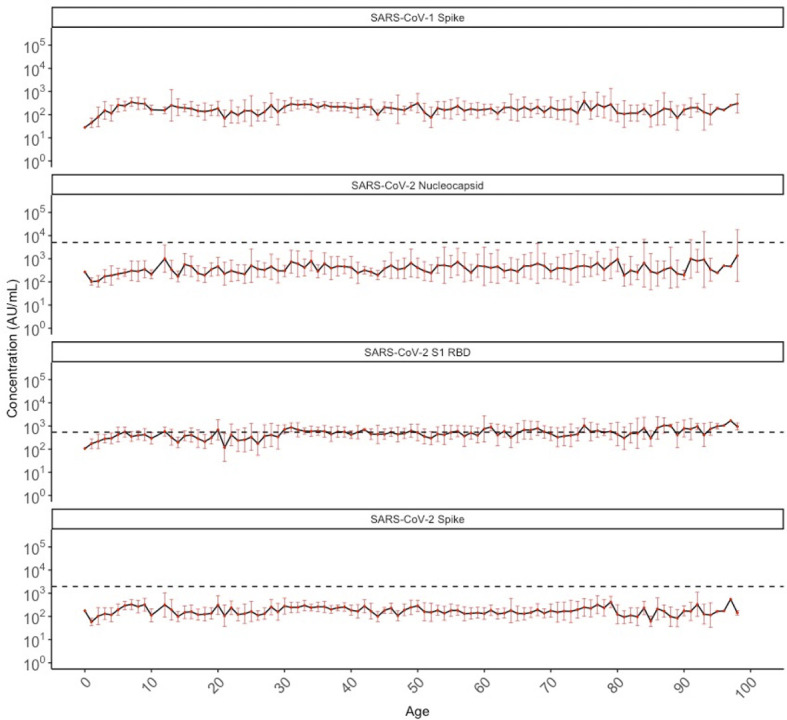
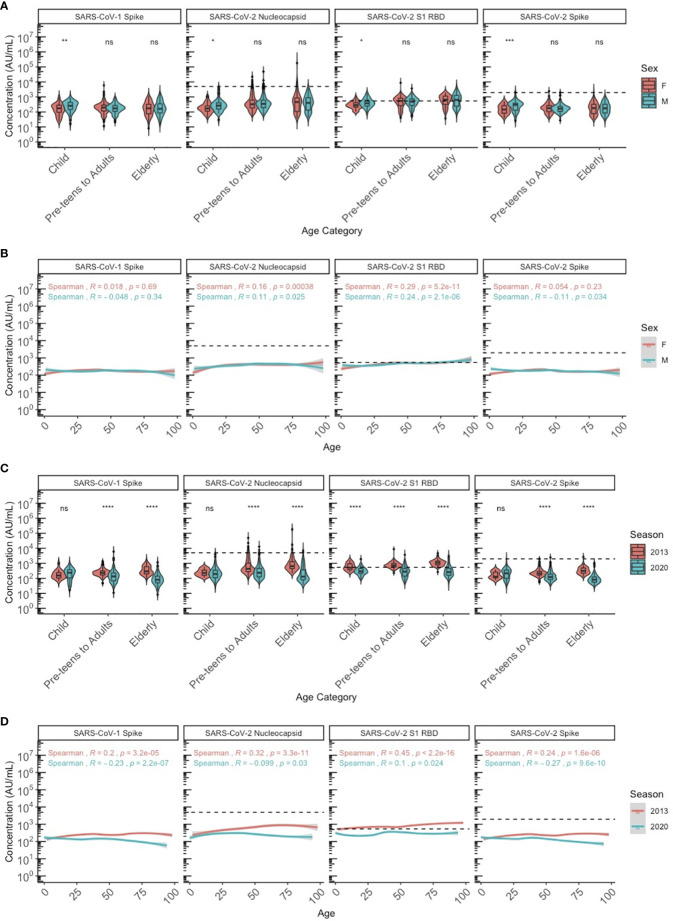
Methods: To assess SARS-CoV-2 unexposed individuals, we drew upon archived anonymized residual sero-surveys conducted in British Columbia (BC), Canada, including before SARS-CoV-2 emergence (May, 2013) and before widespread community circulation in BC (May, 2020). Fifty sera, sex-balanced per ten-year age band, were sought among individuals ≤10 to ≥80 years old, supplemented as indicated by sera from March and September 2020. Sera were tested on the Meso Scale Diagnostics (MSD) electrochemiluminescent multiplex immunoassay to quantify IgG antibody against the Spike proteins of HCoV, including alpha (HCoV-229E, HCoV-NL63) and beta (HCoV-HKU1, HCoV-OC43) viruses, and the 2003 epidemic beta coronavirus, SARS-CoV-1. Cross-reactive antibodies to Spike, Nucleocapsid, and the Receptor Binding Domain (RBD) of SARS-CoV-2 were similarly measured, with SARS-CoV-2 sero-positivity overall defined by positivity on ≥2 targets.
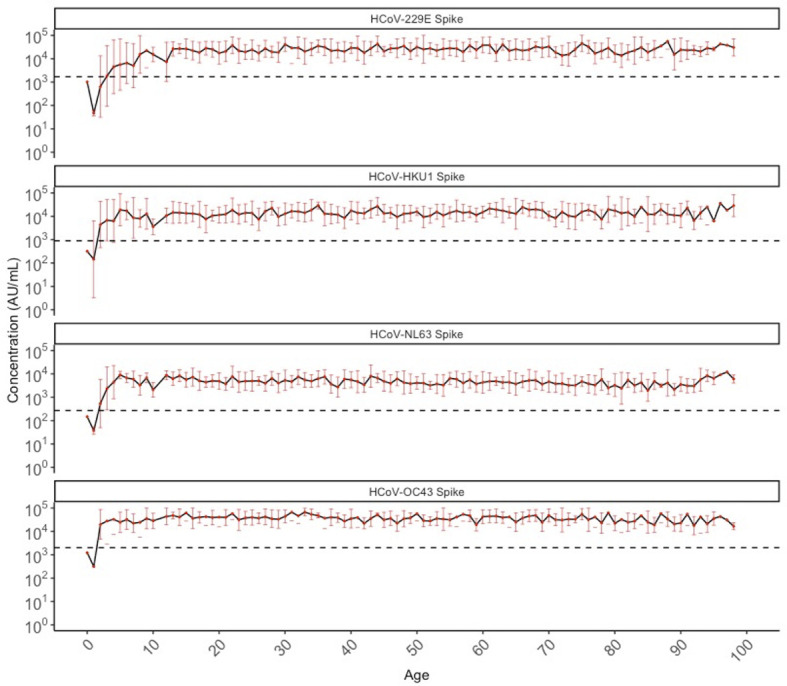
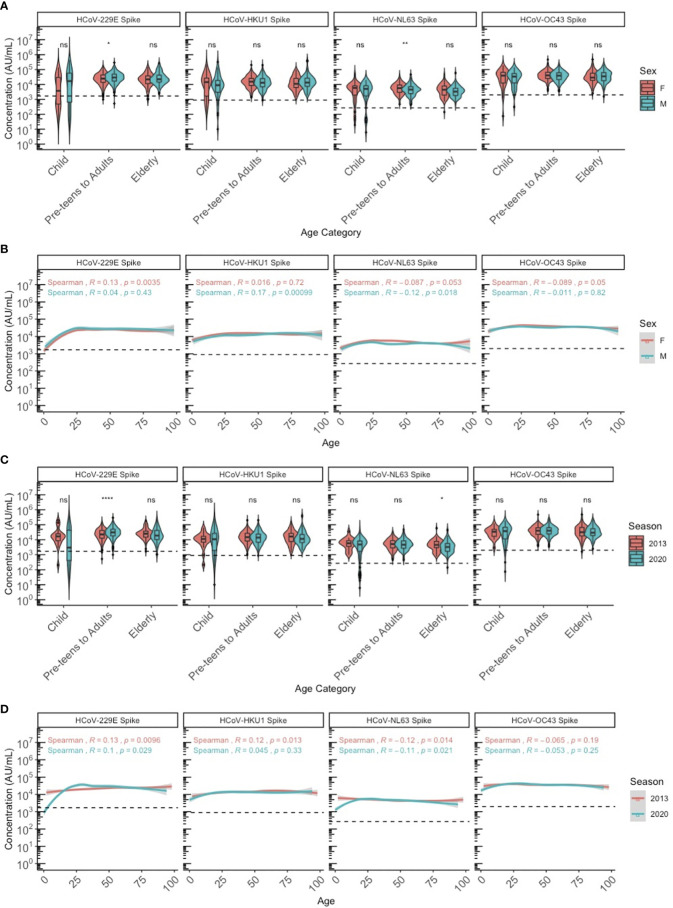
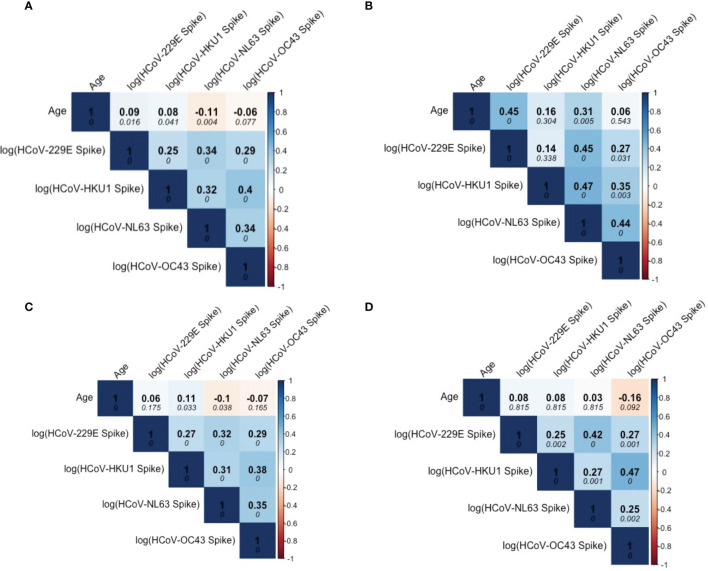
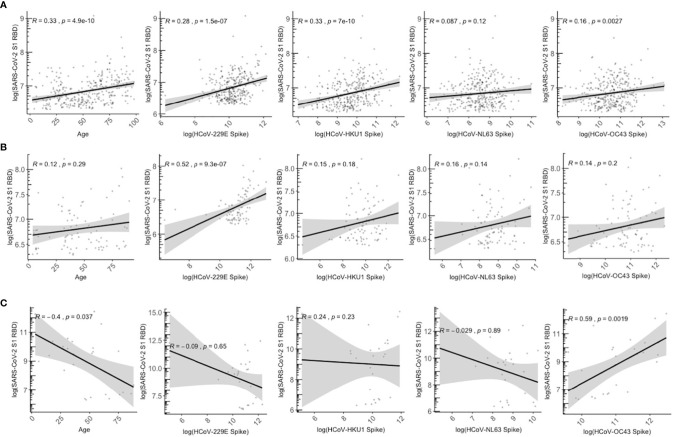
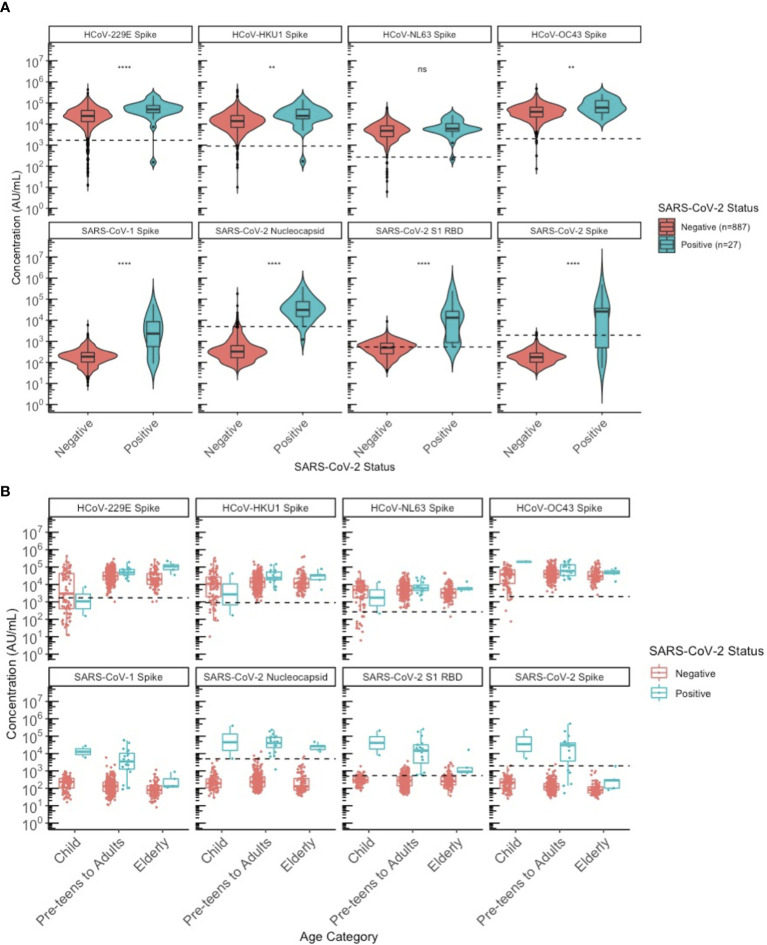
Results: Samples included 407 sera from 2013, of which 17 were children ≤10 years. The 2020 samples included 488 sera, of which 88 were children ≤10 years. Anti-Spike antibodies to all four endemic HCoV were acquired by 10 years of age. There were 20/407 (5%) sera in 2013 and 8/488 (2%) in 2020 that were considered sero-positive for SARS-CoV-2 based on MSD testing. Of note, antibody to the single SARS-CoV-2 RBD target was detected in 329/407 (81%) of 2013 sera and 91/488 (19%) of 2020 sera. Among the SARS-CoV-2 overall sero-negative population, age was correlated with anti-HCoV antibody levels and these, notably 229E and HKU1, were correlated with cross-reactive anti-SARS-CoV-2 RBD titres. SARS-CoV-2 overall sero-positive individuals showed higher titres to HCoV more generally.
Conclusion: Most people have an HCoV priming exposure by 10 years of age and IgG levels are stable thereafter. Anti-HCoV antibodies can cross-react with SARS-CoV-2 epitopes. These immunological interactions warrant further investigation with respect to their implications for COVID-19 clinical outcomes.
Keywords: COVID-19; COVID-19 severity; SARS-CoV-2; antibodies; cross-reactive antibodies; endemic coronavirus; humoral immune response.
Copyright © 2022 Tanunliong, Liu, Kaweski, Irvine, Reyes, Purych, Krajden, Morshed, Sekirov, Gantt, Skowronski and Jassem.
Conflict of interest statement
Author RR was employed by company LifeLabs. The remaining authors declare that the research was conducted in the absence of any commercial or financial relationships that could be construed as a potential conflict of interest.
Figures
Similar articles
-
Detection of Serum Cross-Reactive Antibodies and Memory Response to SARS-CoV-2 in Prepandemic and Post-COVID-19 Convalescent Samples.J Infect Dis. 2021 Oct 28;224(8):1305-1315. doi: 10.1093/infdis/jiab333. J Infect Dis. 2021. PMID: 34161567 Free PMC article.
-
Are higher antibody levels against seasonal human coronaviruses associated with a more robust humoral immune response after SARS-CoV-2 vaccination?Front Immunol. 2022 Sep 8;13:954093. doi: 10.3389/fimmu.2022.954093. eCollection 2022. Front Immunol. 2022. PMID: 36159791 Free PMC article.
-
Anti-RBD IgG antibodies from endemic coronaviruses do not protect against the acquisition of SARS-CoV-2 infection among exposed uninfected individuals.Front Immunol. 2024 May 23;15:1396603. doi: 10.3389/fimmu.2024.1396603. eCollection 2024. Front Immunol. 2024. PMID: 38846944 Free PMC article.
-
An overview on the seven pathogenic human coronaviruses.Rev Med Virol. 2022 Mar;32(2):e2282. doi: 10.1002/rmv.2282. Epub 2021 Aug 2. Rev Med Virol. 2022. PMID: 34339073 Review.
-
Structural proteins of human coronaviruses: what makes them different?Front Cell Infect Microbiol. 2024 Dec 6;14:1458383. doi: 10.3389/fcimb.2024.1458383. eCollection 2024. Front Cell Infect Microbiol. 2024. PMID: 39711780 Free PMC article. Review.
Cited by
-
Characterizing Longitudinal Antibody Responses in Recovered Individuals Following COVID-19 Infection and Single-Dose Vaccination: A Prospective Cohort Study.Viruses. 2022 Oct 31;14(11):2416. doi: 10.3390/v14112416. Viruses. 2022. PMID: 36366515 Free PMC article.
-
Effect of seasonal coronavirus immune imprinting on the immunogenicity of inactivated COVID-19 vaccination.Front Immunol. 2023 Aug 16;14:1195533. doi: 10.3389/fimmu.2023.1195533. eCollection 2023. Front Immunol. 2023. PMID: 37654488 Free PMC article.
-
Antibodies Against SARS-CoV-2 Do Not Cross-React with Endemic Coronaviruses in a Pediatric Population: Data from a Bangladesh Cohort.Viruses. 2025 Jan 24;17(2):161. doi: 10.3390/v17020161. Viruses. 2025. PMID: 40006916 Free PMC article.
-
Seroprevalence of four endemic human coronaviruses and, reactivity and neutralization capability against SARS-CoV-2 among children in the Philippines.Sci Rep. 2023 Feb 9;13(1):2310. doi: 10.1038/s41598-023-29072-3. Sci Rep. 2023. PMID: 36759702 Free PMC article.
-
Is there an immunological cross-reactivity of antibodies to the myelin oligodendrocyte glycoprotein and coronaviruses?Brain Commun. 2024 Mar 25;6(2):fcae106. doi: 10.1093/braincomms/fcae106. eCollection 2024. Brain Commun. 2024. PMID: 38576796 Free PMC article.
References
-
- World Health Organization . WHO Coronavirus (COVID-19) Dashboard. (2021).
-
- Zimmermann P, Curtis N. Why Is COVID-19 Less Severe in Children? A Review of the Proposed Mechanisms Underlying the Age-Related Difference in Severity of SARS-CoV-2 Infections. Vol. 0, Archives of Disease in Childhood. BMJ Publishing Group (2020) 106:429–39. doi: 10.1136/archdischild-2020-320338 - DOI - PubMed
-
- Fosbøl EL, Butt JH, Østergaard L, Andersson C, Selmer C, Kragholm K, et al. . Association of Angiotensin-Converting Enzyme Inhibitor or Angiotensin Receptor Blocker Use With COVID-19 Diagnosis and Mortality. JAMA - J Am Med Assoc (2020) 324(2):168–77. doi: 10.1001/jama.2020.11301 - DOI - PMC - PubMed
Publication types
MeSH terms
Substances
LinkOut - more resources
Full Text Sources
Medical
Miscellaneous