. 2022 Mar 25:13:848886.
doi: 10.3389/fimmu.2022.848886. eCollection 2022.

Persistent Overactive Cytotoxic Immune Response in a Spanish Cohort of Individuals With Long-COVID: Identification of Diagnostic Biomarkers

Affiliations

Persistent Overactive Cytotoxic Immune Response in a Spanish Cohort of Individuals With Long-COVID: Identification of Diagnostic Biomarkers

Miguel Galán et al. Front Immunol. .

Abstract

Long-COVID is a new emerging syndrome worldwide that is characterized by the persistence of unresolved signs and symptoms of COVID-19 more than 4 weeks after the infection and even after more than 12 weeks. The underlying mechanisms for Long-COVID are still undefined, but a sustained inflammatory response caused by the persistence of SARS-CoV-2 in organ and tissue sanctuaries or resemblance with an autoimmune disease are within the most considered hypotheses. In this study, we analyzed the usefulness of several demographic, clinical, and immunological parameters as diagnostic biomarkers of Long-COVID in one cohort of Spanish individuals who presented signs and symptoms of this syndrome after 49 weeks post-infection, in comparison with individuals who recovered completely in the first 12 weeks after the infection. We determined that individuals with Long-COVID showed significantly increased levels of functional memory cells with high antiviral cytotoxic activity such as CD8+ TEMRA cells, CD8±TCRγδ+ cells, and NK cells with CD56+CD57+NKG2C+ phenotype. The persistence of these long-lasting cytotoxic populations was supported by enhanced levels of CD4+ Tregs and the expression of the exhaustion marker PD-1 on the surface of CD3+ T lymphocytes. With the use of these immune parameters and significant clinical features such as lethargy, pleuritic chest pain, and dermatological injuries, as well as demographic factors such as female gender and O+ blood type, a Random Forest algorithm predicted the assignment of the participants in the Long-COVID group with 100% accuracy. The definition of the most accurate diagnostic biomarkers could be helpful to detect the development of Long-COVID and to improve the clinical management of these patients.

Keywords: CD8+ T cells; Long-COVID; NK cells; Random Forest algorithm; cytotoxic immune response; immune exhaustion.


Conflict of interest statement

The authors declare that the research was conducted in the absence of any commercial or financial relationships that could be construed as a potential conflict of interest.

Figures
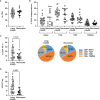
Figure 1
Figure 1
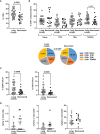
Analysis of CD3+ and CD4+ T-cell populations in PBMCs from the Long-COVID and Recovered groups. Total levels of CD4+ T cells (A) and CD4+ T-cell memory subpopulations (B) were analyzed by flow cytometry. Individual data are shown in a dot plot, and mean data are shown in the pie charts. (C) The expression of the exhaustion marker PD-1 was analyzed in CD3+ T cells. (D) The levels of CD4+ Tregs were also quantified by flow cytometry in both groups of individuals. Each dot in the graphs corresponds to one sample, and lines represent mean ± standard error of the mean (SEM). Statistical significance was calculated using non-parametric Mann–Whitney test. PBMCs, peripheral blood mononuclear cells.
Figure 2
Figure 2
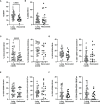
Analysis of CD8+ T-cell populations in PBMCs from the Long-COVID and Recovered groups. Total levels of CD8+ T cells (A) and CD8+ T-cell memory subpopulations (B) were analyzed by flow cytometry. Individual data are shown in a dot plot, and mean data are shown in the pie charts. (C) The levels of CD8 ± TCRγδ+ were also determined by flow cytometry in both groups of individuals. (D) Quantification of the release of pro-inflammatory cytokines IFNg and TNFa, as well as the serine protease GZB from PBMCs from individuals with Long COVID and the Recovered participants after stimulation with a pool of nucleoprotein peptides from SARS-CoV-2. Each dot in the graphs corresponds to one sample, and lines represent mean ± SEM. Statistical significance was calculated using non-parametric Mann–Whitney test. PBMCs, peripheral blood mononuclear cells.
Figure 3
Figure 3
Analysis of NK and NKT cell subpopulations in PBMCs from the Long-COVID and Recovered groups. Total levels of CD56+ NK/NKT cells were analyzed by flow cytometry (A), as well as the expression of the exhaustion marker PD-1 in CD56+ T cells (B). Total levels of NK cell subpopulation CD56+CD16+ over CD3 population or with the degranulation marker CD107a over this population CD3CD56+CD16+ (C) and total levels of NK cell subpopulation CD56+CD16 over CD3 population or with the degranulation marker CD107a over this population CD3CD56+CD16 (D) were also analyzed by flow cytometry. Analysis by flow cytometry of the total levels of NKT cell subpopulation CD56+CD16+ over CD3+ population or with the degranulation marker CD107a over this population CD3+CD56+CD16+ (E) and total levels of NKT cell subpopulation CD56+CD16 over CD3+ population or with the degranulation marker CD107a over this population CD3+CD56+CD16 (F). Each dot in the graphs corresponds to one sample, and lines represent mean ± SEM. Statistical significance was calculated using non-parametric Mann–Whitney test. PBMCs, peripheral blood mononuclear cells.
Figure 4
Figure 4
Analysis of the expression of NK cell markers in PBMCs from the Long-COVID and Recovered groups. (A) Analysis by flow cytometry of the expression of the activating receptor NKG2C and the inhibitory receptors NKG2A and KIR2DL5/CD158f on the surface of total CD56+ cells. (B) Analysis by flow cytometry of the expression of the activating receptor NKG2C and the memory marker CD57 on the surface of total CD56+ cells. Each dot in the graphs corresponds to one sample, and lines represent mean ± SEM. Statistical significance was calculated using non-parametric Mann–Whitney test. PBMCs, peripheral blood mononuclear cells.
Figure 5
Figure 5
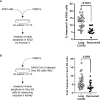
Measurement of cytotoxic activity of PBMCs from the Long-COVID and Recovered groups. (A) Diagram (left) and dot plot graph (right) of the assay for the quantification by flow cytometry of Annexin V binding to K562 cells cocultured with PBMCs (1:2) from the Long-COVID and Recovered groups for 1 h (B) Diagram (left) and dot plot graph (right) of the assay for the quantification by chemiluminescence of caspase-3 activation in a monolayer of SARS-CoV-2-infected Vero E6 cells cocultured with PBMCs (1:2) from the Long-COVID and Recovered groups for 1 h Each dot in the graphs corresponds to one sample, and lines represent mean ± SEM. Statistical significance was calculated using non-parametric Mann–Whitney test. PBMCs, peripheral blood mononuclear cells.
Figure 6
Figure 6
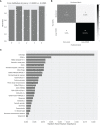
Application of Random Forest algorithm and Gini VIM method for the evaluation of the importance of demographic, clinical, and immunological parameters with statistical significance as diagnostic biomarkers for Long-COVID. (A) Calculation of the accuracy for 5 iterations of the outer loop of the nested K-fold cross validation. (B) Confusion matrix confronting the conditions predicted by the algorithm and the true conditions for the correct assignment of the participants to the Long-COVID group or the Recovered group. (C) Classification of the demographic, clinical, and immunological features with statistical significance according to their importance to predict the correct classification of the individuals to the Long-COVID group or the Recovered group. VIM, Variable Importance Measure.

References

    1. WHO . Coronavirus (COVID-19) Dashboard. Available at: https://covid19.who.int/.
    1. Kandeel M, Mohamed MEM, Abd El-Lateef HM, Venugopala KN, El-Beltagi HS. Omicron Variant Genome Evolution and Phylogenetics. J Med Virol (2021) 94(4):1627–32. doi: 10.1002/jmv.27515 - DOI - PMC - PubMed
    1. Chen N, Zhou M, Dong X, Qu J, Gong F, Han Y, et al. . Epidemiological and Clinical Characteristics of 99 Cases of 2019 Novel Coronavirus Pneumonia in Wuhan, China: A Descriptive Study. Lancet (2020) 395:507–13. doi: 10.1016/S0140-6736(20)30211-7 - DOI - PMC - PubMed
    1. Vigón L, Fuertes D, García-Pérez J, Torres M, Rodríguez-Mora S, Mateos E, et al. . Impaired Cytotoxic Response in PBMCs From Patients With COVID-19 Admitted to the ICU: Biomarkers to Predict Disease Severity. Front Immunol (2021) 12:665329:665329. doi: 10.3389/fimmu.2021.665329 - DOI - PMC - PubMed
    1. Oronsky B, Larson C, Hammond TC, Oronsky A, Kesari S, Lybeck M. Reid TR. A Review of Persistent Post-COVID Syndrome (PPCS). Clin Rev Allergy Immunol (2021) 20:1–9. doi: 10.1007/s12016-021-08848-3 - DOI - PMC - PubMed

Publication types