. 2022 Mar 24:13:863096.
doi: 10.3389/fimmu.2022.863096. eCollection 2022.

Zebrafish as a Vertebrate Model for Studying Nodavirus Infections

Affiliations

Zebrafish as a Vertebrate Model for Studying Nodavirus Infections

Raquel Lama et al. Front Immunol. .

Abstract

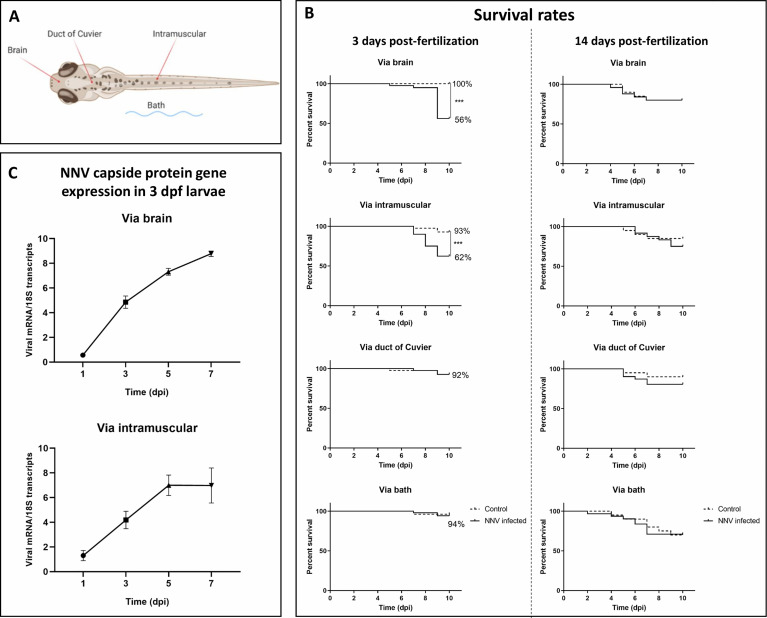
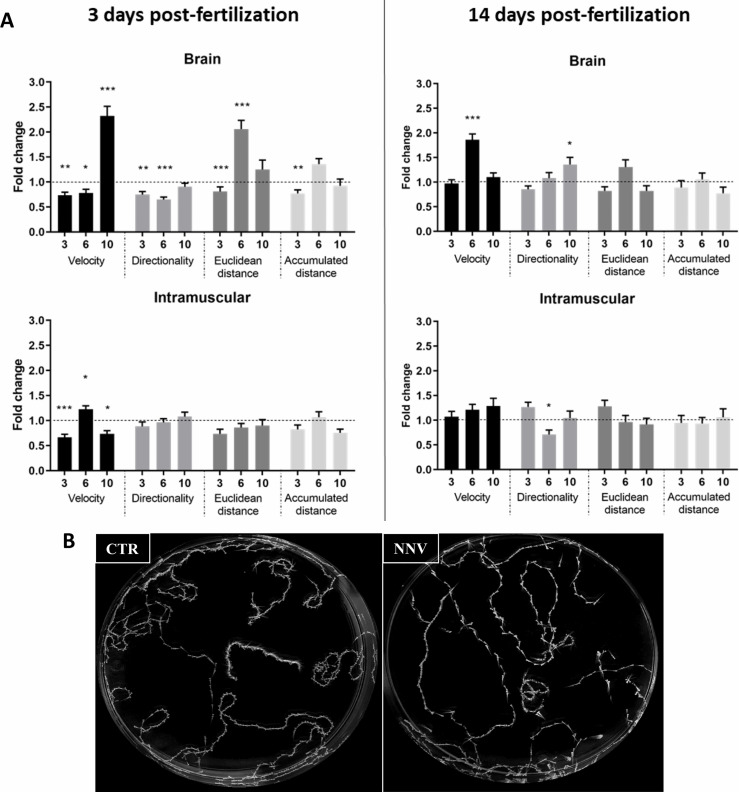
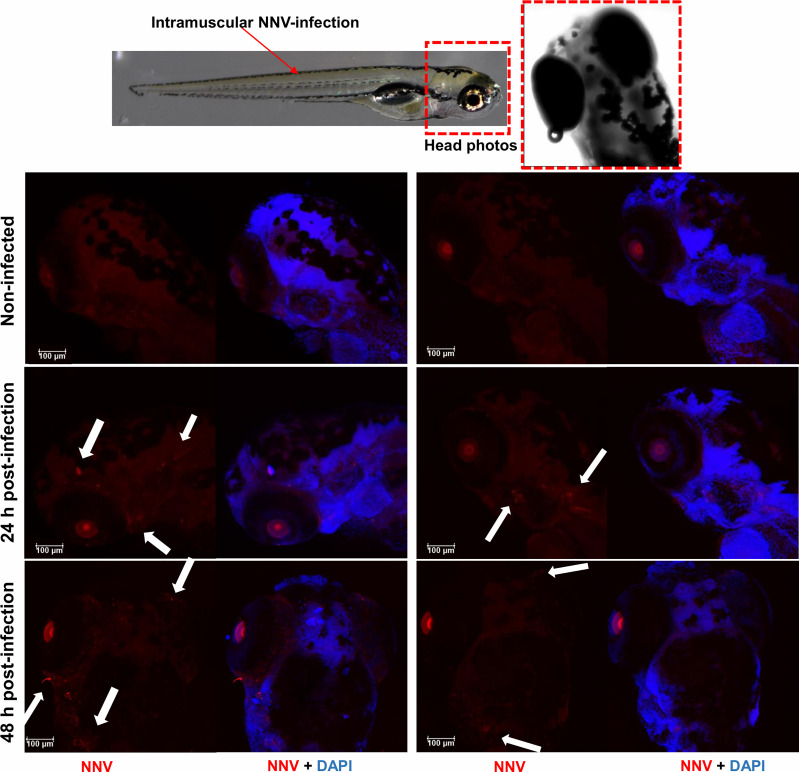
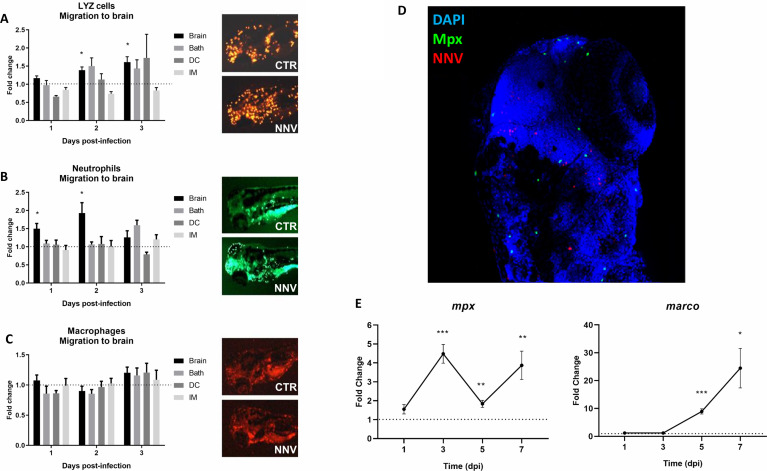
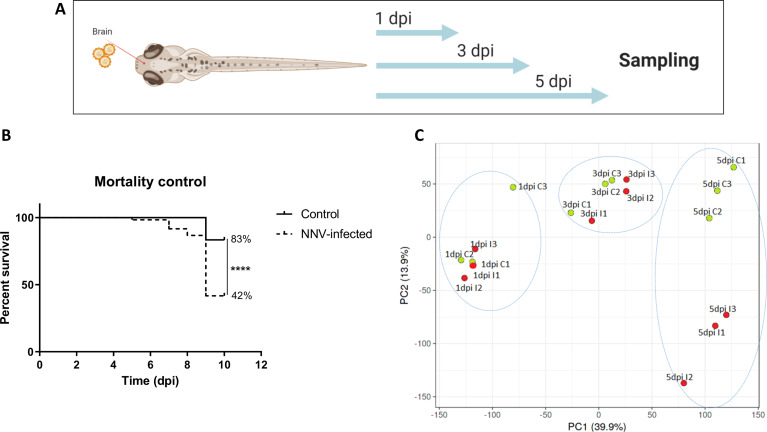
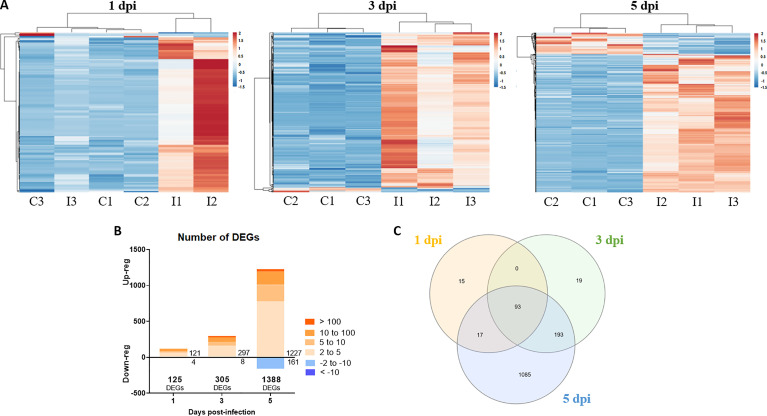
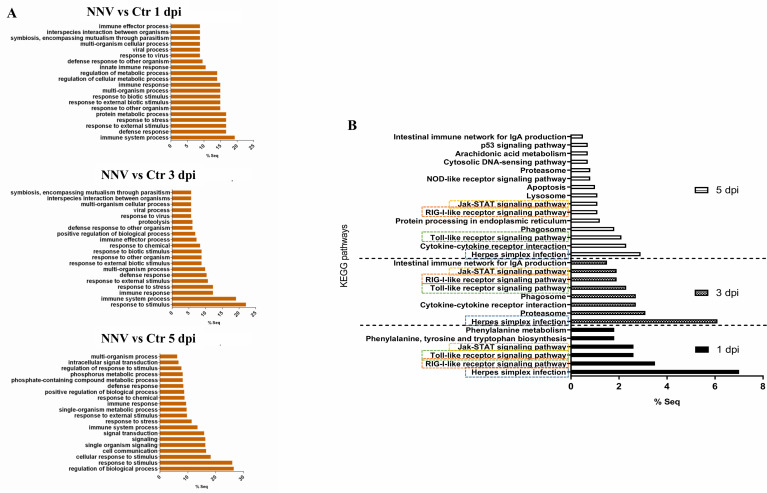
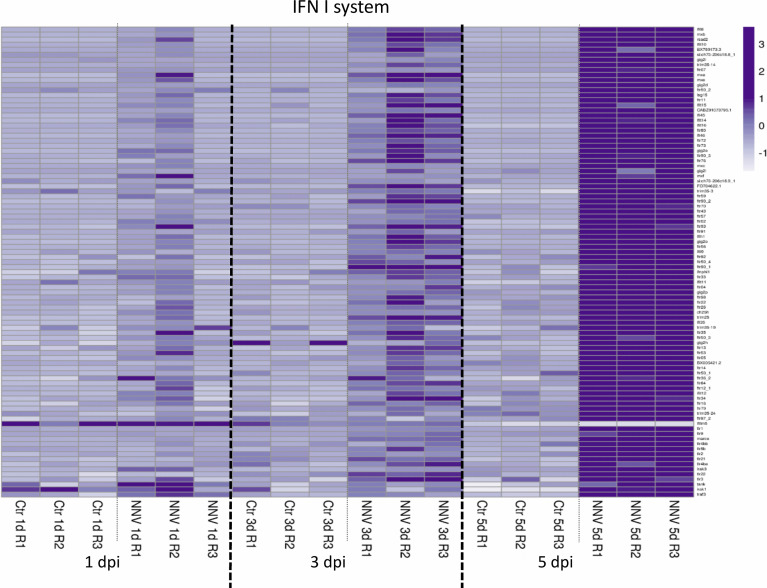
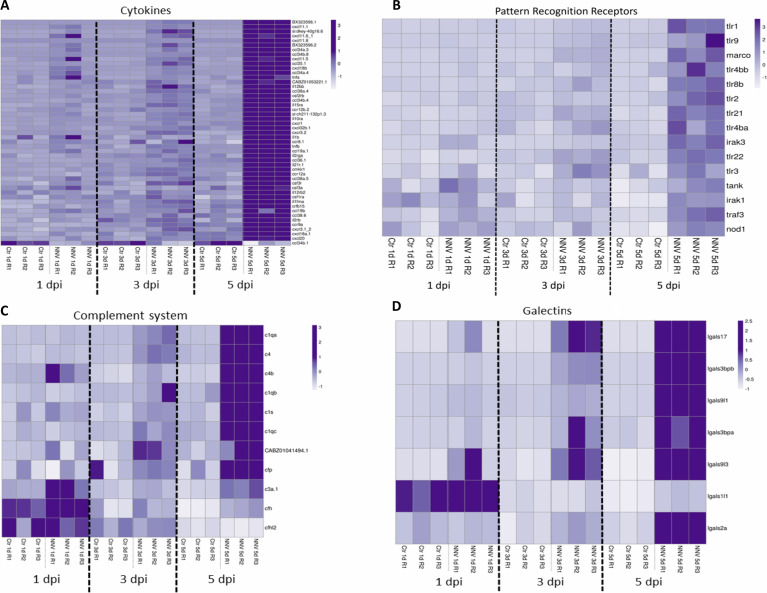
Nervous necrosis virus (NNV) is a neurotropic pathogenic virus affecting a multitude of marine and freshwater fish species that has a high economic impact on aquaculture farms worldwide. Therefore, the development of new tools and strategies aimed at reducing the mortality caused by this virus is a pivotal need. Although zebrafish is not considered a natural host for NNV, the numerous experimental advantages of this species make zebrafish an attractive model for studying different aspects of the disease caused by NNV, viral encephalopathy and retinopathy (VER). In this work, we established the best way and age to infect zebrafish larvae with NNV, obtaining significant mortalities in 3-day-postfertilization larvae when the virus was inoculated directly into the brain or by intramuscular microinjection. As occurs in naturally susceptible fish species, we confirmed that after intramuscular injection the virus was able to migrate to the central nervous system (CNS). As expected, due to the severe damage that this virus causes to the CNS, alterations in the swimming behavior of the zebrafish larvae were also observed. Taking advantage of the existence of transgenic fluorescent zebrafish lines, we were able to track the migration of different innate immune cells, mainly neutrophils, to the site of infection with NNV via the brain. However, we did not observe colocalization between the viral particles and neutrophils. RNA-Seq analysis of NNV-infected and uninfected larvae at 1, 3 and 5 days postinfection (dpi) revealed a powerful modulation of the antiviral immune response, especially at 5 dpi. We found that this response was dominated by, though not restricted to, the type I interferon system, the major defence mechanism in the innate immune response against viral pathogens. Therefore, as zebrafish larvae are able to develop the main characteristic of NNV infection and respond with an efficient immune arsenal, we confirmed the suitability of zebrafish larvae for modelling VER disease and studying different aspects of NNV pathogenesis, immune response and screening of antiviral drugs.

Keywords: RNA-Seq; immune response; nodavirus; viral encephalopathy and retinopathy (VER); zebrafish.


Conflict of interest statement

The authors declare that the research was conducted in the absence of any commercial or financial relationships that could be construed as a potential conflict of interest.

Figures

Figure 1
Figure 1
Survival rates of zebrafish larvae challenged with NNV through different infection routes and NNV replication. (A) Schematic representation of the different infection routes used to determine the susceptibility of zebrafish larvae to NNV. (B) Kaplan–Meier survival curves of NNV-infected and uninfected larvae in 3- and 14-dpf larvae. Mortality was registered during the next 10 dpi. (C) Quantification of NNV capsid protein gene expression in 3-dpf larvae infected via the brain or intramuscularly at different sampling points through qPCR; data are presented as the mean ± SEM of biological replicates. Statistically significant differences are displayed as follows: ***, 0.0001 > p value > 0.001.
Figure 2
Figure 2
Image analysis of the swimming behavior of zebrafish larvae (3 and 14 dpf) infected with NNV via brain or IM. (A) Comparison of velocity, directionality, accumulated distance and Euclidean distance parameters between NNV-infected and the corresponding uninfected control larvae. Video tracking of zebrafish larvae was conducted at different times postinfection (3, 6, and 10 dpi). The fold change (FC) of infected larvae compared with their uninfected control (Control FC = 1, dotted lines) was calculated. The graphs represent the mean ± SEM of the biological replicates. Statistically significant differences are displayed as follows: ***, 0.0001 > p value > 0.001; **, 0.001 > p value > 0.01; *, 0.01 > p value > 0.05. (B) Example of maximal projection of the video recorded for 3-dpf larvae infected via brain and the corresponding controls at 6 dpi.
Figure 3
Figure 3
Whole-mount immunofluorescence of zebrafish larvae infected by intramuscular microinjection with NNV. Confocal images of the head from uninfected and NNV-infected larvae at 24 and 48 hpi. NNV particles are stained red, and cell nuclei are stained blue (DAPI). White arrows denote the position of NNV-infected cells.
Figure 4
Figure 4
Visualization and analysis of innate immune cell migration to the head of 3 pdf larvae infected through different routes. The transgenic zebrafish lines (A) Tg(lyz:DsRed2), (B) Tg(mpx:GFP) and (C) Tg(mpeg:mCherry) were used to analyse the migration of myeloid precursors with lysozyme activity, neutrophils and macrophages, respectively, to the cephalic region. Larvae were infected through the 4 infection routes analysed in this study, and the cells were counted at 1, 2 and 3 dpi. Fluorescent immune cells were counted using ImageJ, and the graphs represent the difference in fold change of the number of cells located in the head from infected larvae compared to their corresponding uninfected control larvae (control FC = 1 in the dotted line). Representative images of the three transgenic lines at 2 dpi were included. (D) Whole-mount immunofluorescence of Tg(mpx:GFP) transgenic larvae infected via the brain with NNV at 1 dpi; neutrophils are displayed in green, NNV are displayed in red, and nuclei are displayed in blue. No colocalization between NNV particles and neutrophils was observed. (E) Expression analysis of marker genes of the two major innate immune cells (mpx – neutrophils, marco – macrophages) in NNV-infected and uninfected larvae at different times postinfection. Each sample (5 biological replicates, pools of 4 larvae each) was normalized to the 18S gene. The normalized expression values were standardized against their respective controls (Control FC = 1, dotted lines). For (A–C, E), the graphs represent the mean ± SEM of the biological replicates. Statistically significant differences are displayed as follows: ***, 0.0001 > p value > 0.001; **, 0.001 > p value > 0.01; *, 0.01 > p value > 0.05.
Figure 5
Figure 5
Transcriptome analysis of 3-dpf zebrafish larvae infected with NNV via the brain. (A) RNA-Seq experimental design: Zebrafish larvae were microinjected via the brain, and three pools of infected and uninfected larvae were sampled at 1, 3, and 5 days postinfection for RNA isolation and Illumina sequencing. (B) Kaplan–Meier survival curves of NNV-infected and uninfected larvae conducted in parallel to RNA-Seq sampling. Statistically significant differences are displayed as follows: ****, p value < 0.0001. (C) Principal component analysis (PCA) of the samples.
Figure 6
Figure 6
Differentially expressed genes in zebrafish larvae infected with NNV. (A) Heatmaps representing the TPM expression values of the DEGs (FC > |2|; FDR < 0.05) modulated at 1, 3 and 5 dpi. Expression levels are represented as row-normalized values on a blue–red colour scale. (B) Stacked column chart reflecting the number and intensity (in FC value) of the DEGs identified at the 3 sampling points. (C) Venn diagram reflecting the common and exclusive DEGs at each sampling point.
Figure 7
Figure 7
GO terms and KEGG pathways enriched during NNV infection of zebrafish larvae. (A) GO biological process terms significantly enriched at 1, 3, and 5 dpi. (B) KEGG pathways enriched at 1, 3, and 5 dpi; the four common pathways significantly enriched over time are boxed.
Figure 8
Figure 8
Heatmap representing the DEGs linked to the type I IFN system at 1, 3, and 5 dpi. A heatmap was constructed with the TPM expression values of the DEGs. Expression levels are represented as row-normalized values on a white–purple colour scale.
Figure 9
Figure 9
Heatmaps representing the DEGs belonging to different immune categories at 1, 3 and 5 dpi: (A) cytokines; (B) pattern recognition receptors; (C) complement system; and (D) galectins. Heatmaps were constructed with the TPM expression values of the DEGs. Expression levels are represented as row-normalized values on a white–purple colour scale.

References

    1. Kanther M, Rawls JF. Host-Microbe Interactions in the Developing Zebrafish. Host-Microbe Interactions in the Developing Zebrafish. Curr Opin Immunol (2010) 22:10–9. doi: 10.1016/j.coi.2010.01.006 - DOI - PMC - PubMed
    1. Novoa B, Figueras A. Zebrafish: Model for the Study of Inflammation and the Innate Immune Response to Infectious Diseases. Adv Exp Med Biol (2012) 946:253–75. doi: 10.1007/978-1-4614-0106-3_15 - DOI - PubMed
    1. Lam S, Chua H, Gong Z, Lam T, Sin Y. Development and Maturation of the Immune System in Zebrafish, Danio Rerio: A Gene Expression Profiling, in Situ Hybridization and Immunological Study. Dev Comp Immunol (2004) 28:9–28. doi: 10.1016/s0145-305x(03)00103-4 - DOI - PubMed
    1. Herbomel P, Thisse B, Thisse C. Ontogeny and Behaviour of Early Macrophages in the Zebrafish Embryo. Development (1999) 126:3735–45. doi: 10.1242/dev.126.17.3735 - DOI - PubMed
    1. Le Guyader D, Redd MJ, Colucci-Guyon E, Murayama E, Kissa K, Biolat V, et al. . Origins and Unconventional Behavior of Neutrophils in Developing Zebrafish. Blood (2008) 111:132–41. doi: 10.1182/blood-2007-06-095398 - DOI - PubMed

Publication types

Substances