

Protein Disulfide-Isomerase A3 Is a Robust Prognostic Biomarker for Cancers and Predicts the Immunotherapy Response Effectively
- PMID: 35401558
- PMCID: PMC8989738
- DOI: 10.3389/fimmu.2022.837512
Protein Disulfide-Isomerase A3 Is a Robust Prognostic Biomarker for Cancers and Predicts the Immunotherapy Response Effectively
Abstract
Background: Protein disulfide isomerase A3 (PDIA3) is a member of the protein disulfide isomerase (PDI) family that participates in protein folding through its protein disulfide isomerase function. It has been reported to regulate the progression of several cancers, but its function in cancer immunotherapy is unknown.
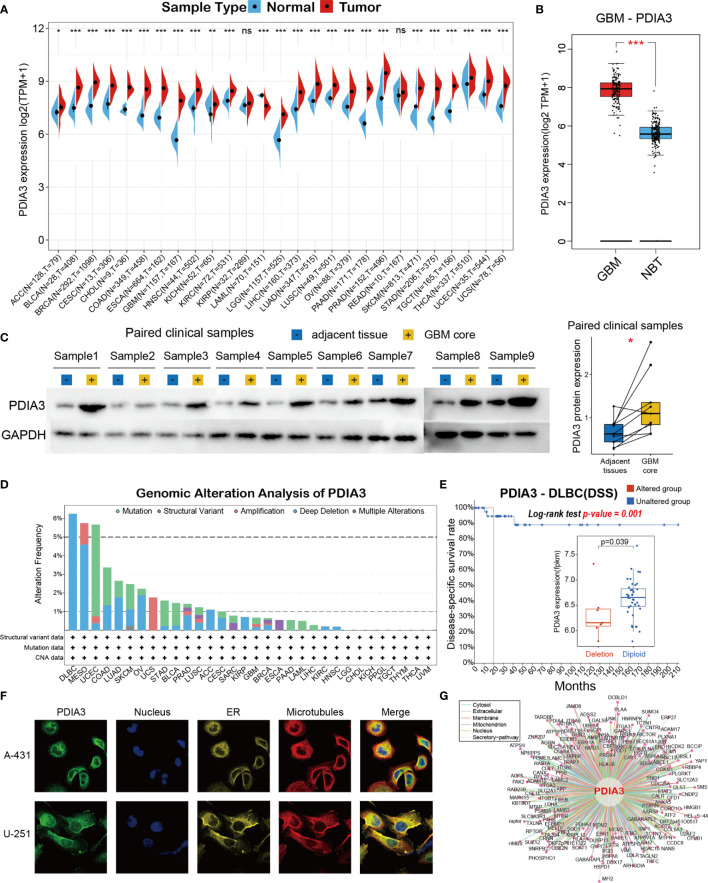
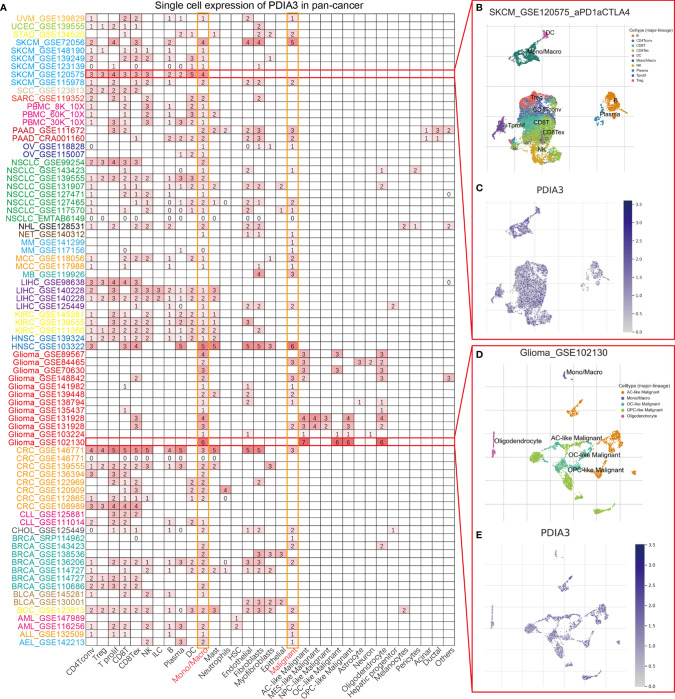
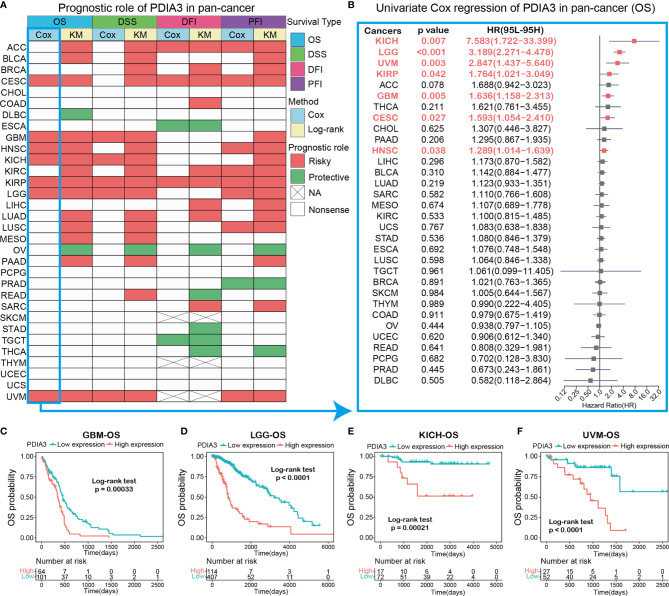
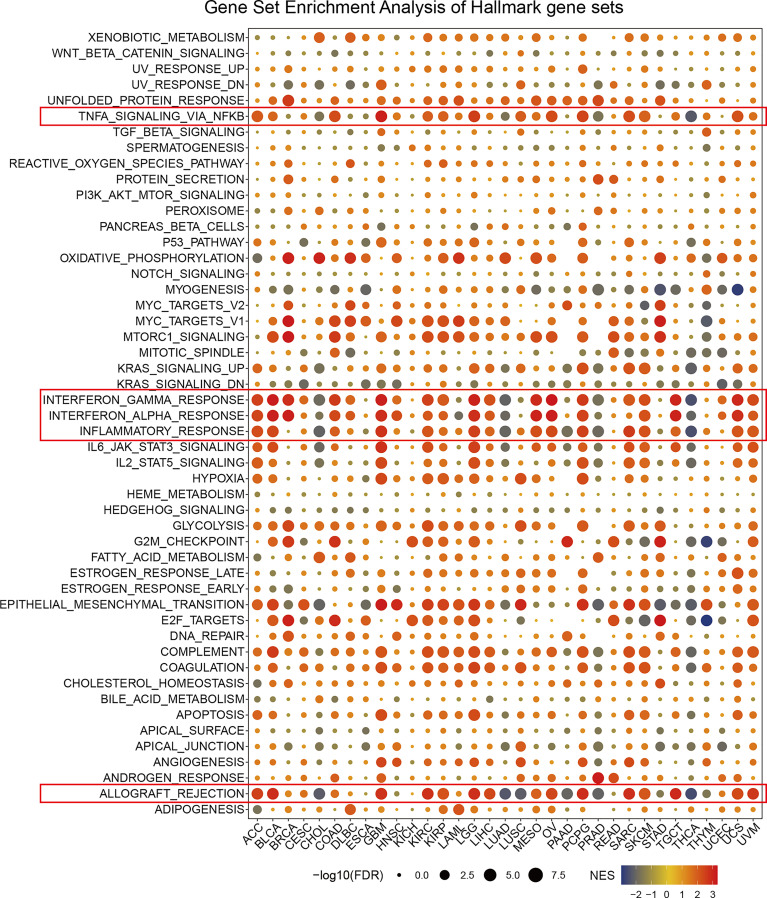
Methods: The RNA-seq data of cancer and normal tissues were downloaded from The Cancer Genome Atlas (TCGA) and the Genotype-Tissue Expression (GTEx) databases. The Cbioportal dataset was used to explore the genomic alteration information of PDIA3 in pan-cancer. Human Protein Atlas (HPA) and ComPPI websites were employed to mine the protein information of PDIA3, and western blot assay was performed to monitor the upregulated PDIA3 expression in clinical GBM samples. The univariate Cox regression and the Kaplan-Meier method were utilized to appraise the prognostic role of PDIA3 in pan-cancer. Gene Set Enrichment Analysis (GSEA) was applied to search the associated cancer hallmarks with PDIA3 expression. TIMER2.0 was the main platform to investigate the immune cell infiltrations related to PDIA3 in pan-cancer. The associations between PDIA3 and immunotherapy biomarkers were performed by Spearman correlation analysis. The immunoblot was used to quantify the PDIA3 expression levels, and the proliferative and invasive ability of glioma cells was determined by colony formation and transwell assays.
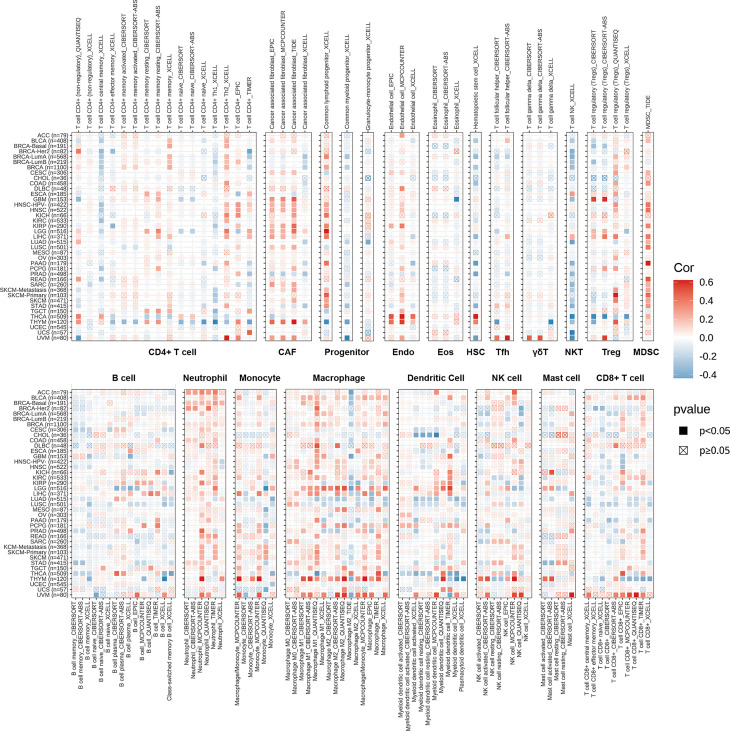
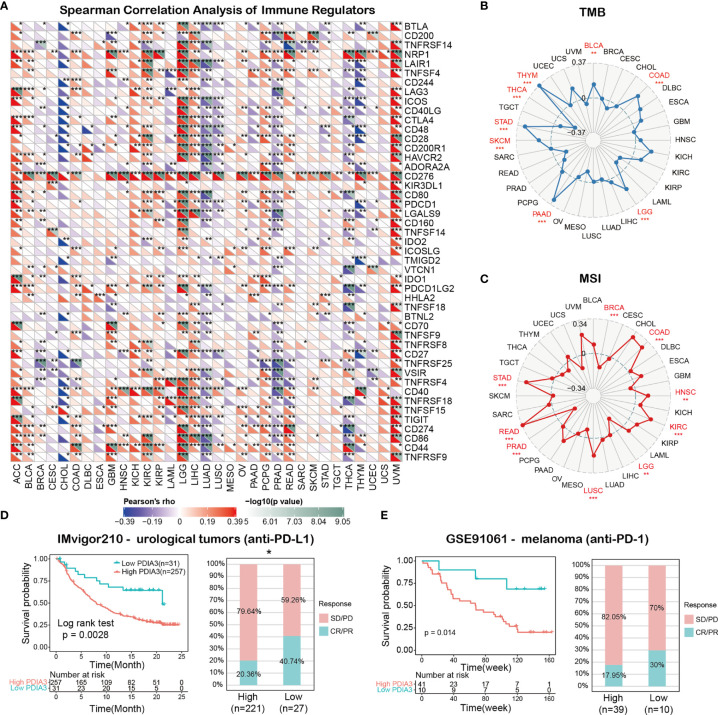
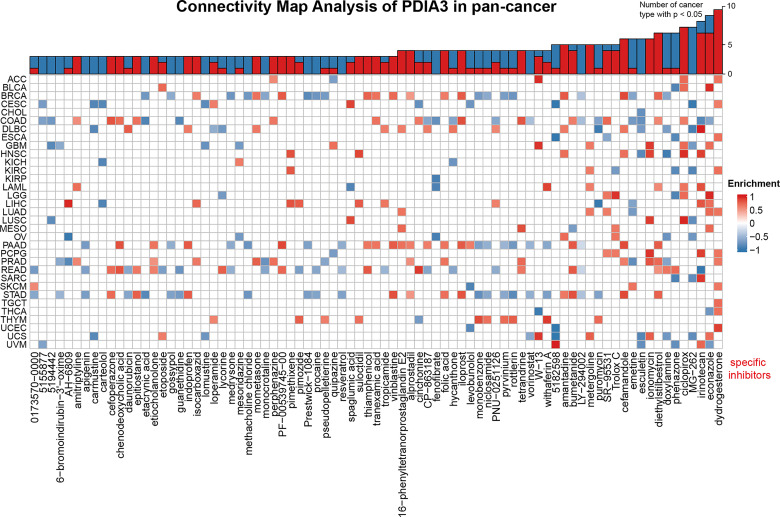
Findings: PDIA3 is overexpressed in most cancer types and exhibits prognosis predictive ability in various cancers, and it is especially expressed in the malignant cells and monocytes/macrophages. In addition, PDIA3 is significantly correlated with immune-activated hallmarks, cancer immune cell infiltrations, and immunoregulators, and the most interesting finding is that PDIA3 could significantly predict anti-PDL1 therapy response. Besides, specific inhibitors that correlated with PDIA3 expression in different cancer types were also screened by using Connectivity Map (CMap). Finally, knockdown of PDIA3 significantly weakened the proliferative and invasive ability of glioma cells.
Interpretation: The results revealed that PDIA3 acts as a robust tumor biomarker. Its function in protein disulfide linkage regulation could influence protein synthesis, degradation, and secretion, and then shapes the tumor microenvironment, which might be further applied to develop novel anticancer inhibitors.
Keywords: CMap.; immunotherapy response; pan-cancer; prognostic biomarker; protein disulfide-isomerase A3 (PDIA3).
Copyright © 2022 Tu, Ouyang, Long, Wu, Li, Zhu and Huang.
Conflict of interest statement
The authors declare that the research was conducted in the absence of any commercial or financial relationships that could be construed as a potential conflict of interest.
Figures
Similar articles
-
Sperm Autoantigenic Protein 17 Predicts the Prognosis and the Immunotherapy Response of Cancers: A Pan-Cancer Analysis.Front Immunol. 2022 May 3;13:844736. doi: 10.3389/fimmu.2022.844736. eCollection 2022. Front Immunol. 2022. PMID: 35592314 Free PMC article.
-
Pan-Cancer Analysis of PDIA3: Identifying It as a Potential Biomarker for Tumor Prognosis and Immunotherapy.Oxid Med Cell Longev. 2022 Aug 22;2022:9614819. doi: 10.1155/2022/9614819. eCollection 2022. Oxid Med Cell Longev. 2022. PMID: 36046686 Free PMC article.
-
The cell senescence regulator p16 is a promising cancer prognostic and immune check-point inhibitor (ICI) therapy biomarker.Aging (Albany NY). 2023 Mar 23;15(6):2136-2157. doi: 10.18632/aging.204601. Epub 2023 Mar 23. Aging (Albany NY). 2023. PMID: 36961395 Free PMC article.
-
PDIA3: Structure, functions and its potential role in viral infections.Biomed Pharmacother. 2021 Nov;143:112110. doi: 10.1016/j.biopha.2021.112110. Epub 2021 Aug 30. Biomed Pharmacother. 2021. PMID: 34474345 Review.
-
Cell Division Cycle-Associated Protein 3 (CDCA3) Is a Potential Biomarker for Clinical Prognosis and Immunotherapy in Pan-Cancer.Biomed Res Int. 2022 Aug 30;2022:4632453. doi: 10.1155/2022/4632453. eCollection 2022. Biomed Res Int. 2022. Retraction in: Biomed Res Int. 2023 Jun 21;2023:9870382. doi: 10.1155/2023/9870382. PMID: 36082153 Free PMC article. Retracted. Review.
Cited by
-
Understanding the immunosuppressive microenvironment of glioma: mechanistic insights and clinical perspectives.J Hematol Oncol. 2024 May 8;17(1):31. doi: 10.1186/s13045-024-01544-7. J Hematol Oncol. 2024. PMID: 38720342 Free PMC article. Review.
-
Expression and Prognostic Significance of PDIA3 in Cervical Cancer.Int J Genomics. 2022 Nov 11;2022:4382645. doi: 10.1155/2022/4382645. eCollection 2022. Int J Genomics. 2022. PMID: 36406049 Free PMC article.
-
Upregulated Immunogenic Cell-Death-Associated Gene Signature Predicts Reduced Responsiveness to Immune-Checkpoint-Blockade Therapy and Poor Prognosis in High-Grade Gliomas.Cells. 2022 Nov 17;11(22):3655. doi: 10.3390/cells11223655. Cells. 2022. PMID: 36429083 Free PMC article.
-
Predictive value of PIMREG in the prognosis and response to immune checkpoint blockade of glioma patients.Front Immunol. 2022 Jul 15;13:946692. doi: 10.3389/fimmu.2022.946692. eCollection 2022. Front Immunol. 2022. PMID: 35928818 Free PMC article.
-
Clinicopathological significance of protein disulphide isomerase A3 and phosphorylated signal transducer and activator of transcription 3 in cervical carcinoma.Contemp Oncol (Pozn). 2024;28(1):51-62. doi: 10.5114/wo.2024.139368. Epub 2024 May 3. Contemp Oncol (Pozn). 2024. PMID: 38800530 Free PMC article.
References
Publication types
MeSH terms
Substances
LinkOut - more resources
Full Text Sources
Research Materials
Miscellaneous