

Local Innate Markers and Vaginal Microbiota Composition Are Influenced by Hormonal Cycle Phases
- PMID: 35401577
- PMCID: PMC8990777
- DOI: 10.3389/fimmu.2022.841723
Local Innate Markers and Vaginal Microbiota Composition Are Influenced by Hormonal Cycle Phases
Abstract
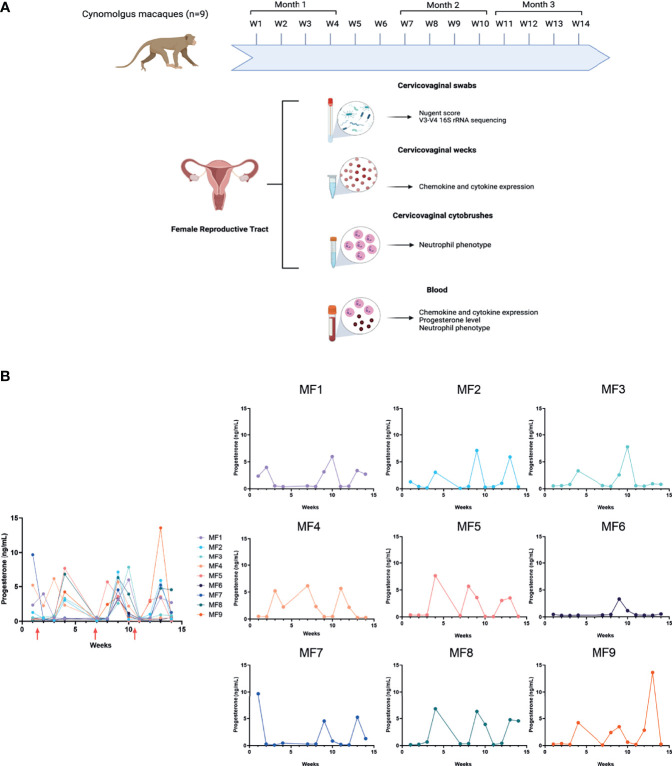
Background: The female reproductive tract (FRT) mucosa is the first line of defense against sexually transmitted infection (STI). FRT environmental factors, including immune-cell composition and the vaginal microbiota, interact with each other to modulate susceptibility to STIs. Moreover, the menstrual cycle induces important modifications within the FRT mucosa. Cynomolgus macaques are used as a model for the pathogenesis and prophylaxis of STIs. In addition, their menstrual cycle and FRT morphology are similar to women. The cynomolgus macaque vaginal microbiota is highly diverse and similar to dysbiotic vaginal microbiota observed in women. However, the impact of the menstrual cycle on immune markers and the vaginal microbiota in female cynomolgus macaques is unknown. We conducted a longitudinal study covering three menstrual cycles in cynomolgus macaques. The evolution of the composition of the vaginal microbiota and inflammation (cytokine/chemokine profile and neutrophil phenotype) in the FRT and blood was determined throughout the menstrual cycle.
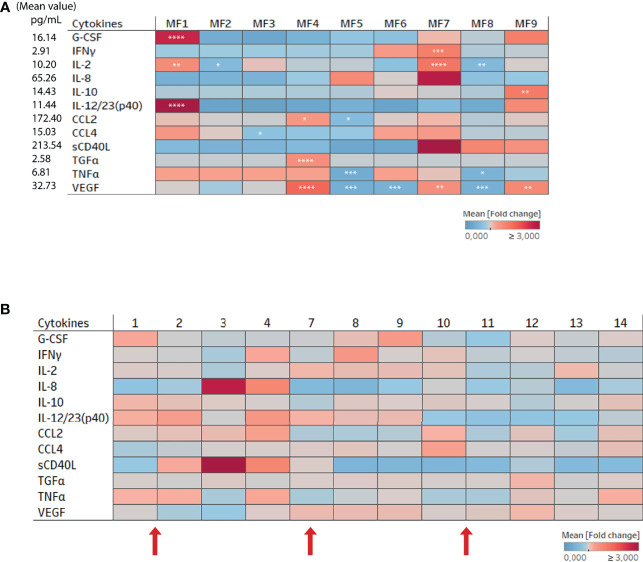
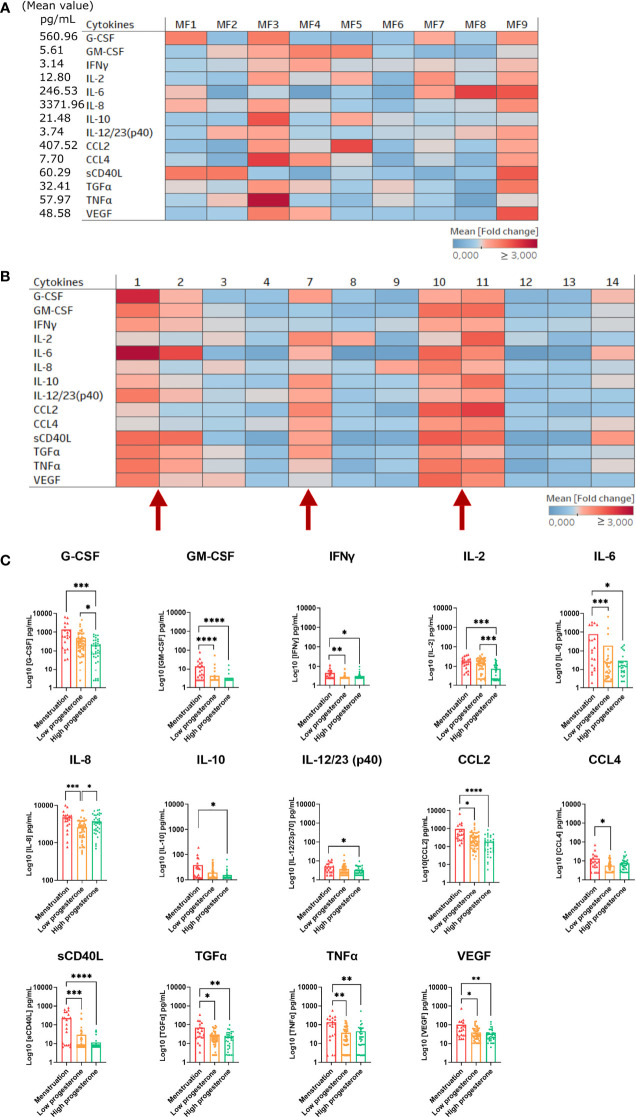
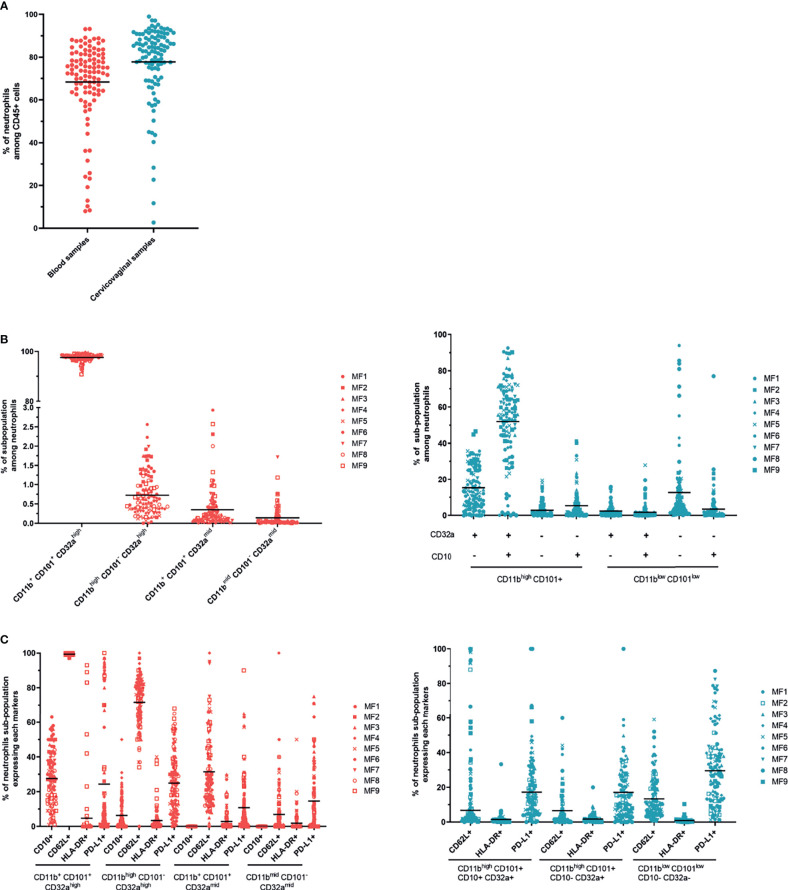
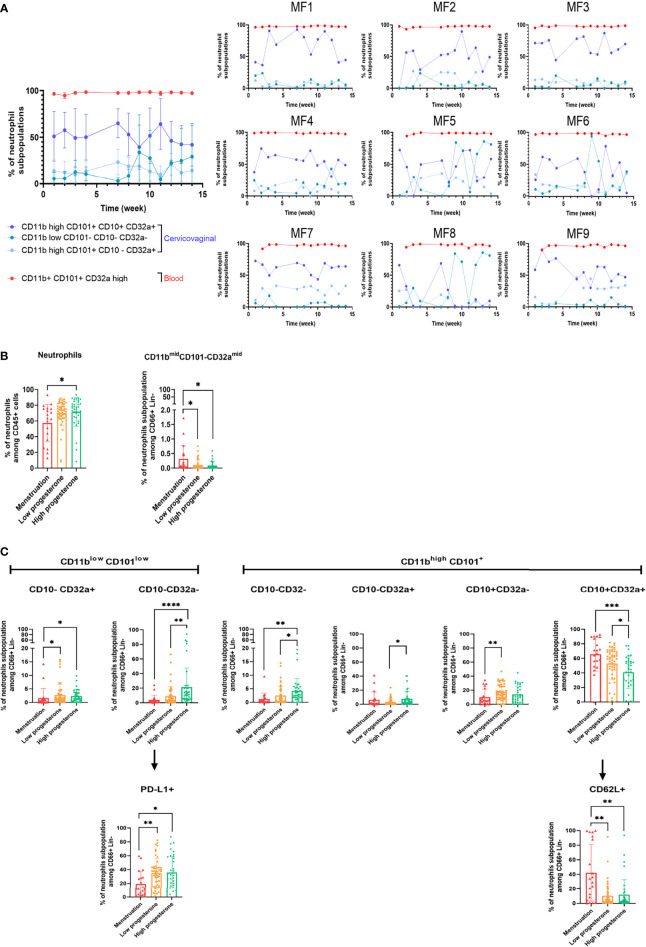
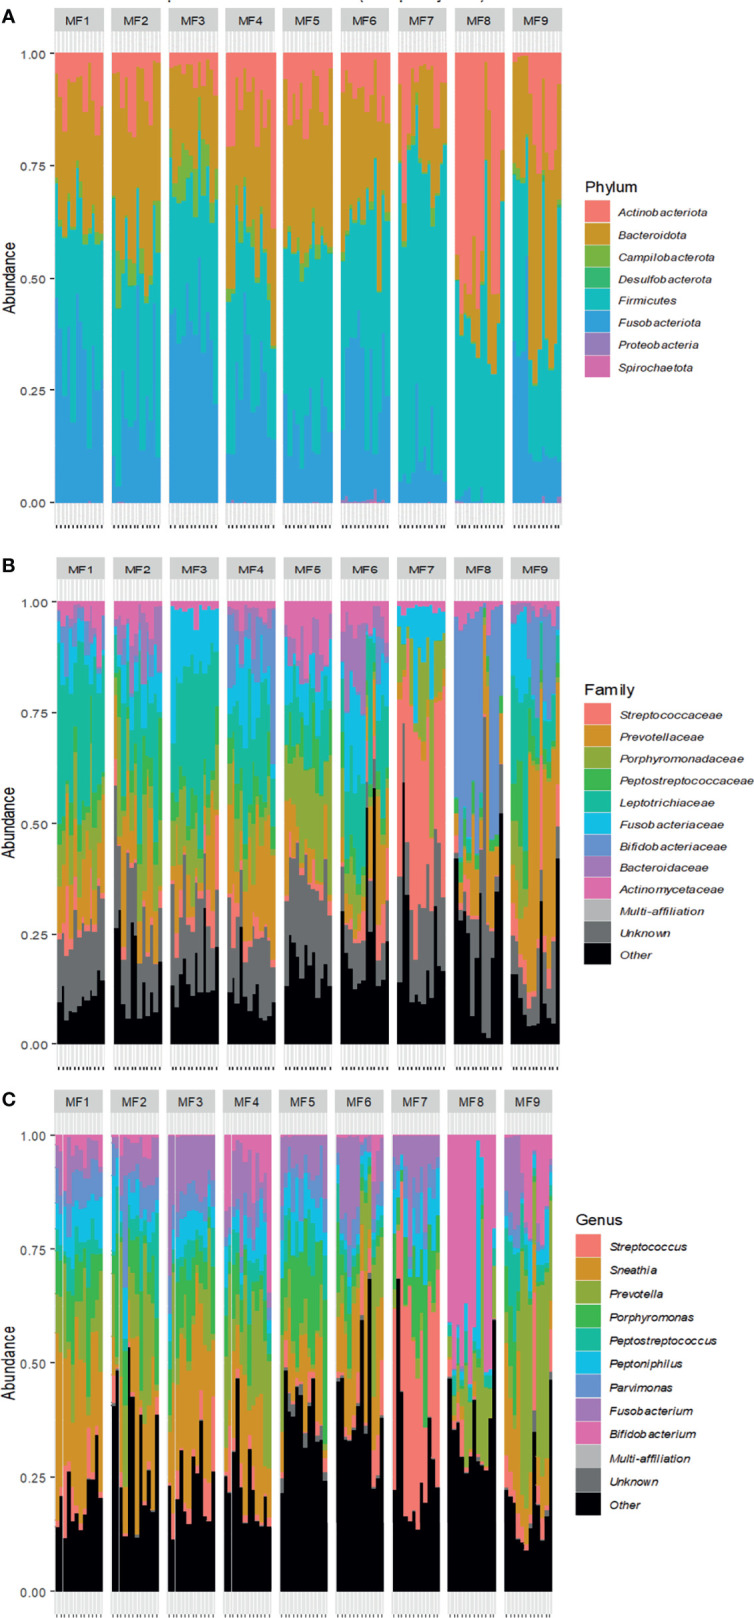
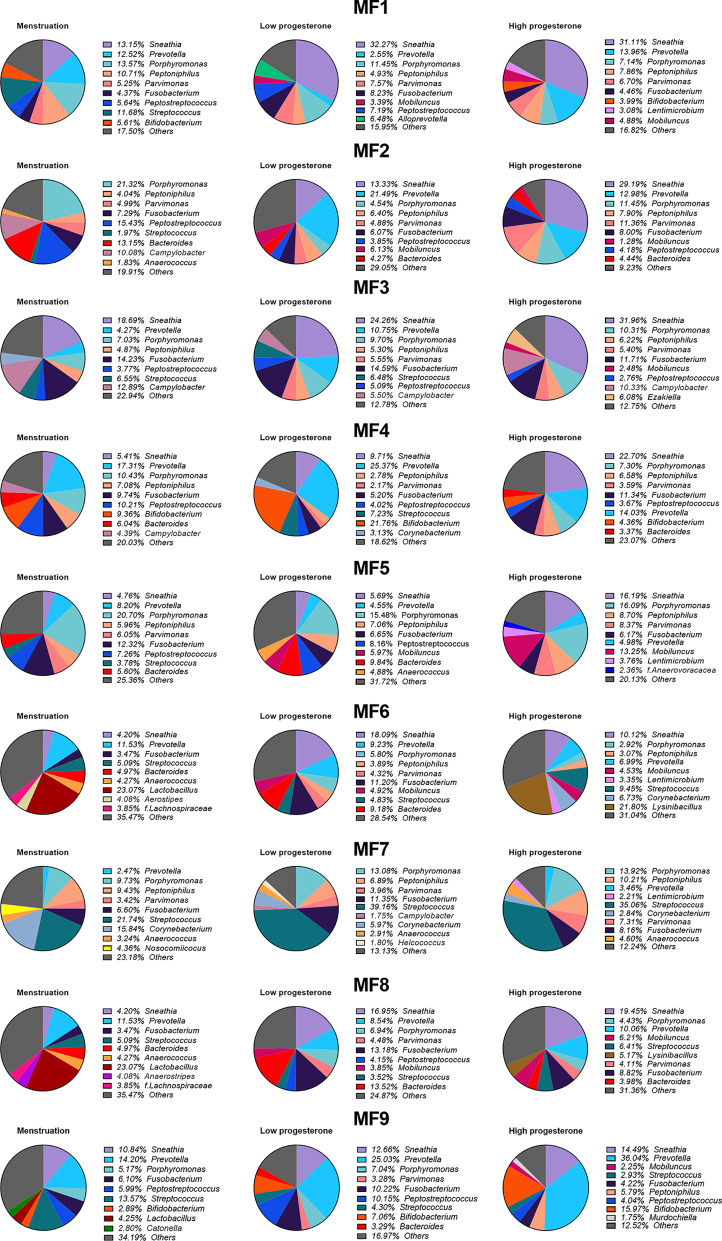
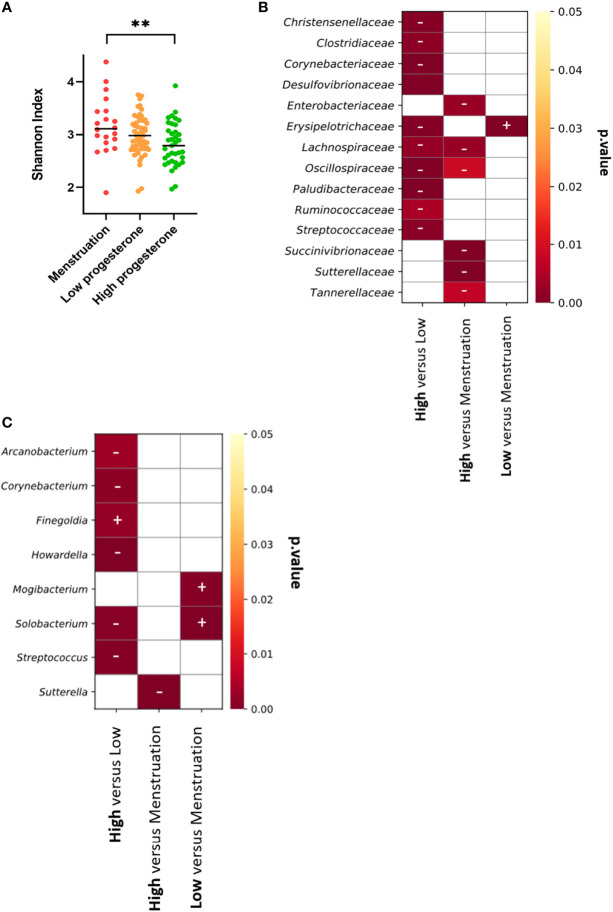
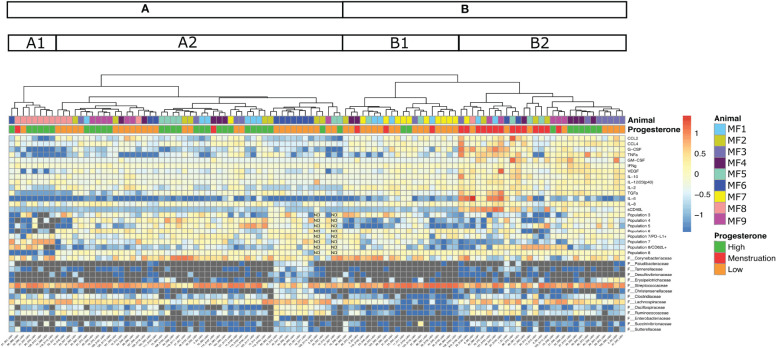
Results: Cervicovaginal cytokine/chemokine concentrations were affected by the menstrual cycle, with a peak of production during menstruation. We observed three main cervicovaginal neutrophil subpopulations: CD11bhigh CD101+ CD10+ CD32a+, CD11bhigh CD101+ CD10- CD32a+, and CD11blow CD101low CD10- CD32a-, of which the proportion varied during the menstrual cycle. During menstruation, there was an increase in the CD11bhigh CD101+ CD10+ CD32a+ subset of neutrophils, which expressed higher levels of CD62L. Various bacterial taxa in the vaginal microbiota showed differential abundance depending on the phase of the menstrual cycle. Compilation of the factors that vary according to hormonal phase showed the clustering of samples collected during menstruation, characterized by a high concentration of cytokines and an elevated abundance of the CD11bhigh CD101+ CD10+ CD32a+ CD62L+ neutrophil subpopulation.
Conclusions: We show a significant impact of menstruation on the local environment (cytokine production, neutrophil phenotype, and vaginal microbiota composition) in female cynomolgus macaques. Menstruation triggers increased production of cytokines, shift of the vaginal microbiota composition and the recruitment of mature/activated neutrophils from the blood to the FRT. These results support the need to monitor the menstrual cycle and a longitudinal sampling schedule for further studies in female animals and/or women focusing on the mucosal FRT environment.
Keywords: blood compartment; cytokines; female reproductive tract (FRT); inflammation; menstrual cycle; neutrophils; vaginal microbiota.
Copyright © 2022 Adapen, Réot, Nunez, Cannou, Marlin, Lemaître, d’Agata, Gilson, Ginoux, Le Grand, Nugeyre and Menu.
Conflict of interest statement
Authors NN, Ld'A, EmG and ErG were employed by Life&Soft. The remaining authors declare that the research was conducted in the absence of any commercial or financial relationships that could be construed as a potential conflict of interest.
Figures
Similar articles
-
Role of the human vaginal microbiota in the regulation of inflammation and sexually transmitted infection acquisition: Contribution of the non-human primate model to a better understanding?Front Reprod Health. 2022 Dec 6;4:992176. doi: 10.3389/frph.2022.992176. eCollection 2022. Front Reprod Health. 2022. PMID: 36560972 Free PMC article. Review.
-
Dynamics of Vaginal and Rectal Microbiota Over Several Menstrual Cycles in Female Cynomolgus Macaques.Front Cell Infect Microbiol. 2019 Jun 12;9:188. doi: 10.3389/fcimb.2019.00188. eCollection 2019. Front Cell Infect Microbiol. 2019. PMID: 31249812 Free PMC article.
-
Antimicrobial peptides in the female reproductive tract: a critical component of the mucosal immune barrier with physiological and clinical implications.Hum Reprod Update. 2015 May-Jun;21(3):353-77. doi: 10.1093/humupd/dmu065. Epub 2014 Dec 29. Hum Reprod Update. 2015. PMID: 25547201 Review.
-
The healthy female microbiome across body sites: effect of hormonal contraceptives and the menstrual cycle.Hum Reprod. 2022 Jun 30;37(7):1525-1543. doi: 10.1093/humrep/deac094. Hum Reprod. 2022. PMID: 35553675 Free PMC article.
-
Reproductive tract microbiota of women in childbearing age shifts upon gynecological infections and menstrual cycle.BMC Microbiol. 2021 Sep 21;21(1):252. doi: 10.1186/s12866-021-02300-4. BMC Microbiol. 2021. PMID: 34548031 Free PMC article.
Cited by
-
Role of the human vaginal microbiota in the regulation of inflammation and sexually transmitted infection acquisition: Contribution of the non-human primate model to a better understanding?Front Reprod Health. 2022 Dec 6;4:992176. doi: 10.3389/frph.2022.992176. eCollection 2022. Front Reprod Health. 2022. PMID: 36560972 Free PMC article. Review.
-
Women for science and science for women: Gaps, challenges and opportunities towards optimizing pre-exposure prophylaxis for HIV-1 prevention.Front Immunol. 2022 Dec 6;13:1055042. doi: 10.3389/fimmu.2022.1055042. eCollection 2022. Front Immunol. 2022. PMID: 36561760 Free PMC article. Review.
-
The impact of pelvic floor electrical stimulation on vaginal microbiota and immunity.Front Cell Infect Microbiol. 2022 Sep 27;12:1006576. doi: 10.3389/fcimb.2022.1006576. eCollection 2022. Front Cell Infect Microbiol. 2022. PMID: 36237426 Free PMC article. Clinical Trial.
-
Christensenella minuta, a new candidate next-generation probiotic: current evidence and future trajectories.Front Microbiol. 2024 Jan 11;14:1241259. doi: 10.3389/fmicb.2023.1241259. eCollection 2023. Front Microbiol. 2024. PMID: 38274765 Free PMC article. Review.
-
Vaginal microbial dynamics and pathogen colonization in a humanized microbiota mouse model.NPJ Biofilms Microbiomes. 2023 Nov 20;9(1):87. doi: 10.1038/s41522-023-00454-9. NPJ Biofilms Microbiomes. 2023. PMID: 37985659 Free PMC article.
References
Publication types
MeSH terms
Substances
LinkOut - more resources
Full Text Sources
Medical
Research Materials