Genome-Wide Identification and Expression Analysis of the R2R3-MYB Transcription Factor Family Revealed Their Potential Roles in the Flowering Process in Longan (Dimocarpus longan)
- PMID: 35401601
- PMCID: PMC8990856
- DOI: 10.3389/fpls.2022.820439
Genome-Wide Identification and Expression Analysis of the R2R3-MYB Transcription Factor Family Revealed Their Potential Roles in the Flowering Process in Longan (Dimocarpus longan)
Abstract
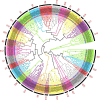
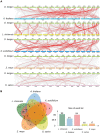
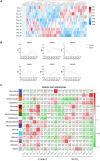
Longan (Dimocarpus longan Lour.) is a productive fruit crop with high nutritional and medical value in tropical and subtropical regions. The MYB gene family is one of the most widespread plant transcription factor (TF) families participating in the flowering regulation. However, little is known about the MYB TFs involved in the flowering process in longan and its regulatory network. In this study, a total of 119 DlR2R3-MYB genes were identified in the longan genome and were phylogenetically grouped into 28 subgroups. The groupings were supported by highly conserved gene structures and motif composition of DlR2R3-MYB genes in each subgroup. Collinearity analysis demonstrated that segmental replications played a more crucial role in the expansion of the DlR2R3-MYB gene family compared to tandem duplications, and all tandem/segmental duplication gene pairs have evolved under purifying selection. Interspecies synteny analysis among longan and five representative species implied the occurrence of gene duplication events was one of the reasons contributing to functional differentiation among species. RNA-seq data from various tissues showed DlR2R3-MYB genes displayed tissue-preferential expression patterns. The pathway of flower development was enriched with six DlR2R3-MYB genes. Cis-acting element prediction revealed the putative functions of DlR2R3-MYB genes were related to the plant development, phytohormones, and environmental stresses. Notably, the orthologous counterparts between Arabidopsis and longan R2R3-MYB members tended to play conserved roles in the flowering regulation and stress responses. Transcriptome profiling on off-season flower induction (FI) by KClO3 indicated two up-regulated and four down-regulated DlR2R3-MYB genes involved in the response to KClO3 treatment compared with control groups. Additionally, qRT-PCR confirmed certain genes exhibited high expression in flowers/flower buds. Subcellular localization experiments revealed that three predicted flowering-associated MYB proteins were localized in the nucleus. Future functional studies on these potential candidate genes involved in the flowering development could further the understanding of the flowering regulation mechanism.
Keywords: Dimocarpus longan; KClO3; R2R3-MYB; flower development; qRT-PCR.
Copyright © 2022 Chen, Zhang, Fang, Wang, Xu, Zhao, Zhang and Fang.
Conflict of interest statement
The authors declare that the research was conducted in the absence of any commercial or financial relationships that could be construed as a potential conflict of interest.
Figures


Similar articles
-
Comparative Analysis of the MADS-Box Genes Revealed Their Potential Functions for Flower and Fruit Development in Longan (Dimocarpus longan).Front Plant Sci. 2022 Jan 27;12:813798. doi: 10.3389/fpls.2021.813798. eCollection 2021. Front Plant Sci. 2022. PMID: 35154209 Free PMC article.
-
Identification of WRKY Gene Family from Dimocarpus longan and Its Expression Analysis during Flower Induction and Abiotic Stress Responses.Int J Mol Sci. 2018 Jul 25;19(8):2169. doi: 10.3390/ijms19082169. Int J Mol Sci. 2018. PMID: 30044387 Free PMC article.
-
Floral Induction of Longan (Dimocarpus longan) by Potassium Chlorate: Application, Mechanism, and Future Perspectives.Front Plant Sci. 2021 Jun 7;12:670587. doi: 10.3389/fpls.2021.670587. eCollection 2021. Front Plant Sci. 2021. PMID: 34163509 Free PMC article. Review.
-
Genome-wide identification of CONSTANS-like genes in Dimocarpus longan and functional characterization of DlCOL9 revealing its role in floral induction.Plant Physiol Biochem. 2025 Aug;225:110017. doi: 10.1016/j.plaphy.2025.110017. Epub 2025 May 12. Plant Physiol Biochem. 2025. PMID: 40381360
-
MYB transcription factors and their roles in the male reproductive development of flowering plants.Plant Sci. 2023 Oct;335:111811. doi: 10.1016/j.plantsci.2023.111811. Epub 2023 Aug 16. Plant Sci. 2023. PMID: 37574139 Review.
Cited by
-
Genomic-wide identification and expression analysis of R2R3-MYB transcription factors related to flavonol biosynthesis in Morinda officinalis.BMC Plant Biol. 2023 Aug 7;23(1):381. doi: 10.1186/s12870-023-04394-6. BMC Plant Biol. 2023. PMID: 37550611 Free PMC article.
-
Genome-Wide Characterization and Expression Profiling of the AP2/ERF Gene Family in Fragaria vesca L.Int J Mol Sci. 2024 Jul 11;25(14):7614. doi: 10.3390/ijms25147614. Int J Mol Sci. 2024. PMID: 39062854 Free PMC article.
-
Genome-Wide Analysis of MYB Genes in Primulina eburnea (Hance) and Identification of Members in Response to Drought Stress.Int J Mol Sci. 2023 Dec 29;25(1):465. doi: 10.3390/ijms25010465. Int J Mol Sci. 2023. PMID: 38203634 Free PMC article.
-
Structure, evolution, and roles of MYB transcription factors proteins in secondary metabolite biosynthetic pathways and abiotic stresses responses in plants: a comprehensive review.Front Plant Sci. 2025 Jul 31;16:1626844. doi: 10.3389/fpls.2025.1626844. eCollection 2025. Front Plant Sci. 2025. PMID: 40822724 Free PMC article. Review.
-
Transcriptional Proposition for Uniquely Developed Protocorm Flowering in Three Orchid Species: Resources for Innovative Breeding.Front Plant Sci. 2022 Jun 28;13:942591. doi: 10.3389/fpls.2022.942591. eCollection 2022. Front Plant Sci. 2022. PMID: 35837448 Free PMC article.
References
-
- Borges R., Miguel E. C., Dias J. M. R., Da Cunha M., Bressan-Smith R. E., De Oliveira J. G., et al. (2004). Ultrastructural, physiological and biochemical analyses of chlorate toxicity on rice seedlings. Plant Sci. 166 1057–1062. 10.1016/j.plantsci.2003.12.023 - DOI
LinkOut - more resources
Full Text Sources
Miscellaneous

