Genomic Analysis and Delineation of the Tan Spot Susceptibility Locus Tsc1 in Wheat
- PMID: 35401609
- PMCID: PMC8984248
- DOI: 10.3389/fpls.2022.793925
Genomic Analysis and Delineation of the Tan Spot Susceptibility Locus Tsc1 in Wheat
Abstract
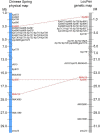
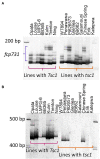
The necrotrophic fungal pathogen Pyrenophora tritici-repentis (Ptr) causes the foliar disease tan spot in both bread wheat and durum wheat. Wheat lines carrying the tan spot susceptibility gene Tsc1 are sensitive to the Ptr-produced necrotrophic effector (NE) Ptr ToxC. A compatible interaction results in leaf chlorosis, reducing yield by decreasing the photosynthetic area of leaves. Developing genetically resistant cultivars will effectively reduce disease incidence. Toward that goal, the production of chlorosis in response to inoculation with Ptr ToxC-producing isolates was mapped in two low-resolution biparental populations derived from LMPG-6 × PI 626573 (LP) and Louise × Penawawa (LouPen). In total, 58 genetic markers were developed and mapped, delineating the Tsc1 candidate gene region to a 1.4 centiMorgan (cM) genetic interval spanning 184 kb on the short arm of chromosome 1A. A total of nine candidate genes were identified in the Chinese Spring reference genome, seven with protein domains characteristic of resistance genes. Mapping of the chlorotic phenotype, development of genetic markers, both for genetic mapping and marker-assisted selection (MAS), and the identification of Tsc1 candidate genes provide a foundation for map-based cloning of Tsc1.
Keywords: Ptr ToxC; Pyrenophora tritici-repentis; Triticum; Tsc1; disease resistance; tan spot; wheat.
Copyright © 2022 Running, Momotaz, Kariyawasam, Zurn, Acevedo, Carter, Liu and Faris.
Conflict of interest statement
The authors declare that the research was conducted in the absence of any commercial or financial relationships that could be construed as a potential conflict of interest.
Figures


References
-
- Ballance G. M., Lamari L., Kowatsch R., Bernier C. C. (1996). Cloning, expression and occurrence of the gene encoding the Ptr necrosis toxin from Pyrenophora tritici-repentis. Mol. Plant Pathol. doi: 10.1007/978-94-011-5218-1_21 - DOI
-
- Carter A. H., Chen X. M., Garland-Campbell K., Kidwell K. K. (2009). Identifying QTL for high-temperature adult-plant resistance to stripe rust (Puccinia striiformis f. sp. tritici) in the spring wheat (Triticum aestivum L.) cultivar ‘Louise’. Theor. Appl. Genet. 119, 1119–1128. doi: 10.1007/s00122-009-1114-2, PMID: - DOI - PubMed
-
- Carter A. H., Kidwell K. K., DeMacon V. L., Shelton G. B., Burke A. B., Balow K. A., et al. (2020). Registration of the Louise-Penawawa spring wheat recombinant inbred line mapping population. J. Plant Regist. 14, 474–480. doi: 10.1002/plr2.20077 - DOI
LinkOut - more resources
Full Text Sources
Research Materials
Miscellaneous

