. 2022 Mar 24:13:818483.
doi: 10.3389/fpls.2022.818483. eCollection 2022.

A Secondary Metabolism Pathway Involved in the Production of a Putative Toxin Is Expressed at Early Stage of Monilinia laxa Infection

Affiliations

A Secondary Metabolism Pathway Involved in the Production of a Putative Toxin Is Expressed at Early Stage of Monilinia laxa Infection

Maria Villarino et al. Front Plant Sci. .

Abstract

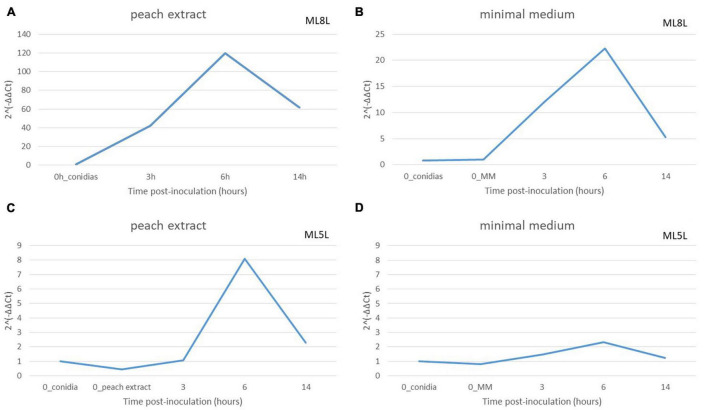
The necrotrophic pathogenic fungus Monilinia laxa causes brown rot disease on stone fruit generating significant yield losses. So far, a limited number of pathogenesis-related virulence factors, such as cell wall degrading enzymes and potential phytotoxins, have been described in Monilinia spp. Using RNA-sequencing data from highly virulent M. laxa ML8L strain at early stages of the infection process (6, 14, 24, and 48 h post-inoculation, hpi) on nectarine and the Pathogen-Host-Interactions (PHI) database, we selected a number of genes for further study and ranked them according to their transcription levels. We identified a class of genes highly expressed at 6 hpi and that their expression decreased to almost undetectable levels at 14 to 48 hpi. Among these genes we found Monilinia__061040 encoding a non-ribosomal peptide synthase (NRPS). Monilinia__061040 together with other five co-regulated genes, forms a secondary metabolism cluster potentially involved in the production of epipolythiodioxopiperazine (ETP) toxin. Quantitative-PCR data confirmed previous RNA sequencing results from the virulent ML8L strain. Interestingly, in a less virulent M. laxa ML5L strain the expression levels of this pathway were reduced compared to the ML8L strain during nectarine infection. In vitro experiments showed that liquid medium containing peach extract mimicked the results observed using nectarines. In fact, upregulation of the NRPS coding gene was also observed in minimal medium suggesting the existence of a fruit-independent mechanism of regulation for this putative toxin biosynthetic pathway that is also downregulated in the less virulent strain. These results emphasize the role of this secondary metabolism pathway during the early stage of brown rot disease development and show alternative models to study the induction of virulence genes in this fungus.

Keywords: NRPS; RNA-seq; brown rot; epipolythiodioxopiperazine; necrotroph; pathogenesis-related pathways; pathogen–host interactions.


Conflict of interest statement

The authors declare that the research was conducted in the absence of any commercial or financial relationships that could be construed as a potential conflict of interest.

Figures

FIGURE 1
FIGURE 1
Classification according to gene ontology (GO) terms of the 100 upregulated and 100 downregulated genes with the largest expression difference (P-adj ≤ 0.05) between the two sampling times (6 hpi and 14 hpi) in Monilinia laxa ML8L.
FIGURE 2
FIGURE 2
Expression pattern of genes belonging to early expressed toxin biosynthetic cluster (EETBC) in Monilinia laxa ML8L during infection of mature nectarine. Y-axis indicates the mean raw read counts of M. laxa EETBC transcripts in inoculated samples (12 samples) from RNA-seq output in the time point (6, 14, 24, and 48 h). The mean represents the three biological replicates per time point taken for analysis. The bars with an asterisk at 6 hpi are significant with respect to the rest of the times for each gene.
FIGURE 3
FIGURE 3
Conservation of early expressed toxin biosynthetic cluster (EETBC) and their genes with functionally characterized homologs. The genes are those characterized in the Monilinia laxa (ML8L), M. fructigena (gena6), M. fructicola (CPMC6), Botrytis cinerea (Bc05.10), and Sclerotinia sclerotiorum (Ss1980 UF-70) cluster. AntiSMASH used a published database that does not distinguish between full coding sequences and single exons. The shading delimits those genes (indicated as CDS or exons) belonging to the EETB cluster. The colors of the genes are displayed as antiSMASH automatically does. Those genes that are of interest for this work are labeled.
FIGURE 4
FIGURE 4
Structure of non-ribosomal peptide-synthetase (NRPS) domains in Monilinia laxa ML8L (Monilinia__061040), Botrytis cinerea Bc05.10 [BCIN_12g04980 (Bcnrps1)], and Sclerotinia sclerotiorum Ss1880 UF-70 (sscle_10g078260). AMP-binding enzyme (PF00501: AMP-binding), condensation domain (PF00668: Condensation), phosphopantetheine attachment site (PF00550: PP-binding) predicted by InterPro Scan.
FIGURE 5
FIGURE 5
Differential expression of genes coding for early expressed toxin biosynthetic cluster (EETBC). Relative amounts of transcripts for six individual EETBC genes in Monilinia laxa ML8L (A) and ML5L (B). The amounts of transcripts for each gene at different time points were compared that at 0 hpi_fruit and with histone at the same incubation time [hours post-inoculation (hpi)], using the comparative cycle threshold (CT) method (2–ΔΔCt). Indicated values are the means of triplicates and standard deviations. Each time point represents the mean (n = 3) and letters denote significant differences for each gene according to the analysis of variance (ANOVA) and Tukey’s Test. See text for further details about 0h_conidia and 0h_fruit samples.
FIGURE 6
FIGURE 6
Sequence changes in the early expressed toxin biosynthetic cluster (EETBC) genes of strain Monilinia laxa ML5L compared to ML8L (visualized with IGV).
FIGURE 7
FIGURE 7
Relative amounts of transcripts for non-ribosomal peptide synthetases enzyme (NRPS) in Monilinia laxa ML8L (A,B) and ML5L (C,D) in different liquid media [peach extract and minimal medium (MM)]. The amounts of transcripts for each gene at different time points were compared that at 0 hpi_conidia and with histone at the same incubation time [hours post-inoculation (hpi)], using the comparative cycle threshold (CT) method (2–ΔΔCt). Indicated values are the means of triplicates and standard deviations. Each time point represents the mean and vertical bars indicate the standard deviation of the mean (n = 3) and letters denote significant differences according to the analysis of variance (ANOVA) and Kruskal–Wallis Test.

References

    1. Amselem J., Cuomo C. A., Van Kan J. A., Viaud M., Benito E. P., Couloux A., et al. (2011). Genomic analysis of the necrotrophic fungal pathogens Sclerotinia sclerotiorum and Botrytis cinerea. PLoS Genet. 7:e1002230. 10.1371/journal.pgen.1002230 - DOI - PMC - PubMed
    1. Ashburner M., Ball C. A., Blake J. A., Botstein D., Butler H., Cherry J. M., et al. (2000). Gene ontology: tool for the unification of biology. Nat. Genet. 25 25–29. - PMC - PubMed
    1. Balsells-Llauradó M., Silva C. J., Usall J., Vall-llaura N., Serrano-Prieto S., Teixidó N., et al. (2020). Depicting the battle between nectarine and Monilinia laxa: the fruit developmental stage dictates the effectiveness of the host defenses and the pathogen’s infection strategies. Hortic. Res. 7:167. 10.1038/s41438-020-00387-w - DOI - PMC - PubMed
    1. Bayram O., Krappmann S., Ni M., Bok J. W., Helmstaedt K., Valerius O., et al. (2008). VelB/VeA/LaeA complex coordinates light signal with fungal development and secondary metabolism. Science 320 1504–1506. 10.1126/science.1155888 - DOI - PubMed
    1. Blanco-Ulate B., Morales-Cruz A., Amrine K. C., Labavitch J. M., Powell A. L., Cantu D. (2014). Genome-wide transcriptional profiling of Botrytis cinerea genes targeting plant cell walls during infections of different hosts. Front. Plant Sci. 5:435. 10.3389/fpls.2014.00435 - DOI - PMC - PubMed