

High-Density Genetic Variation Map Reveals Key Candidate Loci and Genes Associated With Important Agronomic Traits in Peanut
- PMID: 35401655
- PMCID: PMC8990815
- DOI: 10.3389/fgene.2022.845602
High-Density Genetic Variation Map Reveals Key Candidate Loci and Genes Associated With Important Agronomic Traits in Peanut
Abstract
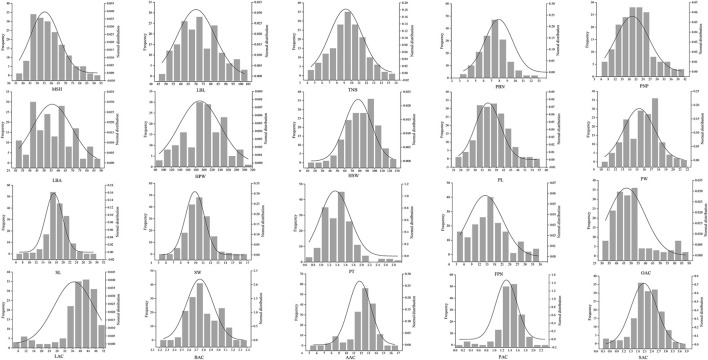
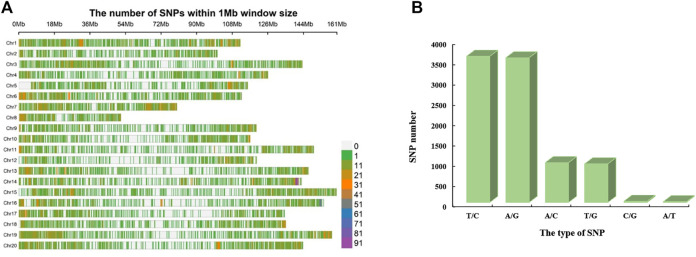
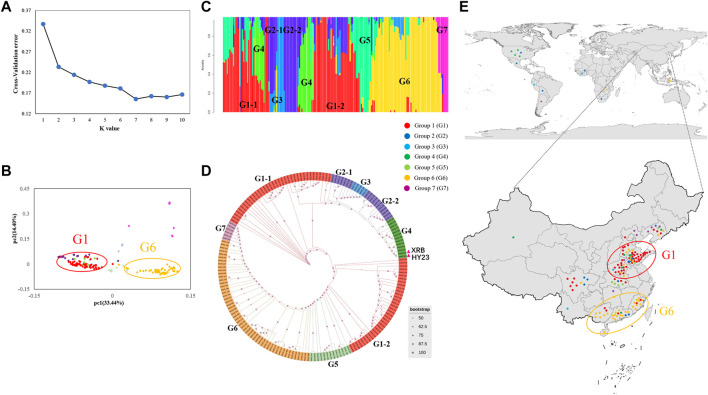
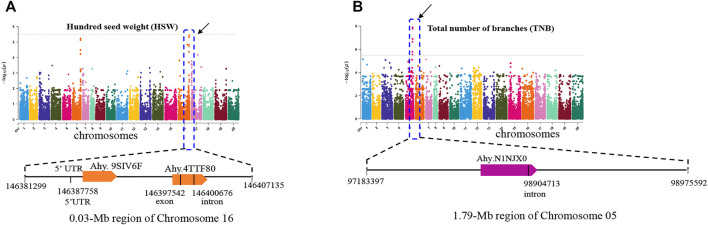
Peanut is one of the most important cash crops with high quality oil, high protein content, and many other nutritional elements, and grown globally. Cultivated peanut (Arachis hypogaea L.) is allotetraploid with a narrow genetic base, and its genetics and molecular mechanisms controlling the agronomic traits are poorly understood. Here, we report a comprehensive genome variation map based on the genotyping of a panel of 178 peanut cultivars using Axiom_Arachis2 SNP array, including 163 representative varieties of different provinces in China, and 15 cultivars from 9 other countries. According to principal component analysis (PCA) and phylogenetic analysis, the peanut varieties were divided into 7 groups, notable genetic divergences between the different areas were shaped by environment and domestication. Using genome-wide association study (GWAS) analysis, we identified several marker-trait associations (MTAs) and candidate genes potentially involved in regulating several agronomic traits of peanut, including one MTA related with hundred seed weight, one MTA related with total number of branches, and 14 MTAs related with pod shape. This study outlines the genetic basis of these peanut cultivars and provides 13,125 polymorphic SNP markers for further distinguishing and utility of these elite cultivars. In addition, the candidate loci and genes provide valuable information for further fine mapping of QTLs and improving the quality and yield of peanut using a genomic-assisted breeding method.
Keywords: GWAS; SNP array; agronomic traits; molecular markers; peanut.
Copyright © 2022 Zhao, Tian, Xia, Li, Li, Li, Zhang, Zhou, Ma, Huang, Zhang, Thudi, Ma, Wang and Zhao.
Conflict of interest statement
The authors declare that the research was conducted in the absence of any commercial or financial relationships that could be construed as a potential conflict of interest.
Figures
Similar articles
-
Quantitative trait locus analysis of agronomic and quality-related traits in cultivated peanut (Arachis hypogaea L.).Theor Appl Genet. 2015 Jun;128(6):1103-15. doi: 10.1007/s00122-015-2493-1. Epub 2015 Mar 25. Theor Appl Genet. 2015. PMID: 25805315 Free PMC article.
-
QTL identification for seed weight and size based on a high-density SLAF-seq genetic map in peanut (Arachis hypogaea L.).BMC Plant Biol. 2019 Dec 3;19(1):537. doi: 10.1186/s12870-019-2164-5. BMC Plant Biol. 2019. PMID: 31795931 Free PMC article.
-
Co-localization of major quantitative trait loci for pod size and weight to a 3.7 cM interval on chromosome A05 in cultivated peanut (Arachis hypogaea L.).BMC Genomics. 2017 Jan 9;18(1):58. doi: 10.1186/s12864-016-3456-x. BMC Genomics. 2017. PMID: 28068921 Free PMC article.
-
An Overview of Mapping Quantitative Trait Loci in Peanut (Arachis hypogaea L.).Genes (Basel). 2023 May 28;14(6):1176. doi: 10.3390/genes14061176. Genes (Basel). 2023. PMID: 37372356 Free PMC article. Review.
-
Advances in the evolution research and genetic breeding of peanut.Gene. 2024 Jul 20;916:148425. doi: 10.1016/j.gene.2024.148425. Epub 2024 Apr 3. Gene. 2024. PMID: 38575102 Review.
Cited by
-
Estimates of Genomic Heritability and the Marker-Derived Gene for Re(Production) Traits in Xinggao Sheep.Genes (Basel). 2023 Feb 25;14(3):579. doi: 10.3390/genes14030579. Genes (Basel). 2023. PMID: 36980850 Free PMC article.
-
Identification of QTLs associated with very-long chain fatty acid (VLCFA) content via linkage mapping and BSA-seq in peanut.Theor Appl Genet. 2024 Jan 29;137(2):33. doi: 10.1007/s00122-024-04547-7. Theor Appl Genet. 2024. PMID: 38285195
-
Genome-wide association study and development of molecular markers for yield and quality traits in peanut (Arachis hypogaea L.).BMC Plant Biol. 2024 Apr 5;24(1):244. doi: 10.1186/s12870-024-04937-5. BMC Plant Biol. 2024. PMID: 38575936 Free PMC article.
-
Using cross-country datasets for association mapping in Arachis hypogaea L.Plant Genome. 2024 Dec;17(4):e20515. doi: 10.1002/tpg2.20515. Epub 2024 Oct 15. Plant Genome. 2024. PMID: 39404458 Free PMC article.
-
Omics-driven advances in the understanding of regulatory landscape of peanut seed development.Front Plant Sci. 2024 May 3;15:1393438. doi: 10.3389/fpls.2024.1393438. eCollection 2024. Front Plant Sci. 2024. PMID: 38766472 Free PMC article. Review.
References
-
- Branch W. D. (2011). First 100 Years - Inheritance of Testa Color in Peanut (Arachis HypogaeaL.). Crop Sci. 51, 1–4. 10.2135/cropsci2010.06.0349 - DOI
LinkOut - more resources
Full Text Sources
Molecular Biology Databases