

Integrated Analysis of Competitive Endogenous RNA Networks in Acute Ischemic Stroke
- PMID: 35401659
- PMCID: PMC8990852
- DOI: 10.3389/fgene.2022.833545
Integrated Analysis of Competitive Endogenous RNA Networks in Acute Ischemic Stroke
Abstract
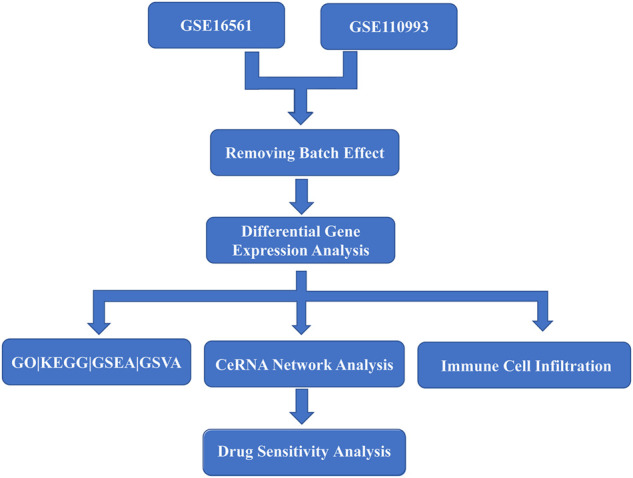
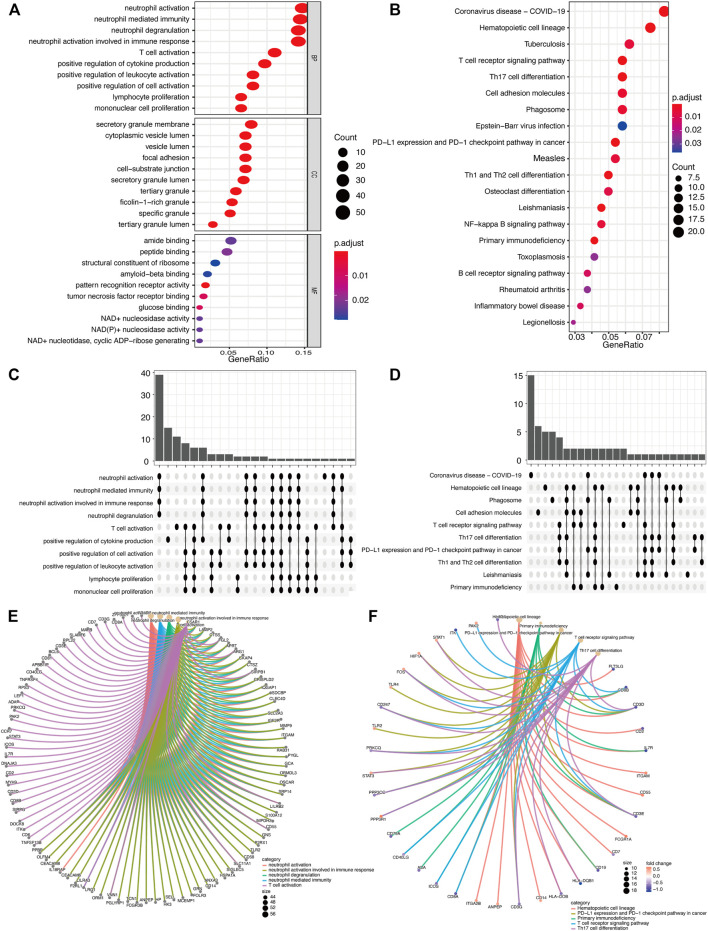
Background: Acute ischemic stroke (AIS) is a severe neurological disease with complex pathophysiology, resulting in the disability and death. The goal of this study is to explore the underlying molecular mechanisms of AIS and search for new potential biomarkers and therapeutic targets. Methods: Integrative analysis of mRNA and miRNA profiles downloaded from Gene Expression Omnibus (GEO) was performed. We explored differentially expressed genes (DEGs) and differentially expressed miRNAs (DEMirs) after AIS. Target mRNAs of DEMirs and target miRNAs of DEGs were predicted with target prediction tools, and the intersections between DEGs and target genes were determined. Subsequently, Gene Ontology (GO) and Kyoto encyclopedia of genes and genomes (KEGG) pathway enrichment analyses, Gene set enrichment analysis (GSEA), Gene set variation analysis (GSVA), competitive endogenous RNA (ceRNA) (lncRNA-miRNA-mRNA) network, protein-protein interaction (PPI) network, and gene transcription factors (TFs) network analyses were performed to identify hub genes and associated pathways. Furthermore, we obtained AIS samples with evaluation of immune cell infiltration and used CIBERSORT to determine the relationship between the expression of hub genes and infiltrating immune cells. Finally, we used the Genomics of Drug Sensitivity in Cancer (GDSC) database to predict the effect of the identified targets on drug sensitivity. Result: We identified 293 DEGs and 26 DEMirs associated with AIS. DEGs were found to be mainly enriched in inflammation and immune-related signaling pathways through enrichment analysis. The ceRNA network included nine lncRNAs, 13 miRNAs, and 21 mRNAs. We used the criterion AUC >0.8, to screen a 3-gene signature (FBL, RPS3, and RPS15) and the aberrantly expressed miRNAs (hsa-miR-125a-5p, hsa-miR-125b-5p, hsa-miR-148b-3p, and hsa-miR-143-3p) in AIS, which were verified by a method of quantitative PCR (qPCR) in HT22 cells. T cells CD8, B cells naïve, and activated NK cells had statistical increased in number compared with the acute cerebral infarction group. By predicting the IC50 of the patient to the drug, AZD0530, Z.LLNle.CHO and NSC-87877 with significant differences between the groups were screened out. AIS demonstrated heterogeneity in immune infiltrates that correlated with the occurrence and development of diseases. Conclusion: These findings may contribute to a better understanding of the molecular mechanisms of AIS and provide the basis for the development of novel treatment targets in AIS.
Keywords: acute ischemic stroke; competitive endogenous RNA; differentially expressed genes; differentially expressed miRNAs; functional enrichment analyses; protein-protein interaction; qPCR analysis.
Copyright © 2022 Wu, Wei, Fan, Gu, Li and Wang.
Conflict of interest statement
The authors declare that the research was conducted in the absence of any commercial or financial relationships that could be construed as a potential conflict of interest.
Figures


Similar articles
-
LINC01018 and SMIM25 sponged miR-182-5p in endometriosis revealed by the ceRNA network construction.Int J Immunopathol Pharmacol. 2020 Jan-Dec;34:2058738420976309. doi: 10.1177/2058738420976309. Int J Immunopathol Pharmacol. 2020. PMID: 33237828 Free PMC article.
-
Integrative analysis of potential biomarkers and immune cell infiltration in Parkinson's disease.Brain Res Bull. 2021 Dec;177:53-63. doi: 10.1016/j.brainresbull.2021.09.010. Epub 2021 Sep 16. Brain Res Bull. 2021. PMID: 34536521
-
SNHG 12 and hsa-miR-140-5P may play an important role in the ceRNA network related to hypertrophic cardiomyopathy.J Thorac Dis. 2023 Mar 31;15(3):1353-1363. doi: 10.21037/jtd-23-189. Epub 2023 Mar 27. J Thorac Dis. 2023. PMID: 37065602 Free PMC article.
-
Exploring the Molecular Mechanisms of Pterygium by Constructing lncRNA-miRNA-mRNA Regulatory Network.Invest Ophthalmol Vis Sci. 2020 Jul 1;61(8):12. doi: 10.1167/iovs.61.8.12. Invest Ophthalmol Vis Sci. 2020. PMID: 32645133 Free PMC article.
-
Pharmacological mechanism and therapeutic efficacy of Icariside II in the treatment of acute ischemic stroke: a systematic review and network pharmacological analysis.BMC Complement Med Ther. 2022 Sep 30;22(1):253. doi: 10.1186/s12906-022-03732-9. BMC Complement Med Ther. 2022. PMID: 36180911 Free PMC article.
Cited by
-
Competing endogenous RNA network analysis of the molecular mechanisms of ischemic stroke.BMC Genomics. 2023 Feb 8;24(1):67. doi: 10.1186/s12864-023-09163-1. BMC Genomics. 2023. PMID: 36755220 Free PMC article.
-
Profiling immune cell-related gene features and immunoregulatory ceRNA in ischemic stroke.Mol Biomed. 2024 Dec 18;5(1):72. doi: 10.1186/s43556-024-00237-4. Mol Biomed. 2024. PMID: 39690389 Free PMC article.
-
Implications of the SNHG10/miR-665/RASSF5/NF-κB pathway in dihydromyricetin-mediated ischemic stroke protection.PeerJ. 2024 Dec 23;12:e18754. doi: 10.7717/peerj.18754. eCollection 2024. PeerJ. 2024. PMID: 39726744 Free PMC article.
-
The value of RPS15 and MRPS27 in ischemic stroke.Medicine (Baltimore). 2023 Aug 18;102(33):e34706. doi: 10.1097/MD.0000000000034706. Medicine (Baltimore). 2023. PMID: 37603533 Free PMC article.
-
Integrating Bulk RNA and Single-Cell Sequencing Data Unveils Efferocytosis Patterns and ceRNA Network in Ischemic Stroke.Transl Stroke Res. 2025 Jun;16(3):733-746. doi: 10.1007/s12975-024-01255-8. Epub 2024 Apr 28. Transl Stroke Res. 2025. PMID: 38678526
References
-
- Adams H. P., Jr., Bendixen B. H., Kappelle L. J., Biller J., Love B. B., Gordon D. L., et al. (1993). Classification of Subtype of Acute Ischemic Stroke. Definitions for Use in a Multicenter Clinical Trial. TOAST. Trial of Org 10172 in Acute Stroke Treatment. Stroke 24 (1), 35–41. 10.1161/01.str.24.1.35 - DOI - PubMed
-
- Allen C., Thornton P., Denes A., McColl B. W., Pierozynski A., Monestier M., et al. (2012). Neutrophil Cerebrovascular Transmigration Triggers Rapid Neurotoxicity through Release of Proteases Associated with Decondensed DNA. J. Immunol. 189 (1), 381–392. 10.4049/jimmunol.1200409 - DOI - PMC - PubMed
LinkOut - more resources
Full Text Sources
Research Materials
Miscellaneous