

Identification of Hub Genes With Differential Correlations in Sepsis
- PMID: 35401666
- PMCID: PMC8987114
- DOI: 10.3389/fgene.2022.876514
Identification of Hub Genes With Differential Correlations in Sepsis
Abstract
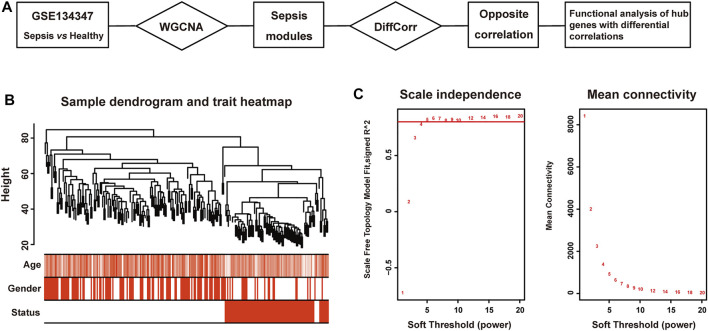
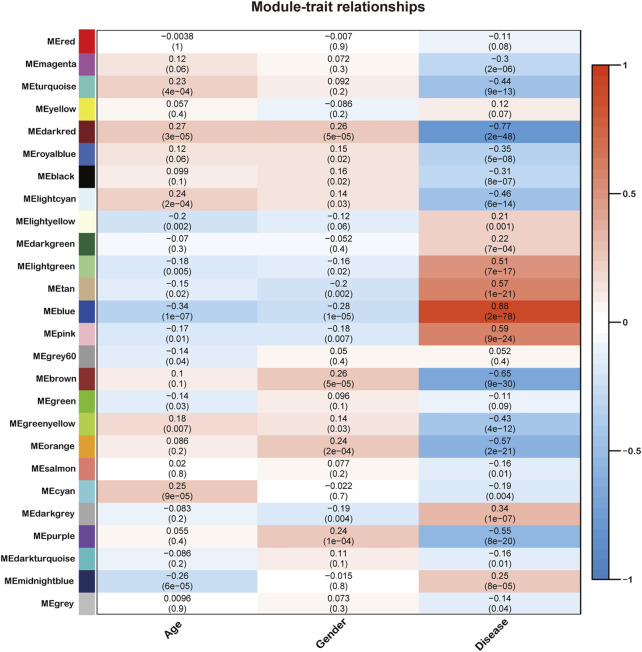
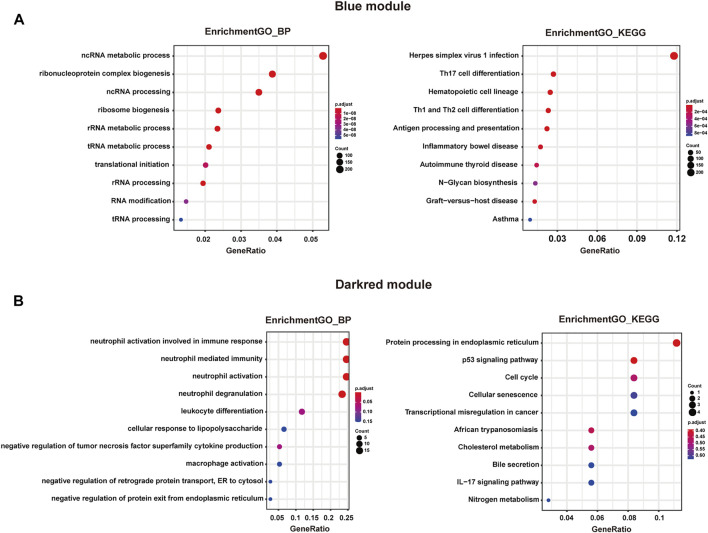
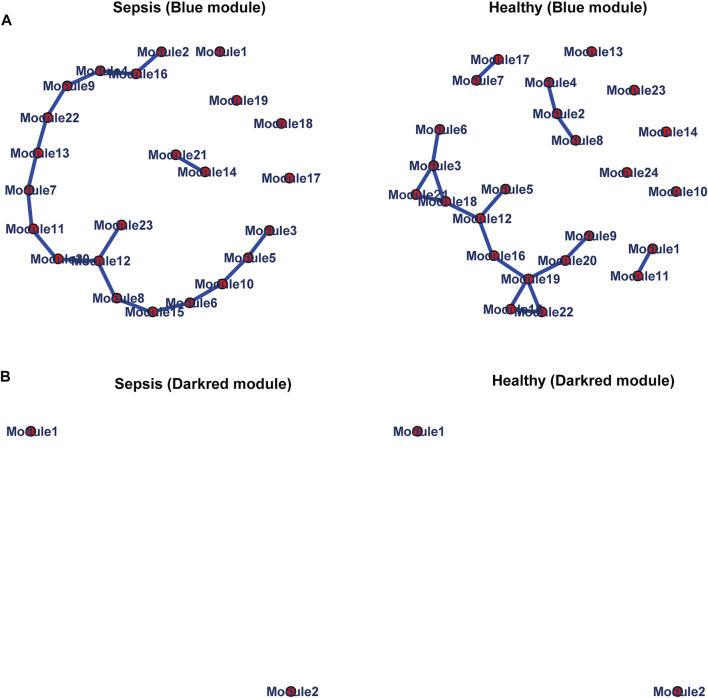
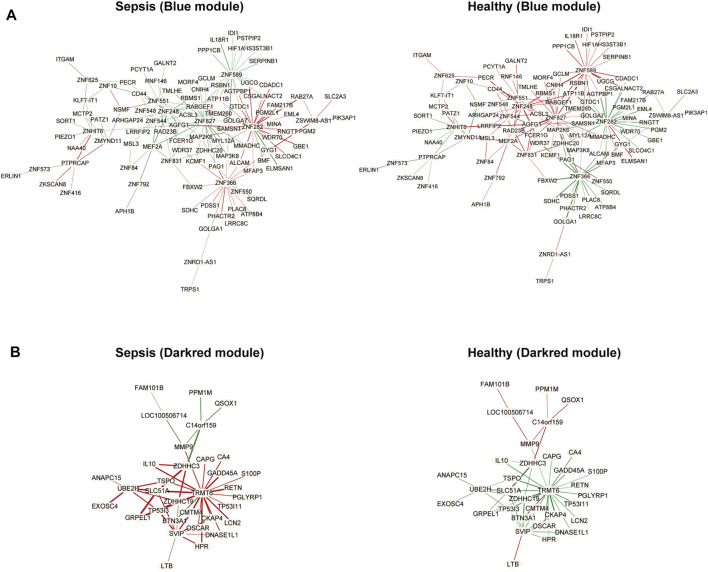
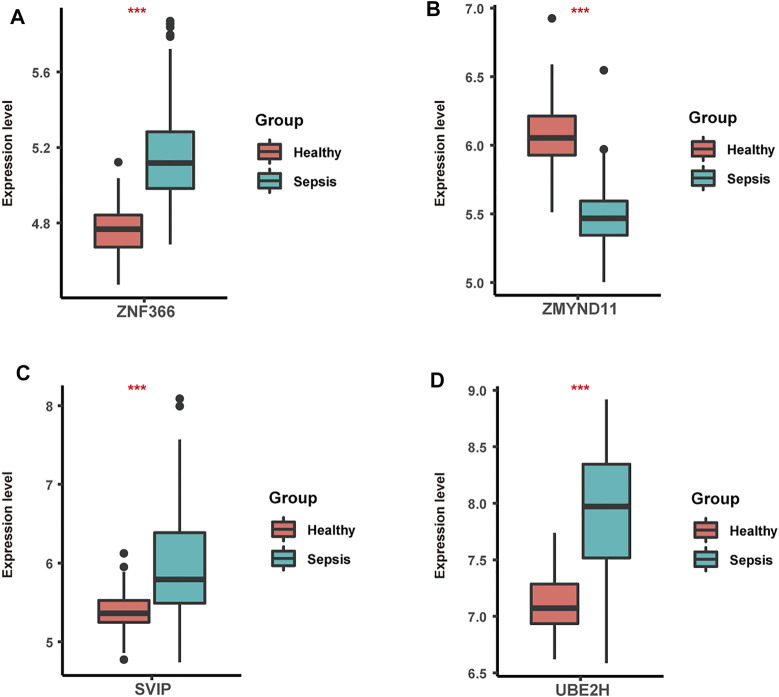
As a multifaceted syndrome, sepsis leads to high risk of death worldwide. It is difficult to be intervened due to insufficient biomarkers and potential targets. The reason is that regulatory mechanisms during sepsis are poorly understood. In this study, expression profiles of sepsis from GSE134347 were integrated to construct gene interaction network through weighted gene co-expression network analysis (WGCNA). R package DiffCorr was utilized to evaluate differential correlations and identify significant differences between sepsis and healthy tissues. As a result, twenty-six modules were detected in the network, among which blue and darkred modules exhibited the most significant associations with sepsis. Finally, we identified some novel genes with opposite correlations including ZNF366, ZMYND11, SVIP and UBE2H. Further biological analysis revealed their promising roles in sepsis management. Hence, differential correlations-based algorithm was firstly established for the discovery of appealing regulators in sepsis.
Keywords: WGCNA; biological analysis; differential correlation; regulatory network; sepsis.
Copyright © 2022 Sheng, Tong, Zhang and Feng.
Conflict of interest statement
The authors declare that the research was conducted in the absence of any commercial or financial relationships that could be construed as a potential conflict of interest.
Figures
Similar articles
-
Identification and Validation of Key Genes of Differential Correlations in Gastric Cancer.Front Cell Dev Biol. 2022 Jan 13;9:801687. doi: 10.3389/fcell.2021.801687. eCollection 2021. Front Cell Dev Biol. 2022. PMID: 35096829 Free PMC article.
-
Identification of Key Genes With Differential Correlations in Lung Adenocarcinoma.Front Cell Dev Biol. 2021 May 5;9:675438. doi: 10.3389/fcell.2021.675438. eCollection 2021. Front Cell Dev Biol. 2021. PMID: 34026765 Free PMC article.
-
Identification of vital modules and genes associated with heart failure based on weighted gene coexpression network analysis.ESC Heart Fail. 2022 Apr;9(2):1370-1379. doi: 10.1002/ehf2.13827. Epub 2022 Feb 6. ESC Heart Fail. 2022. PMID: 35128826 Free PMC article.
-
Identification of potential transcriptomic markers in developing pediatric sepsis: a weighted gene co-expression network analysis and a case-control validation study.J Transl Med. 2017 Dec 13;15(1):254. doi: 10.1186/s12967-017-1364-8. J Transl Med. 2017. PMID: 29237456 Free PMC article.
-
Identification of a novel four-gene diagnostic signature for patients with sepsis by integrating weighted gene co-expression network analysis and support vector machine algorithm.Hereditas. 2022 Feb 21;159(1):14. doi: 10.1186/s41065-021-00215-8. Hereditas. 2022. PMID: 35184762 Free PMC article.
Cited by
-
Identification and experimental validation of cuproptosis regulatory program in a sepsis immune microenvironment through a combination of single-cell and bulk RNA sequencing.Front Immunol. 2024 Jun 14;15:1336839. doi: 10.3389/fimmu.2024.1336839. eCollection 2024. Front Immunol. 2024. PMID: 38947313 Free PMC article.
-
ScHGSC-IGDC: Identifying genes with differential correlations of high-grade serous ovarian cancer based on single-cell RNA sequencing analysis.Heliyon. 2024 Jun 13;10(12):e32909. doi: 10.1016/j.heliyon.2024.e32909. eCollection 2024 Jun 30. Heliyon. 2024. PMID: 38975079 Free PMC article.
-
Excavation of gene markers associated with pancreatic ductal adenocarcinoma based on interrelationships of gene expression.IET Syst Biol. 2024 Dec;18(6):261-270. doi: 10.1049/syb2.12090. Epub 2024 Mar 26. IET Syst Biol. 2024. PMID: 38530028 Free PMC article.
-
High expression of LOC541471, GDAP1, SOD1, and STK25 is associated with poor overall survival of patients with acute myeloid leukemia.Cancer Med. 2023 Apr;12(7):9055-9067. doi: 10.1002/cam4.5644. Epub 2023 Jan 27. Cancer Med. 2023. PMID: 36708053 Free PMC article.
-
Predicting patients with septic shock and sepsis through analyzing whole-blood expression of NK cell-related hub genes using an advanced machine learning framework.Front Immunol. 2024 Nov 28;15:1493895. doi: 10.3389/fimmu.2024.1493895. eCollection 2024. Front Immunol. 2024. PMID: 39669564 Free PMC article.
References
-
- Abe T., Yamakawa K., Ogura H., Kushimoto S., Saitoh D., Fujishima S., et al. (2020). Epidemiology of Sepsis and Septic Shock in Intensive Care Units between Sepsis-2 and Sepsis-3 Populations: Sepsis Prognostication in Intensive Care Unit and Emergency Room (SPICE-ICU). j intensive care 8 (1). 10.1186/S40560-020-00465-0 - DOI - PMC - PubMed
LinkOut - more resources
Full Text Sources
Research Materials