

Impact of Pre-Anthesis Drought Stress on Physiology, Yield-Related Traits, and Drought-Responsive Genes in Green Super Rice
- PMID: 35401708
- PMCID: PMC8987348
- DOI: 10.3389/fgene.2022.832542
Impact of Pre-Anthesis Drought Stress on Physiology, Yield-Related Traits, and Drought-Responsive Genes in Green Super Rice
Abstract
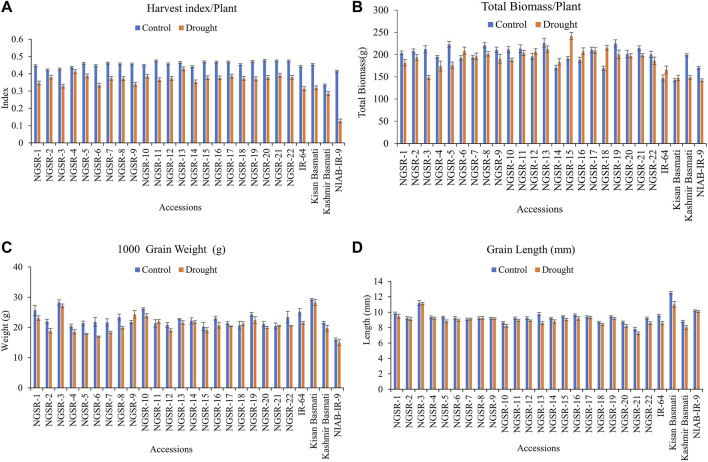
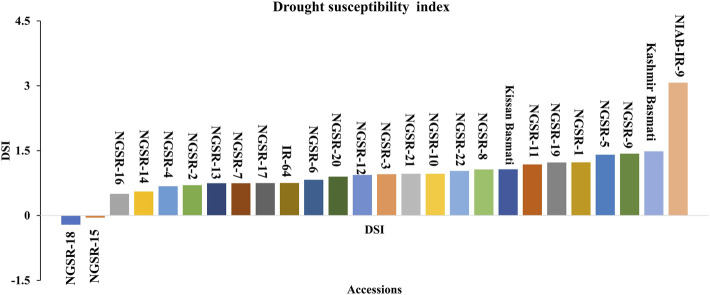
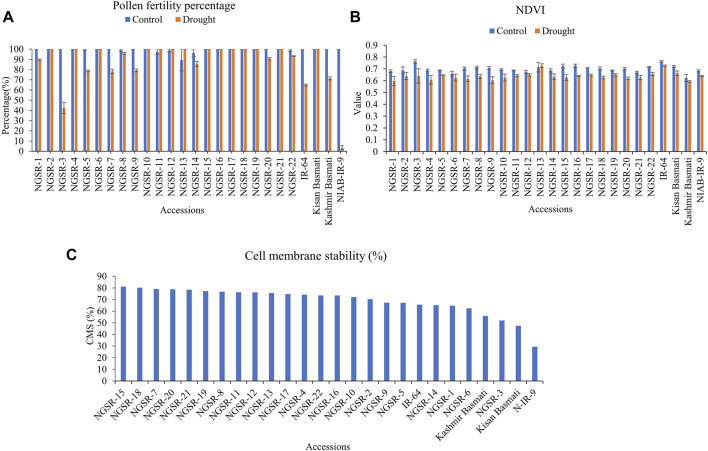
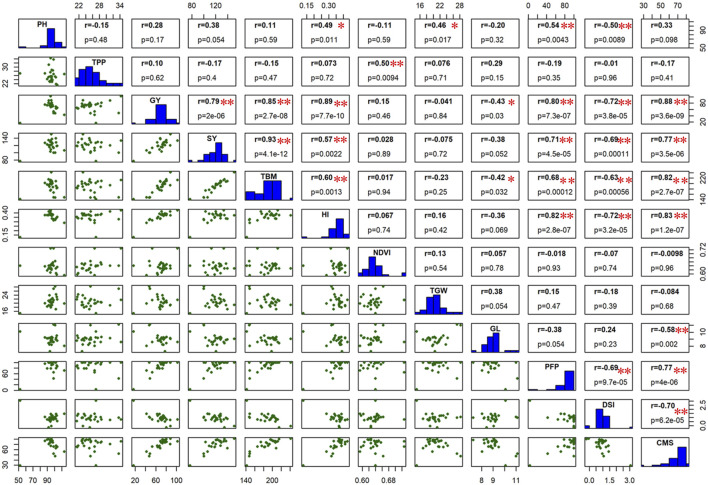
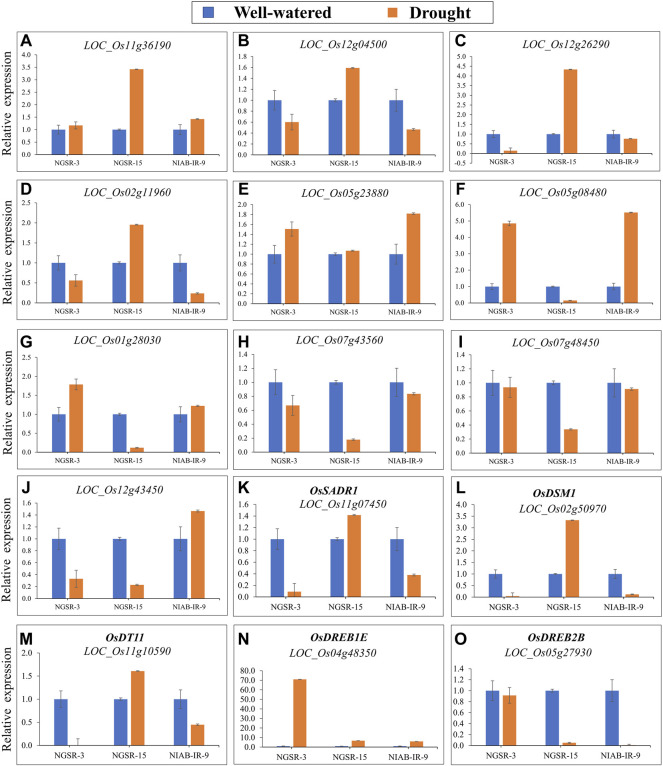
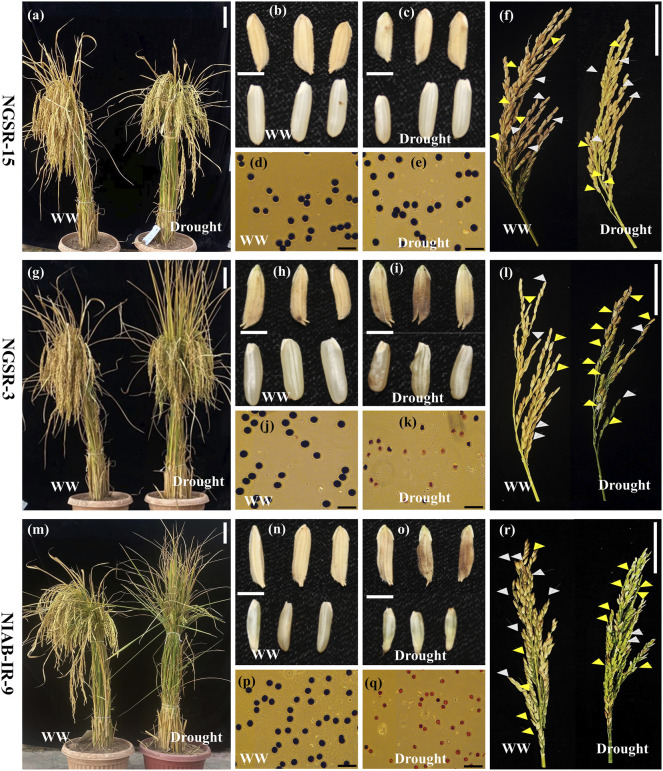
Optimum soil water availability is vital for maximum yield production in rice which is challenged by increasing spells of drought. The reproductive stage drought is among the main limiting factors leading to the drastic reduction in grain yield. The objective of this study was to investigate the molecular and morphophysiological responses of pre-anthesis stage drought stress in green super rice. The study assessed the performance of 26 rice lines under irrigated and drought conditions. Irrigated treatment was allowed to grow normally, while drought stress was imposed for 30 days at the pre-anthesis stage. Three important physiological traits including pollen fertility percentage (PFP), cell membrane stability (CMS), and normalized difference vegetative index (NDVI) were recorded at anthesis stage during the last week of drought stress. Agronomic traits of economic importance including grain yield were recorded at maturity stage. The analysis of variance demonstrated significant variation among the genotypes for most of the studied traits. Correlation and principal component analyses demonstrated highly significant associations of particular agronomic traits with grain yield, and genetic diversity among genotypes, respectively. Our study demonstrated a higher drought tolerance potential of GSR lines compared with local cultivars, mainly by higher pollen viability, plant biomass, CMS, and harvest index under drought. In addition, the molecular basis of drought tolerance in GSR lines was related to upregulation of certain drought-responsive genes including OsSADRI, OsDSM1, OsDT11, but not the DREB genes. Our study identified novel drought-responsive genes (LOC_Os11g36190, LOC_Os12g04500, LOC_Os12g26290, and LOC_Os02g11960) that could be further characterized using reverse genetics to be utilized in molecular breeding for drought tolerance.
Keywords: anthesis; correlation; drought; drought-responsive genes; grain yield; pollen fertility.
Copyright © 2022 Ahmad, Zafar, Naeem, Shokat, Inam, Rehman, Naveed, Xu, Li, Ali and Khan.
Conflict of interest statement
The authors declare that the research was conducted in the absence of any commercial or financial relationships that could be construed as a potential conflict of interest.
Figures


References
-
- Ahmed S., Rashid M. A. R., Zafar S. A., Azhar M. T., Waqas M., Uzair M. (2021). Genome-wide Investigation and Expression Analysis of APETALA-2 Transcription Factor Subfamily Reveals its Evolution, Expansion and Regulatory Role in Abiotic Stress Responses in Indica Rice (Oryza Sativa L. Ssp. Indica). Genomics 113 (1 Pt 2), 1029–1043. 10.1016/j.ygeno.2020.10.037 - DOI - PubMed
-
- Bajji M., Kinet J.-M., Lutts S. (2002). The Use of the Electrolyte Leakage Method for Assessing Cell Membrane Stability as a Water Stress Tolerance Test in Durum Wheat. Plant Growth Regul. 36 (1), 61–70. 10.1023/A:1014732714549 - DOI
-
- Barker R., Dawe D., Tuong T., Bhuiyan S., Guerra L. (1999). The Outlook for Water Resources in the Year 2020: Challenges for Research on Water Management in rice Production. Southeast Asia 1, 1–5.
-
- Blum A., Ebercon A. (1981). Cell Membrane Stability as a Measure of Drought and Heat Tolerance in Wheat 1. Crop Sci. 21 (1), 43–47. 10.2135/cropsci1981.0011183x002100010013x - DOI
LinkOut - more resources
Full Text Sources