. 2022 Mar 21;12(6):2908-2927.
doi: 10.7150/thno.69446. eCollection 2022.

5-Aminolevulinate improves metabolic recovery and cell survival of the liver following cold preservation

Affiliations

5-Aminolevulinate improves metabolic recovery and cell survival of the liver following cold preservation

Xiaomei Zhang et al. Theranostics. .

Abstract

Rationale: Hibernating thirteen-lined ground squirrels (GS; Ictidomys tridecemlineatus) are naturally adapted to prolonged periods of ultraprofound hypothermia (body temperature < 5 ºC) during torpor, and drastic oscillations of body temperature and ischemia/reperfusion-like stress during their short euthermic interbout arousals. Thus, their superior adaptability may hold tremendous promise for the advancement of donor organ cold preservation and subsequent organ transplantation. However, bridging hibernation research and translational medicine has been impeded by a dearth of in vitro research tools, till the recent establishment of the GS induced pluripotent stem cells (iPSCs). In this study, we reported the generation of functional hepatocyte-like cells (HLCs) from GS iPSCs. As temperature and oxygen supply affect cellular metabolism, we hypothesized that the GS HLCs can metabolically counter drastic temperature and oxygen supply changes. Differentially regulated metabolites can be evaluated and included into the preservation solution to mitigate temperature and ischemia/reperfusion-associated damage to donor livers. Methods: A protocol has been developed to produce GS iPSCs-derived HLCs. Comparative metabolomic analysis on GS HLCs and human donor liver samples revealed changes in metabolites caused by cold storage and rewarming. Human embryonic stem cell (ESC)-derived HLCs and ex vivo cold preservation and reperfusion of isolated rat livers were used to assess candidate metabolites that may have protective effects against preservation-related injuries. Results: GS iPSCs were efficiently differentiated into expandable, cryopreservation-compatible and functional HLCs. Metabolomic analysis unveiled distinct changes of mitochondrial metabolites between GS and human cells following cold storage and rewarming. GS and human HLC-based experiments indicated that the metabolism of 5-aminolevulinate (5-ALA) is key to restricting free radical production during rewarming. Survival of human HLCs was significantly increased following cold exposure and rewarming, as supplemented 5-ALA enhanced Complex III activity and improved mitochondrial respiration. Further, 5-ALA mitigated damage in rat livers following 48-h cold preservation and ex vivo reperfusion. Metabolomic and transcriptomic analyses revealed that supplemented 5-ALA promoted both anabolic and catabolic activities while alleviating cell death, inflammation, hypoxia and other stress responses in isolated perfused rat livers. Conclusion: In the liver, rewarming from ultraprofound hypothermia imposes complex metabolic challenges and stresses on the mitochondria. Metabolites such as 5-ALA can help alleviate mitochondrial stress. Supplementing 5-ALA to the liver preservation solution can substantially improve the functional recovery of rat livers following prolonged cold preservation, rewarming and reperfusion.

Keywords: 5-Aminolevulinate; Hepatocyte-like cells; Hibernator; Mitochondria; Organ preservation.


Conflict of interest statement

Competing Interests: The authors declare no competing financial interests. Two Chinese provisional patents for methods of differentiating HLCs from GS iPSCs, and screening protective metabolites based on these HLCs (Application SN: 202111397178.0), and the application and composition of a preservation solution (Application SN: 202111395499.7) have been filed by the Third Affiliated Hospital of Sun Yat-sen University.

Figures
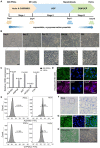
Figure 1
Figure 1
Differentiation of ground squirrel induced pluripotent stem cells (GS iPSCs) into functional hepatocyte-like cells (HLCs). (A) Schematic diagram of the three-stage protocol of GS iPSCs. (B) Representative images showing cellular morphological changes during the differentiation process; scale bars: 50 μm. (C) RT qPCR analysis of hepatocyte markers at the endpoint of stage III. GS iPSCs were used as control. Gene expression was normalized to that of ACTB. (D) Immunofluorescence staining of AAT and GS ALB-like proteins at the endpoint of stage III (n = 5 experiments); scale bar: 20 μm. (E) Percentage of ALB-like- and CYP3A4-positive cells of GS iPSCs and HLCs analyzed by flow cytometry (n = 3). (F) PAS staining showing glycogen storage in HLCs (n = 5); scale bar: 50 μm. (G) BODIPY staining indicating lipid storage in HLCs (n = 5); scale bar: 20 μm. (H) ICG uptake (left) and overnight-release (right) in HLCs (n = 5); scale bar: 200 μm. Data are expressed as mean ± SEM; Student's t-test for comparisons between iPSCs and HLCs; P values are indicated.
Figure 2
Figure 2
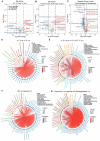
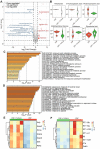
Metabolomic profiling of differentially regulated metabolites in GS HLCs subjected to temperature or oxygen supply change. Volcano plot of metabolites in GS HLCs at 37 °C versus 4 °C 4 h (A) up-regulated metabolites at 4 °C 4 h, red; down-regulated metabolites, blue) and 4°C 4 h versus 4 °C 4 h 37 °C 2 h (B) up-regulated metabolites at 4 °C 4 h 37 °C 2 h, red; down-regulated metabolites, blue); n = 3 culture replicates for each group. Also see Data S1. (C) Volcano plot analysis of differential metabolites in human donor livers during cold storage versus post-transplantation (rewarmed and perfused) group (n = 10 donors). Also see Data S2. (D) Chord plot depicting associations between metabolites in GS HLCs at 37 °C versus 4 °C 4 h; n = 3 culture replicates for each group. Metabolites are arranged by metabolite classes. The size of outer circle of each metabolite represents its Log2FC value. The inner red line indicates positive correlation and blue line indicates negative correlation. (E) Chord plot depicting associations between metabolites in GS HLCs at 4 °C 4 h versus 4 °C 4 h 37 °C 2 h; n = 3 culture replicates for each group. (F) Chord plot depicting associations between metabolites in GS HLCs of control versus hypoxia 4 h; n = 3 culture replicates for each group. (G) Chord plot depicting associations between metabolites in GS HLCs of hypoxia 4 h versus hypoxia 4 h reoxygenation 2 h; n = 3 culture replicates for each group. Also see Data S3.
Figure 3
Figure 3
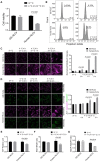
Rewarming-aggravated cell death and metabolic dysfunction in human HLCs. Viability of GS and human HLCs following 24-h cold exposure and then 2-h rewarming, measured by CCK8 (A) and Propidium Iodide staining (B) (n = 5 experiments). (C) Left: live imaging of MitoNeoD to assess mitochondrial ROS during 2-h rewarming in GS and human HLCs; scale bars: 20 μm; Right: quantification of MitoNeoD fluorescence intensity (n = 5 experiments). (D) Left: live imaging of JC-1 aggregate- and monomer-fluorescence to assess mitochondrial membrane potential (Δψm) in GS and human HLCs during 2-h rewarming; scale bars: 20 μm; Right: quantification of JC-1 aggregate/monomer intensity (n = 5 experiments). ATP levels (E), and the ratios of NAD+/NADH (F) and NADP+/NADPH (G) measured in rewarmed GS and human HLCs (n = 5 experiments). Data are expressed as mean ± SEM; Student's t-test for comparisons between GS and human; P values are indicated.
Figure 4
Figure 4
5-ALA metabolism and mitochondrial redox homeostasis in GS HLCs during temperature fluctuations. (A) Measurement of porphobilinogen (PBG), the downstream metabolite of 5-ALA metabolic pathway (see Figure S4A), at indicated conditions in GS HLCs (n = 3 experiments). (B) Left: immunoblots of ALAS1 in control siRNA- and ALAS1 siRNA-treated GS HLCs; Right: normalized intensity levels of ALAS1 protein (n = 3 experiments); NC: negative control. (C) Left: live imaging of MitoNeoD to evaluate mitochondrial ROS in GS HLCs at indicated conditions; scale bars: 20 μm; Right: normalized intensity levels of MitoNeoD (n = 3 experiments). Data are expressed as mean ± SEM; one-way ANOVA followed by Dunnett multiple-comparisons test versus 4 ºC 4 h (A) or NC (B-C); P values are indicated.
Figure 5
Figure 5
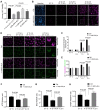
Cellular survival and metabolic recovery in rewarmed human HLCs facilitated by 5-ALA. (A) Cell viability in human HLCs at indicated conditions (n = 5 experiments). (B) Automatic high-content imaging of MitoNeoD fluorescence in human HLCs at indicated conditions; scale bars: 100 μm. (C) Quantitative analysis of MitoNeoD intensity per cell from (B) (n = 5 experiments). (D) Live imaging of JC-1 aggregate- and monomer-fluorescence in human HLCs at indicated conditions; scale bars: 20 μm. (E) Quantitative analysis of JC-1 aggregate/monomer intensity from (D) (n = 5 experiments). ATP levels (F), and the ratios of NAD+/NADH (G) and NADP+/NADPH (H) measured in human HLCs at indicated conditions (n = 5 experiments). Data are expressed as mean ± SEM; one-way ANOVA followed by Dunnett multiple-comparisons test versus 4 ºC 4 h-37 ºC 2 h (A) or Ctrl, 4 ºC 4 h-37 ºC 2 h (F-H); Student's t-test between two comparisons (C, E); P values are indicated.
Figure 6
Figure 6
5-ALA action through Complex III during rewarming in human HLCs. (A) Up: activity of Complex III measured in rewarmed human HLCs at indicated conditions; Down: activity of Complex IV measured in rewarmed human HLCs at indicated conditions (n = 5 experiments). (B) Automatic high-content imaging of MitoNeoD fluorescence in human HLCs at indicated conditions; scale bars: 100 μm. (C) Quantification of MitoNeoD fluorescence intensity from (B) (n = 5 experiments). (D) Schematic diagrams of a possible source of ROS overproduction from reverse electron transport (RET) (up) and the protective effect of 5-ALA via Complex III (down) during rewarming. Data are expressed as mean ± SEM; Student's t-test between two comparisons; P values are indicated; NS: not significant.
Figure 7
Figure 7
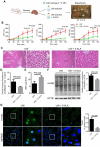
Cold preservation, rewarming and reperfusion-induced injuries ameliorated by 5-ALA in an isolated perfused rat liver model. (A) Schematic diagram showing the procedure for cold storage, rewarming and reperfusion of isolated rat livers. (B) The levels of aspartate aminotransferase (AST), alanine aminotransferase (ALT) and lactate dehydrogenase (LDH) in perfusate samples from isolated rat livers at indicated conditions; samples were collected every 20 min during perfusion (n = 6 animals per group). (C) Hematoxylin-eosin staining of rat liver sections; scale bar: 50 μm. Portal vein resistance (D) and bile production (E) in isolated rat livers at indicated conditions after 48-h storage at 4 ºC followed by 2-h normothermic reperfusion (n = 6 samples per group). (F) Left: immunoblots of proteins modified by 4-hydroxynonenal (4-HNE) from protein extracts of isolated rat livers after 2-h normothermic reperfusion; Right: normalized 4-HNE intensity levels (n = 3 experiments). (G) Left: TUNEL staining of rat liver sections at indicated conditions after 48-h storage at 4 ºC followed by 2-h normothermic reperfusion; scale bars: 20 μm; Right: percentage of TUNEL-positive apoptotic cells (n = 5 experiments). Data are expressed as mean ± SEM; Student's t-test between two comparisons; P values are indicated.
Figure 8
Figure 8
Metabolomic and transcriptomic assessments on the effects of 5-ALA treatment in isolated perfused rat livers. (A) Volcano plot of differential metabolites in isolated perfused rat livers following 48-h cold storage in UW solution versus UW solution supplemented with 5-ALA (up-regulated metabolites in UW + 5-ALA group, red; down-regulated metabolites, blue); n = 6 liver samples each group. (B) Violin Plots showing the abundance of some differential metabolites from (A). Also see Data S4. (C) Pathway analysis on transcripts up-regulated in rat livers of the UW + 5-ALA group; n = 4 liver samples each group. (D) Pathway analysis on transcripts up-regulated in rat livers of the UW group; n = 4 liver samples each group. (E) Heatmap showing the expression levels of selected genes that are involved in the acetyl-CoA and acyl-CoA metabolic pathways (see Data S5, pathway IDs GO:0006084 and GO:0006637). (F) Heatmap showing the expression levels of selected genes indicative of allograft failure (see Data S5, pathway IDs rno05332 and rno05330).

Similar articles

Cited by

References

    1. Stewart ZA. UW solution: still the "gold standard" for liver transplantation. Am J Transplant. 2015;15:295–6. - PubMed
    1. Saidi RF, Kenari SK. Liver ischemia/reperfusion injury: an overview. J Invest Surg. 2014;27:366–79. - PubMed
    1. Adam R, Delvart V, Karam V, Ducerf C, Navarro F, Letoublon C. et al. Compared efficacy of preservation solutions in liver transplantation: a long-term graft outcome study from the European Liver Transplant Registry. Am J Transplant. 2015;15:395–406. - PubMed
    1. Lozanovski VJ, Dohler B, Weiss KH, Mehrabi A, Susal C. The differential influence of cold ischemia time on outcome after liver transplantation for different indications-Who is at risk? A collaborative transplant study report. Front Immunol. 2020;11:892. - PMC - PubMed
    1. Ikeda T, Yanaga K, Kishikawa K, Kakizoe S, Shimada M, Sugimachi K. Ischemic injury in liver transplantation: difference in injury sites between warm and cold ischemia in rats. Hepatology. 1992;16:454–61. - PubMed

Publication types