. 2022 Mar 6;12(6):2658-2673.
doi: 10.7150/thno.64244. eCollection 2022.

Wound microenvironment-responsive glucose consumption and hydrogen peroxide generation synergistic with azithromycin for diabetic wounds healing

Affiliations

Wound microenvironment-responsive glucose consumption and hydrogen peroxide generation synergistic with azithromycin for diabetic wounds healing

Minqi Shi et al. Theranostics. .

Abstract

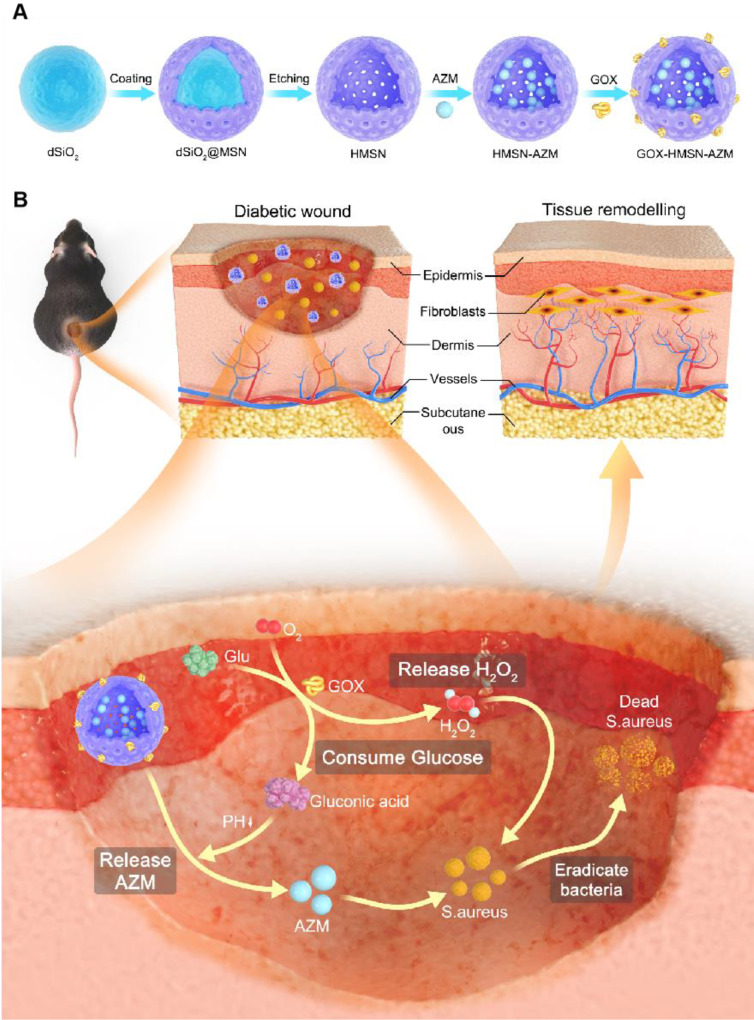
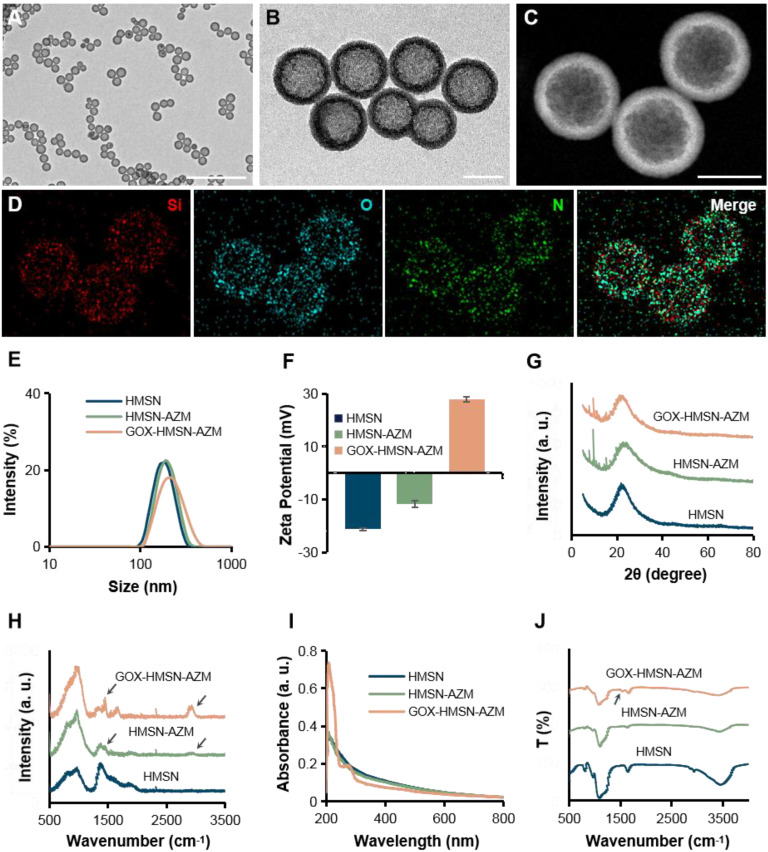
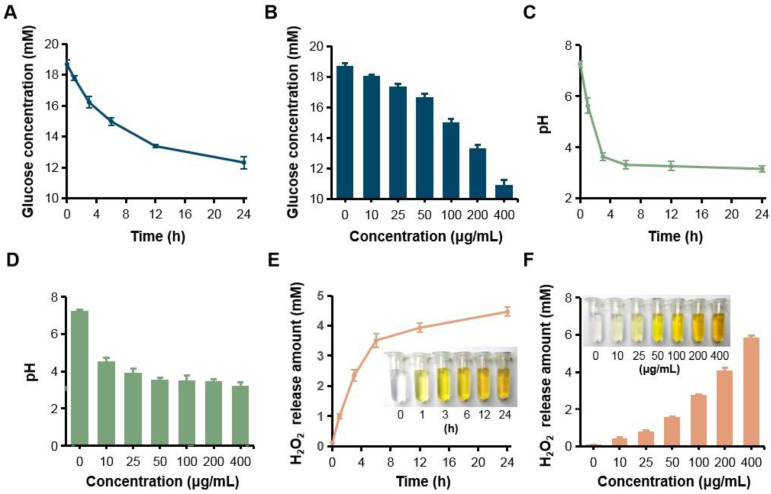
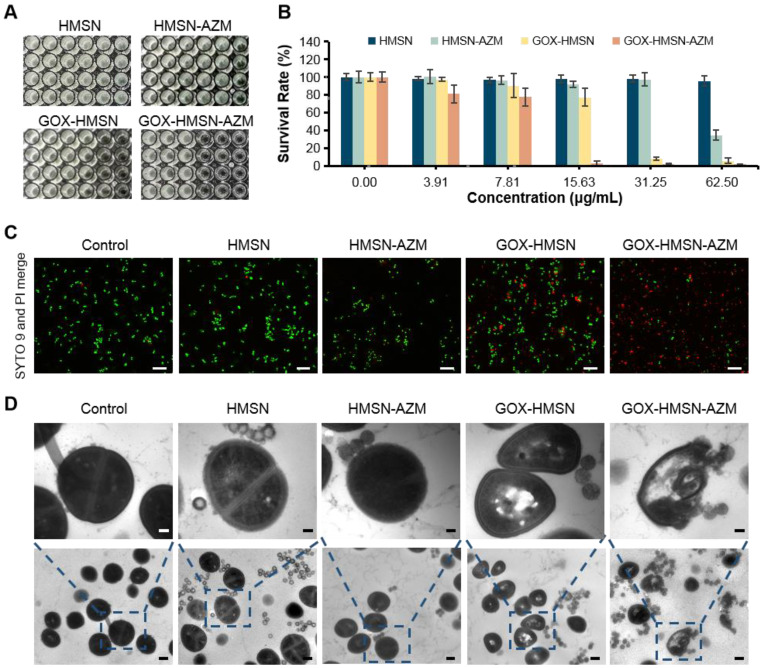
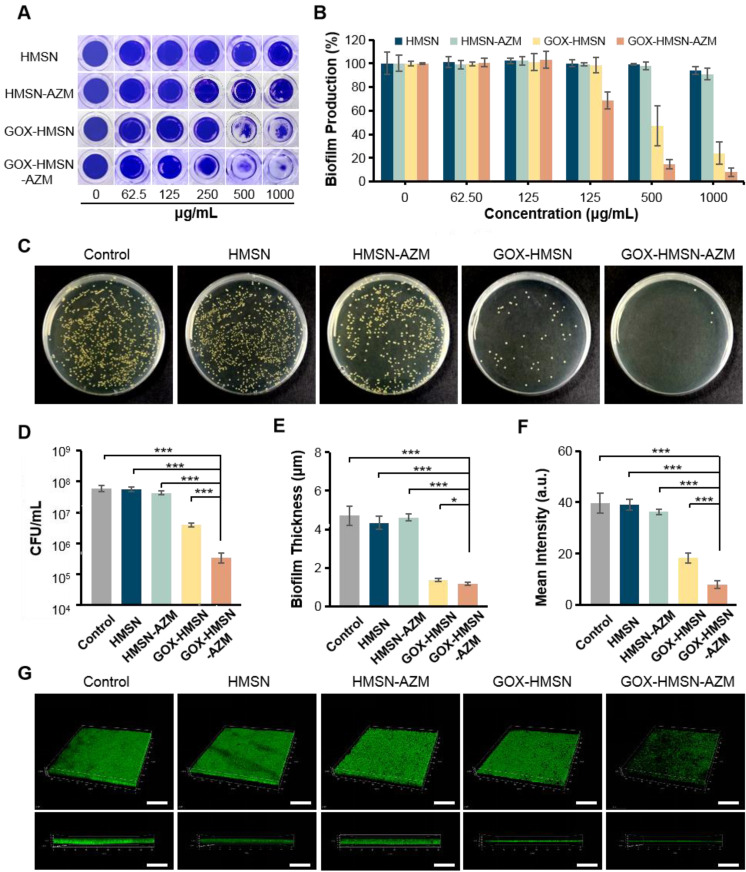
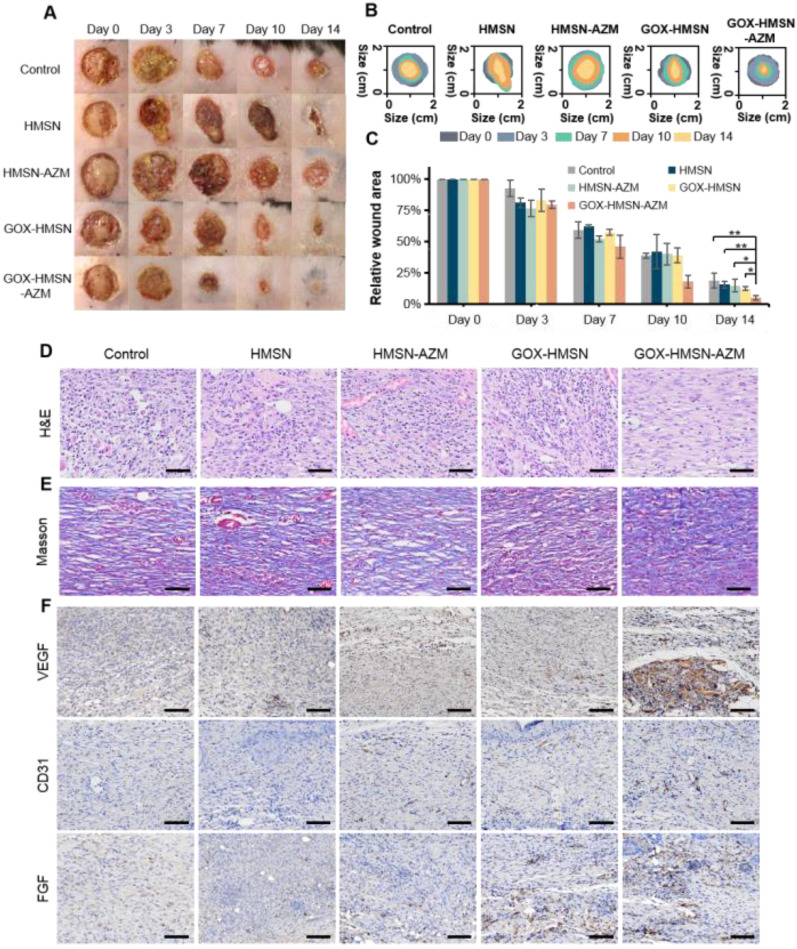
Rationale: Chronic wounds are one of the common complications of diabetes. Due to the physiological conditions of diabetic patients, these wounds are more susceptible to bacterial infections and the formation of bacterial biofilms, leading to the inefficiency of conventional antibiotic treatment. Methods: Here, hollow mesoporous silica nanoparticles (HMSN) were used as the nanocarriers for co-delivery of azithromycin (AZM) and glucose oxidase (GOX), achieving a remarkable synergistic effect in chronic diabetic wounds. GOX possesses the catalytic ability to consume glucose and produce H2O2 in the diabetic wound area. The down-regulation of local glucose could effectively improve the chronic diabetic wound microenvironment. Meanwhile, the generated H2O2 effectively inhibits bacterial growth and eradicates bacterial biofilms with the synergism of antibiotics AZM. Results: In the bacteria-infected diabetic cutaneous wound models, the reduction of glucose, generation of H2O2, and release of AZM could effectively reduce the bacterial infection and promote the wounds healing. Moreover, there is no obvious toxicity behavior after the treatment. Conclusions: Therefore, the designed nanosystem could effectively accelerate the diabetic wound healing process by the amelioration of the hyperglycemia microenvironment and the eradication of bacterial biofilms around the wounds, making them promising candidates for clinical transformation.

Keywords: azithromycin; bacterial biofilm; diabetic wound healing; glucose oxidase; silica nanoparticle.


Conflict of interest statement

Competing Interests: The authors have declared that no competing interest exists.

Figures

Scheme 1
Scheme 1
Schematic illustration of the design and application of GOX-HMSN-AZM for diabetic wounds healing. (A) The synthetic route of GOX-HMSN-AZM. (B) The schematic diagram of promoting the diabetic wounds healing with the treatment of GOX-HMSN-AZM.
Figure 1
Figure 1
Characterization of GOX-HMSN-AZM. (A-B) Representative TEM images of HMSN and GOX-HMSN-AZM. Scale bar = 1μm and 100 nm, respectively. (C) The high-angle annular dark-field (HAADF) stem image of GOX-HMSN-AZM. (D) Elemental mapping (Si, O, N, Merge) of GOX-HMSN-AZM. (E) Hydrodynamic diameter distribution and (F) Zeta potential of HMSN, HMSN-AZM and GOX-HMSN-AZM measured by dynamic light, respectively. (G) XRD patterns, (H) Raman spectra, (I) UV-vis-NIR absorption spectrum, and (J) FTIR spectra of HMSN, HMSN-AZM and GOX-HMSN-AZM, respectively.
Figure 2
Figure 2
H2O2 generation, glucose consumption and pH decrease by GOX-HMSN-AZM. (A) The glucose concentration variation under the catalyst of 200 μg/mL GOX-HMSN-AZM on different reaction times. (B) The glucose concentration under the catalyst of different concentrations of GOX-HMSN-AZM for 12 h. (C) pH variation on different reaction times under the catalyst of 200 μg/mL GOX-HMSN-AZM. (D) pH variation of glucose solution catalyzed by different concentrations of GOX-HMSN-AZM for 3h. (E) The concentration of generated H2O2 catalyzed by 200 μg/mL GOX-HMSN-AZM on different reaction times. (F) The concentration of generated H2O2 catalyzed by different concentrations of GOX-HMSN-AZM for 12 h.
Figure 3
Figure 3
In vitro antibacterial activity of GOX-HMSN-AZM. (A) Planktonic cultivation turbidity (S. aureus) with 0, 3.91, 7.81, 15.63, 31.25, 62.50 μg/mL of HMSN, HMSN-AZM, GOX-HMSN and GOX-HMSN-AZM after standard incubation for 24 h. (B) The corresponding survival rate of S. aureus incubated with different concentrations of HMSN, HMSN-AZM, GOX-HMSN and GOX-HMSN-AZM after 24 h. (C) Live/dead staining assay of S. aureus incubated with PBS, HMSN, HMSN-AZM, GOX-HMSN and GOX-HMSN-AZM by confocal fluorescence microscopy. Live bacteria were stained with SYTO9 (green) and dead bacteria were stained with PI (red). Scale bar = 20 μm. (D) TEM micrographs of S. aureus incubated with PBS, HMSN, HMSN-AZM, GOX-HMSN and GOX-HMSN-AZM. Up bar = 0.1 μm, bottom bar = 0.5 μm.
Figure 4
Figure 4
Antibiofilm Activity of GOX-HMSN-AZM. (A) Photographs of crystal violet-stained biofilms after different treatments. (B) The corresponding eradication effect of different treatments against S. aureus biofilms. (C) Photographs of bacterial colonies formed by S. aureus in biofilms which were treated with 500 μg/mL of PBS, HMSN, HMSN-AZM, GOX-HMSN and GOX-HMSN-AZM. (D) The corresponding colony forming unit (CFU) count of S. aureus in biofilms with different treatments. (E) The measurement of biofilm thickness. (F) The relative fluorescence intensity of biofilms after different treatments. (G) Three-dimensional confocal fluorescence microscopy images of S. aureus biofilms after different treatments. Live bacteria were stained with SYTO 9 (green fluorescence). Scale bar = 50 μm. (*p < 0.05, **p < 0.01, ***p < 0.001).
Figure 5
Figure 5
Promoting healing efficacy on diabetic cutaneous wound model. (A) The representative photographs of the S. aureus infectious wound on db/db mice after different treatments. (B) Traces of wound healing process of mice after different treatments. (C) Quantification of the percentage of wound healing area at different time points. (D) H&E staining, (E) Masson's trichrome staining and (F) immunohistochemical staining of VEGF, CD31 and FGF of the db/db mice dermal wound tissue at day 14 after treatments. Scale bar = 100 μm. (*p < 0.05, **p < 0.01, ***p < 0.001).
Figure 6
Figure 6
Preliminary toxicity study. (A) H&E staining of the major organs of the mice at 14 days after different treatments. Scale bar = 100 μm. (B) Blood biochemistry and hematology examination of the db/db mice 14 days after treatments. Blood biochemistry test. BUN, blood urea nitrogen; CREA, creatinine. Hematology examination. WBC, white blood cells; RBC, red blood cells; HGB, hemoglobin; HCT, hematocrit; MCV, mean cell volume; MCH, mean corpuscular hemoglobin; MCHC, mean corpuscular hemoglobin concentration; PLT, blood platelet.

Similar articles

Cited by

References

    1. Cho H, Blatchley MR, Duh EJ, Gerecht S. Acellular and cellular approaches to improve diabetic wound healing. Adv Drug Deliv Rev. 2019;146:267–288. - PubMed
    1. Guo S, Dipietro LA. Factors affecting wound healing. J Dent Res. 2010;89:219–229. - PMC - PubMed
    1. Patel S, Srivastava S, Singh MR, Singh D. Mechanistic insight into diabetic wounds: pathogenesis, molecular targets and treatment strategies to pace wound healing. Biomed Pharmacother. 2019;112:108615. - PubMed
    1. Eming SA, Martin P, Tomic-Canic M. Wound repair and regeneration: mechanisms, signaling, and translation. Sci Transl Med. 2014;6:265sr6. - PMC - PubMed
    1. Boateng JS, Matthews KH, Stevens HN, Eccleston GM. Wound healing dressings and drug delivery systems: a review. J Pharm Sci. 2008;97:2892–2923. - PubMed

Publication types