. 2022 Mar 14;12(6):2811-2832.
doi: 10.7150/thno.70098. eCollection 2022.

Cold atmospheric plasma for preventing infection of viruses that use ACE2 for entry

Affiliations

Cold atmospheric plasma for preventing infection of viruses that use ACE2 for entry

Peiyu Wang et al. Theranostics. .

Abstract

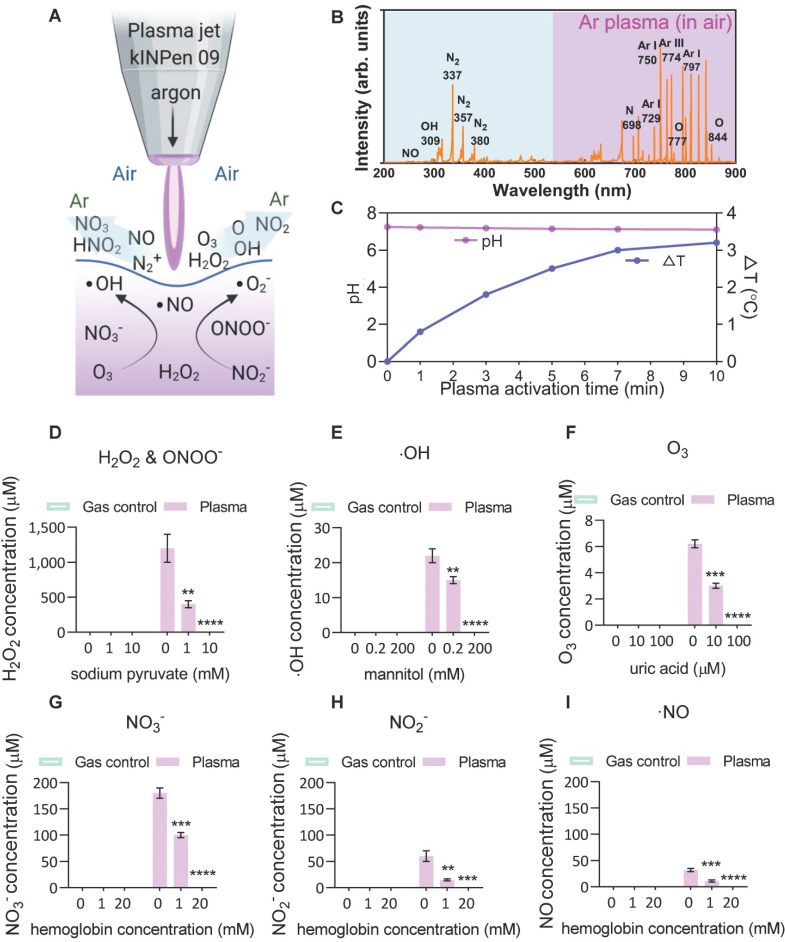
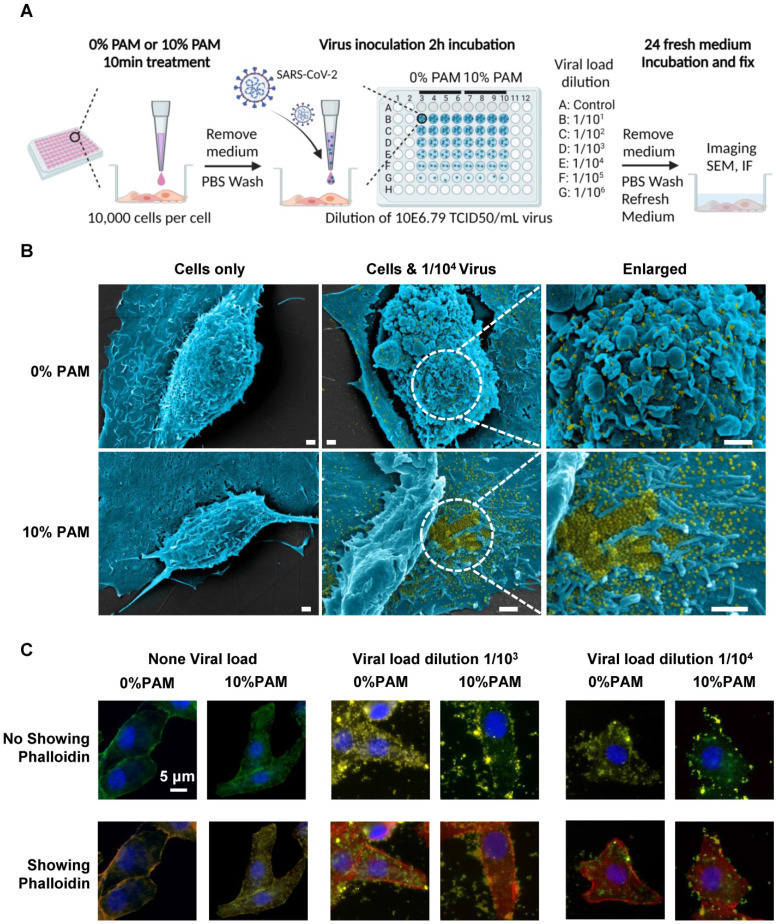
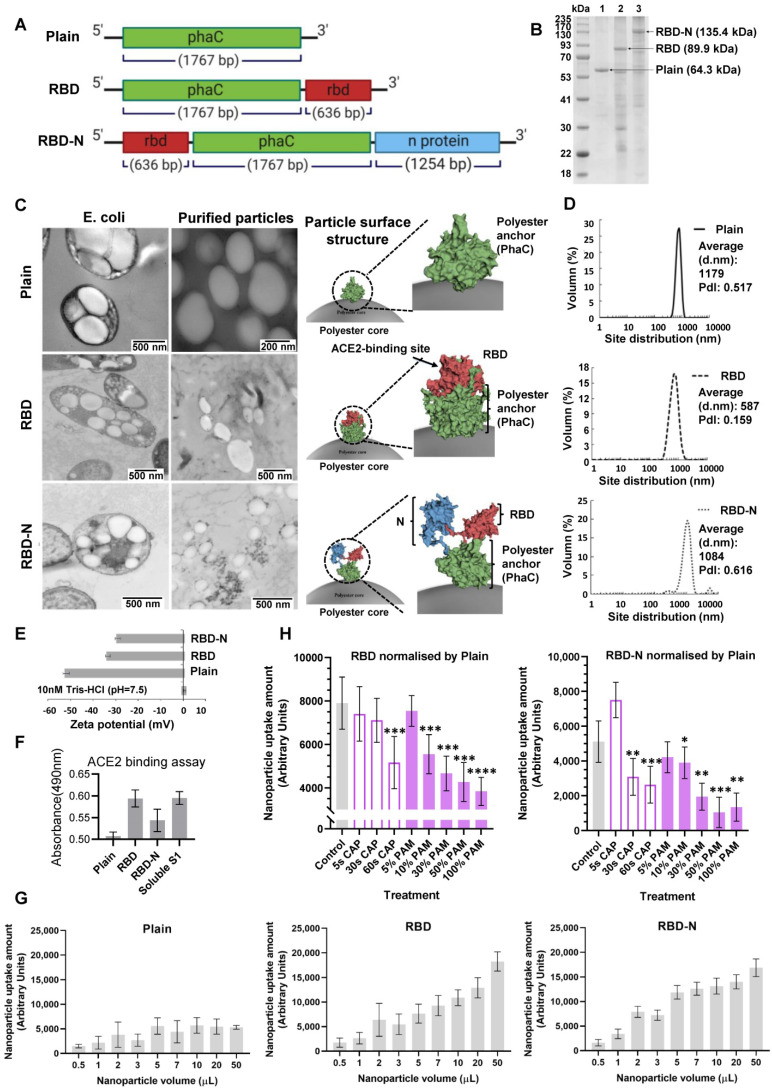
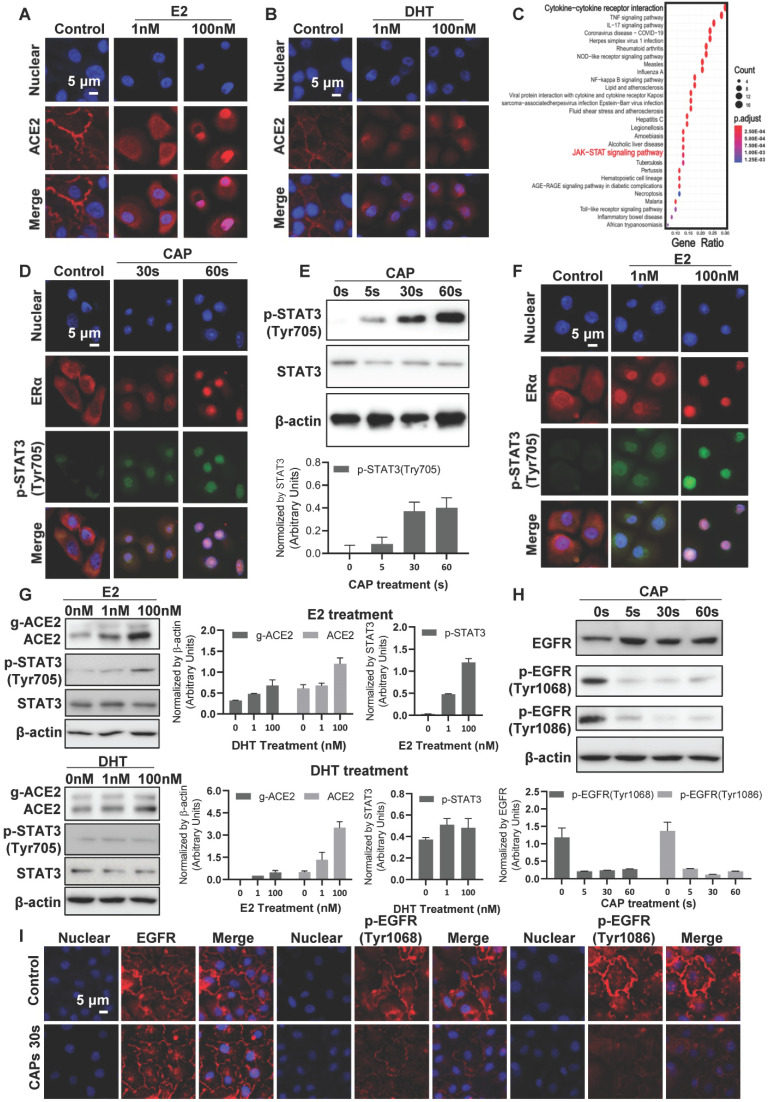
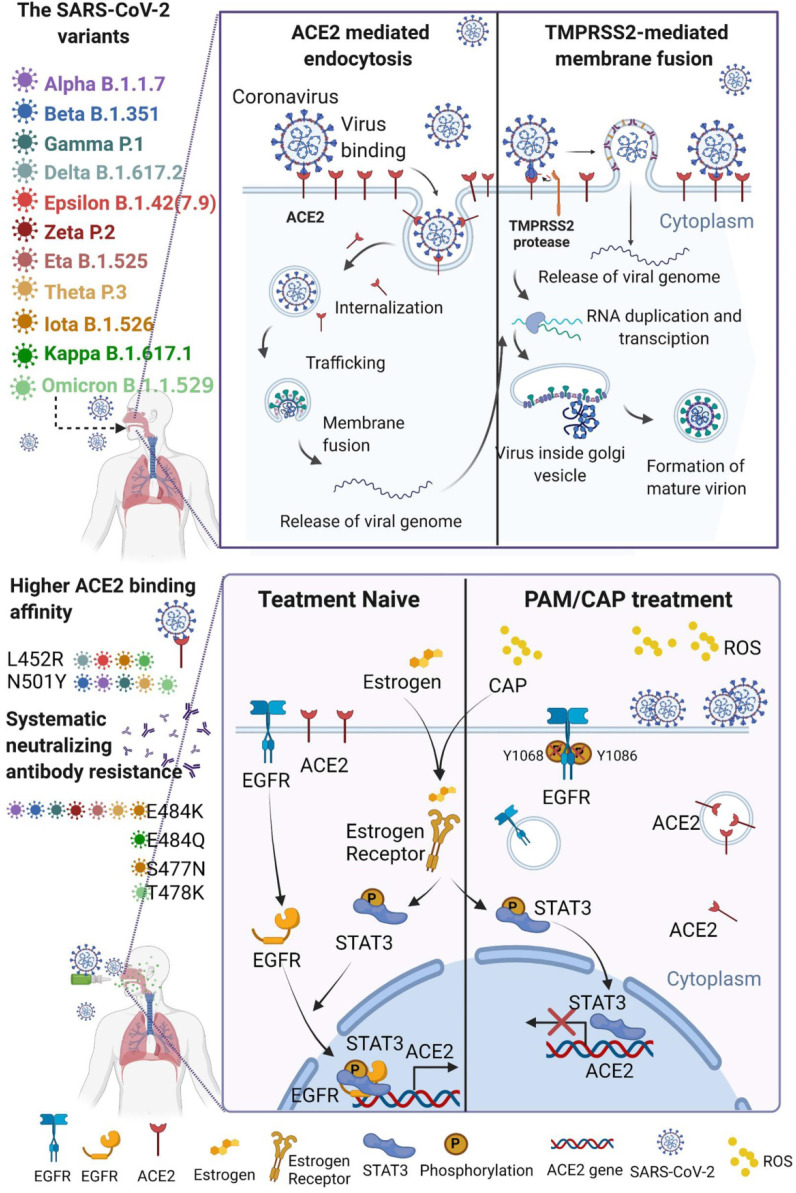
Rational: The mutating SARS-CoV-2 potentially impairs the efficacy of current vaccines or antibody-based treatments. Broad-spectrum and rapid anti-virus methods feasible for regular epidemic prevention against COVID-19 or alike are urgently called for. Methods: Using SARS-CoV-2 virus and bioengineered pseudoviruses carrying ACE2-binding spike protein domains, we examined the efficacy of cold atmospheric plasma (CAP) on virus entry prevention. Results: We found that CAP could effectively inhibit the entry of virus into cells. Direct CAP or CAP-activated medium (PAM) triggered rapid internalization and nuclear translocation of the virus receptor, ACE2, which began to return after 5 hours and was fully recovered by 12 hours. This was seen in vitro with both VERO-E6 cells and human mammary epithelial MCF10A cells, and in vivo. Hydroxyl radical (·OH) and species derived from its interactions with other species were found to be the most effective CAP components for triggering ACE2 nucleus translocation. The ERα/STAT3(Tyr705) and EGFR(Tyr1068/1086)/STAT3(Tyr705) axes were found to interact and collectively mediate the effects on ACE2 localization and expression. Conclusions: Our data support the use of PAM in helping control SARS-CoV-2 if developed into products for nose/mouth spray; an approach extendable to other viruses utilizing ACE2 for host entry.

Keywords: Angiotensin-converting enzyme 2; Plasma activated medium (PAM); SARS-CoV-2; cold atmospheric plasma (CAP).


Conflict of interest statement

Competing Interests: BHAR is co-founder and shareholder of PolyBatics Ltd. The other authors declare no competing financial interest.

Figures

Figure 1
Figure 1
Scheme of the plasma-liquid interactions and ROS/RNS fingerprints. (A) Representation of the atmospheric pressure plasma jet kINPen used in this study, and schematic of the ROS/RNS produced at the gas-liquid interface; (B) Optical emission spectroscopy (OES) of the plasma jet showing different types of reactive atoms and molecules such as reactive nitrogen species (RNS), hydroxyl radicals (·OH), and atomic oxygen (O); (C-I) major reactive species analyzed in the control and CAP-treated PBS in the presence or absence of different scavengers including hydrogen peroxide, nitrite, nitrate, nitric oxide, ozone and hydroxyl radical. Mannitol, uric acid, hemoglobin and sodium pyruvate were used to quench hydroxyl radical, ozone, nitric oxide, and H2O2, respectively. Data are representative of at least three experiments; statistical analysis was performed using one-way ANOVA (* p < 0.05; ** p < 0.01; *** p < 0.001).
Figure 2
Figure 2
Scheme of the CAP pre-treatment of cells for SARS-CoV-2 virus infection and the associated results. (A) Conceptual scheme illustrating the protocol used in the SARS-CoV-2 virus experiments. Vero E6 cells were pre-treated with non-toxic concentrations of plasma-activated medium (PAM), 10% PAM or 0% PAM (as control) for 10 minutes prior to SARS-CoV-2-infection with dilutions of stock virus (10E6.79 TCID50/mL virus) as indicated. Cells were incubated with 10% FCS RPMI-1640 medium for 24 hours before fixation and assessment of cell number and area, imaging, immunofluorescence and SEM; (B) Scanning electron microscopy under different folds of magnification showing extracellular virus on Vero E6 cells that underwent 0% PAM or 10% PAM pre-treatment prior to the infection with 1/104 dilution of 10E6.79 TCID50/mL SARS-CoV-2 virus. Extracellular viral particles are pseudocoloured in yellow; (C) Immunofluorescence for ACE2 (green) or SARS-CoV-2 viral particles (yellow), and staining for actin filaments (phalloidin; red) or DNA (Hoechst 33342; blue). Results were analyzed using the Incell 6500HS confocal high content screening microscope, and analyzed using the IN Carta Analysis software for automated unbiased analysis in a plane through the middle of the nucleus to assess staining within the cell or at the periphery.
Figure 3
Figure 3
Design, bioengineering, characterization, and functional assessment of self-assembled ACE2-binding polyester particles, and the efficacy of CAP in blocking their entry into Vero E6 cells. (A) Schematic diagram of hybrid genes used for the production of ACE2-binding polyester particles (plain PhaC particles, PhaC-RBD particles, and RBD-PhaC-N protein particles); (B) Protein profile analysis of purified ACE2 binding polyester particles using 10% Bis-Tris gel electrophoresis. kDa, molecular weight marker (GangNam-Stain prestained protein ladder; iNtRon); lane 1, PhaC (64.3 kDa); lane 2, PhaC-RBD (89.9 kDa); lane 3, RBD-PhaC-N protein (135.4 kDa); (C) TEM images of purified ACE2 binding polyester particles and the corresponding ClearColi BL21(DE3) cells harboring these particles. (Scale bars: cells, 500 nm; purified particles, 200 nm or 500 nm). TEM images of PhaC-RBD particles, RBD-PhaC-N protein particles, and cells harbouring these particles. The depicted structural models of PhaC, PhaC-RBD, and RBD-PhaC-N protein were deduced from Phyre2 Protein Fold Recognition Server. The protein surface was rendered using Pymol. Green, the polyester anchor PhaC; red, RBD domain; blue, N protein; (D) Size distribution measurement of ACE2-binding polyester particles. The size distribution of each particle sample was consecutively measured three times. Each data point of measurement represents the mean ± the standard error of the mean. d.nm, diameter in nanometer. PdI, polydispersity index; (E) The ζ-potential of ACE2 binding polyester particles. The measurement of ζ-potential was consecutively measured three times. Each data point of measurement represents the mean ± the standard error of the mean; (F) Functionality assessment of ACE2-binding polyester particles, produced in an endotoxin free host ClearColi BL21(DE3), as per an ACE2-RBD binding assay; (G) Immunofluorescence intensities showing the entry amounts of PhaC particles, PhaC-RBD particles, and RBD-PhaC-N protein particles under different supplementing volumes; (H) Immunofluorescence intensities showing the entry amounts of PhaC-RBD and RBD-PhaC-N protein particles as normalized by PhaC particles under different CAP exposure approaches. The normalization was done following formula image, and formula image. The Y axis shows fluorescence intensity (arbitrary units).
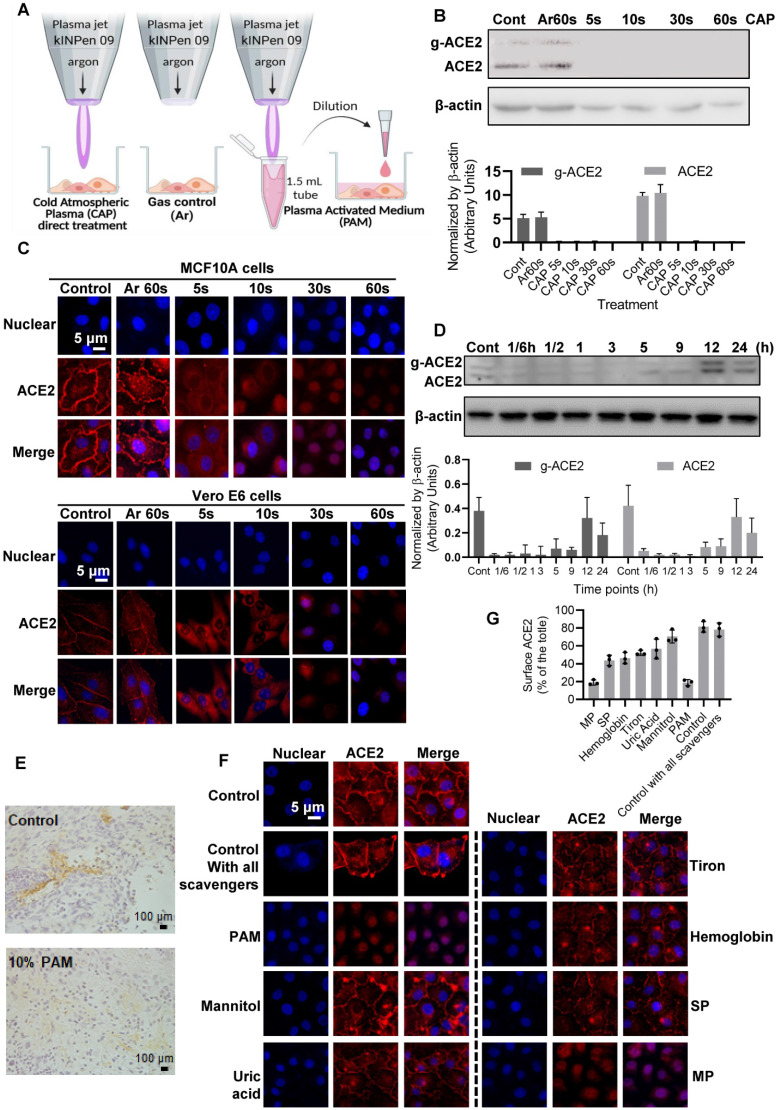
Figure 4
Figure 4
ACE2 expression and location after PAM treatment and examination of the active CAP components triggering such an effect. (A) Cells are treated directly with CAP or indirectly with PAM or gas control (Ar). (B) Western blot and quantification of ACE2 after direct CAP exposure as indicated. (C) Immunofluorescence images of ACE2 after direct CAP exposure in MCF10A and Vero E6 cells. (D) 30 s-PAM for 60 s treatment and wash with PBS. Refresh with 10% FBS RPMI-1640 medium for 1/6, 1/2, 1, 3, 5, 9, 12 and 24 h. The ACE2 protein expression levels were detected by Western blot. (E) IHC results from in vivo mouse experiments. Surface ACE2 expression as represented by glycolyzed ACE2 in cells with and without 10% PAM treatment using the SUM159PT-inoculated mice model. (F) Immunofluorescence images showing ACE2 localization and expression after direct CAP exposure for 30 s when different ROS scavengers were used, and signal quantification. In this assay, 200 mM mannitol, 100 μM uric acid, 20 mM tiron, 20 mM hemoglobin, 10 mM sodium pyruvate and 1 mM monopotassium were used to quench hydroxyl radical, ozone, superoxide anion, nitric oxide, H2O2, and e-, respectively. The second control in (A) and (B) was '60 s Argon (Ar) exposure'. The dosing effect of CAP was measured under different treatment durations in the form of plasma activated medium (PAM). MCF10A cells were used. 'g-ACE2' is short for 'glycosylated ACE2' and 'ACE2' represents 'non-glycosylated ACE2'. Scale bar: 5 μm. (G) The quanlification data of (F).
Figure 5
Figure 5
Cell signaling after direct CAP exposure for different durations. Immunofluorescence images showing ACE2 localization and expression in response to (A) E2, and (B) DHT. (C) KEGG pathways enriched by differentially expressed genes in human bronchial epithelial (NHBE) cells on SARS-CoV-2 infection. (D) Immunofluorescence images showing ERα and p-STAT3(Tyr705) location and expression after direct CAP exposure for different durations as indicated. (E) Western blot and quantification showing cell surface ACE2 (g-ACE2) ACE2, p-STAT3(Tyr705), STAT3 expression after direct CAP exposure for different durations. (F) Immunofluorescence images showing ERα and p-STAT3(Tyr705) location and expression in response to E2. (G) Western blot and quantification showing cell surface ACE2 (g-ACE2) ACE2, p-STAT3(Tyr705), STAT3 expression in response to E2 and DHT, respectively. MCF10A cells were used. 'g-ACE2' is short for 'glycosylated ACE2' and 'ACE2' represents 'non-glycosylated ACE2'. Scale bar: 5 μm. (H) Western blot and quantification showing EGFR and p-EGFR(Tyr1068/1086) expression after direct CAP exposure for different durations (0 s, 5 s, 30 s and 60 s). (I) Immunofluorescence images showing EGFR and p-EGFR(Tyr1068/1086) on 30 s direct CAP exposure.
Figure 6
Figure 6
Schematic representation of virus entry into host cells and plasma protection mechanism. SARS-CoV-2 and its mutated variants enter host cells by receptor-mediated endocytosis and/or TMPRSS2-mediated membrane fusion, which both rely on ACE2. The variants have higher affinity to ACE2 and are resistant to systemic neutralizing antibody. Both CAP or PAM and estrogen regulate ACE2 expression and cause ACE2 nuclear translocation that involves ERα/STAT3 signaling. Without ACE2 cell surface expression, SARS-CoV-2 virus loses entry and is blocked on the cell surface. CAP activates ERα that is translocated into the nucleus and contributes to enhanced ACE2 expression through the ER/STAT3(Tyr705)/EGFR(Tyr1068/1086) axis. When CAP exceeds a certain level, it suppresses EGFR(Tyr1068/1086), which blocks EGFR-dependent STAT3 signaling and consequently reduces ACE2 expression. MCF10A cells were used. Schematic figure created with BioRender.com (Access date: 10th June, 2021).

Similar articles

Cited by

References

    1. Chakraborty A, Ko C, Henning C, Lucko A, Harris JM, Chen F. et al. Synchronised infection identifies early rate-limiting steps in the hepatitis B virus life cycle. Cell Microbiol. 2020;22:e13250. - PMC - PubMed
    1. Inoue Y, Tanaka N, Tanaka Y, Inoue S, Morita K, Zhuang M. et al. Clathrin-dependent entry of severe acute respiratory syndrome coronavirus into target cells expressing ACE2 with the cytoplasmic tail deleted. J Virol. 2007;81:8722–9. - PMC - PubMed
    1. Liu R, Wang J, Shao Y, Wang X, Zhang H, Shuai L. et al. A recombinant VSV-vectored MERS-CoV vaccine induces neutralizing antibody and T cell responses in rhesus monkeys after single dose immunization. Antivir Res. 2018;150:30–8. - PMC - PubMed
    1. Hoffmann M, Kleine-Weber H, Schroeder S, Krüger N, Herrler T, Erichsen S. et al. SARS-CoV-2 cell entry depends on ACE2 and TMPRSS2 and is blocked by a clinically proven protease inhibitor. Cell. 2020;181:271–80. e8. - PMC - PubMed
    1. Iwata-Yoshikawa N, Okamura T, Shimizu Y, Hasegawa H, Takeda M, Nagata N. TMPRSS2 contributes to virus spread and immunopathology in the airways of murine models after coronavirus infection. J Virol. 2019. 93. - PMC - PubMed

Publication types

Substances